


En este trabajo se modela la fuente sísmica del tsunami de Jalisco-Colima del 9 de octubre de 1995 ajustando los resultados del modelo numérico del tsunami para reproducir adecuadamente las alturas de inundación del tsunami documentadas in situ durante los trabajos de reconocimiento del área afectada por el tsunami. La fuente sísmica corresponde a un sismo de magnitud Mw∼8.0 con un área de ruptura A = 9000 km2, L = 150km, W = 60km, con dislocación cosísmica heterogénea: dislocación de 1 m en los primeros 60km a lo largo del plano de falla iniciando en el extremo NW, mar adentro frente a Chalacatepec y Chamela, y dislocación de 3 m en los restantes 90km, mar adentro frente a Tenacatita, Navidad y Manzanillo. Como se esperaba, la fuente sísmica obtenida en este estudio es un modelo simplificado en comparación con la obtenida invirtiendo datos sísmicos y de GPS. Sin embargo, el hecho de que este modelo simplificado reproduzca aproximadamente la dislocación cosísmica y el área de ruptura y su localización, es importante para validar la fuente sísmica de aquellos tsunamis históricos de los que únicamente se cuenta con algunos testimonios y relatos vagos de sus efectos y de los cuales no existen registros sísmicos ni del nivel del mar.
A model of the seismic source of the October 9, 1995 Jalisco-Colima tsunami is obtained using the numerical modeling of the tsunami as constrained by field survey reports of tsunami run-up and the extent of flooding, by considering an earthquake (Mw∼8.0) with rupture area A = 9000 km2, L = 150km, W = 60km, with two different coseismic dislocation patches: 1 m the dislocation of the first 60km along the fault plane starting from its NW edge, offshore Chalacatepec and Chamela, and 3 m the dislocation of the next 90km; offshore Tenacatita, Navidad and Manzanillo. As expected, the seismic source obtained in this study is a simplified model in comparison of the seismic source obtained by inverting seismic and GPS data. However, the fact that this simplified model reproduces adequately the location of the rupture area and its coseismic dislocation is still important in order to provide some degree of certainty for the tsunami source of those historical tsunamis for which no seismic nor tide records are available, and only testimonies and vague relates of its effects are documented.
In this region, the North-American, Pacific, and Rivera lithospheric plates are interacting and several models of triple junctions have been proposed, but the seismotectonic setting is still poorly understood. A tectonic unit known as the Jalisco block has been proposed in this region (Luhr et al., 1985). The Jalisco block extends northward from the Colima graben, along the Pacific coast, and connects at its northern end with two other major extensional structures: the Tepic-Zacoalco rif zone (trending roughly northwest-southeast), which is defined as the northern boundary of the Jalisco block; and the Chapala rift zone (trending roughly east-west). The connection between the northwest border of the Jalisco block (the Tamayo Fault Zone (Tamayo FZ) and the continent is not well defined. Previous studies have related this border to the San Blas fault as a continuation of the Tamayo FZ or to the Tres Marías escarpment (west of Marias Islands) and the Río Ameca graben which crosses the Bahía de Banderas and continues along the Vallarta graben to join the Tepic-Zacoalco rif zone (Figure 1). Another possible connection is to the Tres Marías escarpment. The last two possibilities suggest the existence of an additional small block, the Tres Marías block, which may be experiencing strong crustal stresses as a result of the convergence direction of the Rivera plate (Kostoglodov and Bandy, 1995).
Regional seismicity.")
The seismicity in the coast of Jalisco is associated with the subduction of the Rivera plate beneath the Jalisco block. Macroseismic data of seismicity in the region date back to 1544 and are described by Núñez-Cornú (2011). It is believed that both the 1932 earthquakes (Figure 2) ruptured the entire seismogenic contact between the Rivera plate and the Jalisco block (Singh et al., 1985): The June 3, 1932 earthquake (M8.2) with an estimated rupture area of L = 220km and W = 80km; and the June 18, 1932 earthquake (M7.8) with an estimated rupture area of L = 60km, and W = 80km. Moreover, the complexity of this tectonic region reflects the existence of unknown or unstudied structures which may generate medium size earthquakes (M7.0-7.6), as the one occurred near Marias Islands, where the M7.0 earthquake turned down masonry buildings of the presidio in María Madre island on December 3, 1948.
. RFZ: Rivera Fracture Zone; R1: Armería River; R2: Cohuayana River; MIA: Maximum Intensity Areas for earthquakes in 1932 (dates and magnitudes indicated); AA: Aftershocks Areas; Cities; H 2003 Epicenter of the Armería earthquake (after Núñez-Cornú et al., 2004) and H 2010 Marias Islands earthquake.")
Seismotectonic features of the Jalisco region, modified from Rutz López et al. (2013). RFZ: Rivera Fracture Zone; R1: Armería River; R2: Cohuayana River; MIA: Maximum Intensity Areas for earthquakes in 1932 (dates and magnitudes indicated); AA: Aftershocks Areas; Cities; H 2003 Epicenter of the Armería earthquake (after Núñez-Cornú et al., 2004) and H 2010 Marias Islands earthquake.
Shallow thrust earthquakes have also occurred resulting from intraplate activity, such as the M7.4 January 22, 2003 earthquake, located on the coast near of the city of Armería, Colima (Núñez-Cornú et al., 2004, 2010).
The last large earthquake (M8.0) and tsunami in the southern part of the Jalisco Blok occurred on October 9, 1995. The rupture area was estimated to be L = 160 ± 20km, W = 60km (Ortiz et al., 1998; and Ortiz et al., 2000), with a dislocation of less than 5 m. This rupture zone represents only the southern half of the area proposed by Singh et al. (1985) for the earthquakes of 1932, therefore the northern coast of Jalisco and Bahía de Banderas, Nayarit, remains to break.
Tsunamis in MexicoThe Mexican tide gauge network began in 1952, since then, until 1985 (Sanchez and Farreras, 1993), non-destructive transoceanic or distant generated tsunamis have been recorded with maximum heights in the range of 0.1 ≤ h ≤ 2.5 m. These distant tsunamis were caused by major earthquakes in areas of high seismicity, such as Alaska, Chile, Colombia, Kuril Islands, Japan, Kermadec, Kamchatka, and Perú.
While recent (Sumatra 2004; Chile 2010; Japan 2011) and historical (Chile 1960; Alaska 1964; Aleutians 1957) distant tsunamis have not generated damage on the west coast of Mexico, historical destructive tsunamis were originated by local earthquakes with seismic moment magnitude Mw≥7, along the interplate contact area located between the coast and the Middle America Trench, such as the one occurred off the coast of Oaxaca in 1787 (Núñez-Cornú et al., 2008).
Local tsunamis in JaliscoIn the case of Jalisco, to the twentieth century, there are records of locally generated destructive tsunamis, three of them in June 1932 and one in October 1995. Historical reports mixed different tsunami damage in the month of June 1932, since the three of them occurred in a very short period of time in a sparsely populated and poorly communicated region. There is little information of these tsunamis and no published studies about its source mechanism. It is estimated that two of them were generated after the first two large earthquakes and the other probably by a submarine slump of sediments provided by the Armería River.
The June 3, 1932 tsunami, associated to the M8.2 earthquake, was observed to flood Barra de Navidad and partially flooded the port of San Blas, Nayarit. In Manzanillo Bay, the coast guard ship was in danger of running aground and capsizing due to the rapid sea level change. In Santiago Bay, the sea level rose about 3 m. In Cuyutlán, the coast seemed to rise and the sea flooded the resort, sweeping away several houses (Sanchez and Farreras, 1993).
After the June 18, 1932 earthquake (M7.8), the sea level in Manzanillo Bay decreased and then rose about 1 m. Sea waters flooded part of the port, and large part of the rocky coast lost its previous shape. Some of the shoals indicated in nautical charts disappeared.
The tsunami produced on the June 22, 1932 earthquake (M7.7) was the most destructive of all those produced in this region. It destroyed the resort of Cuyutlán. The estimated maximum height was h ≤ 15 m and the average extent of flooding was 1km along 20km of coast. This tsunami was generated probably by a submarine slump of sediments provided by the Armería River and accumulated on the continental shelf, to one of the creeks of the Middle America Trench (Ortiz, cited by Pacheco et al., 1997). Cuyutlán was invaded by two tsunami waves of less intensity: one during the night of 22 June, and the other in the morning of the next day (Sanchez and Farreras, 1993).
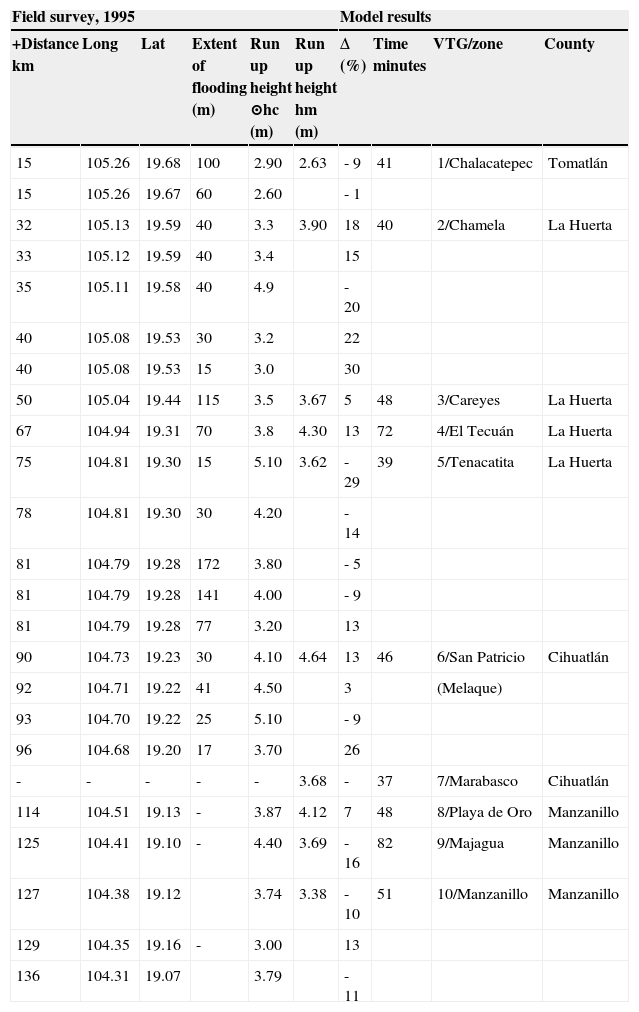
The most recent and well documented tsunami in Jalisco is the one that occurred on the morning of October 9, 1995. “Historical” testimonies of the inhabitants describing the manner in which the waves invaded the coast were carefully collected, and the extent and height of the flooding or tsunami run-up along the Jalisco and Colima coasts were documented during the tsunami field survey conducted by Ortiz et al., (1995), where the observed run- up heights were corrected or reduced to the height (hc) above the tide level at the time of flooding. The highest tsunami run-up (hc ∼ 5m) was observed in Tenacatita Bay in the towns of La Manzanilla and Boca de Iguanas. Figure 3, illustrates the tsunami flooding marks inside and outside the temple of La Manzanilla, Jalisco. The extents of flooding and run-up heights are shown in Table 1.
.")
To illustrate the tsunami flooding marks inside and outside the temple of La Manzanilla, Jalisco, modified from Ortiz et al. (1995).
Synthetic and observed tsunami run-up heights.
| Field survey, 1995 | Model results | ||||||||
|---|---|---|---|---|---|---|---|---|---|
| +Distance km | Long | Lat | Extent of flooding (m) | Run up height ⊙hc (m) | Run up height hm (m) | Δ (%) | Time minutes | VTG/zone | County |
| 15 | 105.26 | 19.68 | 100 | 2.90 | 2.63 | - 9 | 41 | 1/Chalacatepec | Tomatlán |
| 15 | 105.26 | 19.67 | 60 | 2.60 | - 1 | ||||
| 32 | 105.13 | 19.59 | 40 | 3.3 | 3.90 | 18 | 40 | 2/Chamela | La Huerta |
| 33 | 105.12 | 19.59 | 40 | 3.4 | 15 | ||||
| 35 | 105.11 | 19.58 | 40 | 4.9 | - 20 | ||||
| 40 | 105.08 | 19.53 | 30 | 3.2 | 22 | ||||
| 40 | 105.08 | 19.53 | 15 | 3.0 | 30 | ||||
| 50 | 105.04 | 19.44 | 115 | 3.5 | 3.67 | 5 | 48 | 3/Careyes | La Huerta |
| 67 | 104.94 | 19.31 | 70 | 3.8 | 4.30 | 13 | 72 | 4/El Tecuán | La Huerta |
| 75 | 104.81 | 19.30 | 15 | 5.10 | 3.62 | - 29 | 39 | 5/Tenacatita | La Huerta |
| 78 | 104.81 | 19.30 | 30 | 4.20 | - 14 | ||||
| 81 | 104.79 | 19.28 | 172 | 3.80 | - 5 | ||||
| 81 | 104.79 | 19.28 | 141 | 4.00 | - 9 | ||||
| 81 | 104.79 | 19.28 | 77 | 3.20 | 13 | ||||
| 90 | 104.73 | 19.23 | 30 | 4.10 | 4.64 | 13 | 46 | 6/San Patricio | Cihuatlán |
| 92 | 104.71 | 19.22 | 41 | 4.50 | 3 | (Melaque) | |||
| 93 | 104.70 | 19.22 | 25 | 5.10 | - 9 | ||||
| 96 | 104.68 | 19.20 | 17 | 3.70 | 26 | ||||
| - | - | - | - | - | 3.68 | - | 37 | 7/Marabasco | Cihuatlán |
| 114 | 104.51 | 19.13 | - | 3.87 | 4.12 | 7 | 48 | 8/Playa de Oro | Manzanillo |
| 125 | 104.41 | 19.10 | - | 4.40 | 3.69 | - 16 | 82 | 9/Majagua | Manzanillo |
| 127 | 104.38 | 19.12 | 3.74 | 3.38 | - 10 | 51 | 10/Manzanillo | Manzanillo | |
| 129 | 104.35 | 19.16 | - | 3.00 | 13 | ||||
| 136 | 104.31 | 19.07 | 3.79 | - 11 | |||||
+ Distance along the fault plane illustrated in Figure 4, starting from its NW edge.
⊙ hc = Obseved tsunami run up height (Ortiz et al.,1995)
hm = Synthetic run-up height
Δ(%) = 100 (hm-hc)/hc; relative difference
In spite of the very well documented seismic source of the October 9, 1995 Jalisco-Colima tsunami by inverting seismic and GPS data (see e.g., Courboulex et al., 1997; and Pacheco et al.,1997), inversion of this “historical” tsunami run-up records to model the 1995 Jalisco tsunami source is still important in order to provide some degree of certainty for the tsunami source of those historical tsunamis for which no seismic nor tide records are available, and only testimonies and vague relates of its effects are documented.
MethodThis paper follows the methodology used by Núñez-Cornú et al. (2008) to model the mechanism of the 1787 Tsunami source from historical data of the effects of flooding waves.
The rupture length of the October 9, 1995 Jalisco-Colima earthquake is estimated here as the length along the coast where tsunami flooding was observed (150-160km, from Chalacatepec to Cuyutlán; Ortiz et al. (1995). In turn, to delineate the extent of the flooding of the tsunami we used the observed tsunami run-up data (Ortiz et al., 1995). The run-up height (hc) facilitates the delineation of the extent of flooding on the regional digital terrain elevation model by interpolating hc along the coast.
The rupture area proposed here (Figure 4), is a buried fault plane of L = 150km, W = 60km, dipping 11° towards the coast at the depth of 10km in the interplate region, corresponding to an earthquake of Mw∼8.0, according to the relation:
where A is the area in km2 (Utsu and Seki, 1954; Wyss, 1979, Singh et al., 1980). To this case, we are using an upper limit of Mw∼8.0 obtained by seismic information (Pacheco et al., 1997).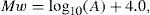
 assumed in the numerical modeling of tsunami. Black dots indicate locations where tsunami run-up heights (hc) were surveyed by Ortiz et al., (1995). Black triangles indicate VTG locations where model results or synthetic run-up values (hm) were obtained.")
Map of the region and location of rupture area and subareas (rectangles) assumed in the numerical modeling of tsunami. Black dots indicate locations where tsunami run-up heights (hc) were surveyed by Ortiz et al., (1995). Black triangles indicate VTG locations where model results or synthetic run-up values (hm) were obtained.
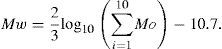
The total area is composed by ten segments with individual subareas Ai = 30×30km. The seismic moment Moi of each one of the segments may be varied by varying the coseismic dislocation (di) according to the relationship Moi = μ Ai di, to fit the moment magnitude of the earthquake (Hanks and Kanamori, 1979). Moment estimates assume a rigidity modulus μ = 5x10¹¹ dyne/cm2):
The coseismic vertical deformation of the seafloor as produced by the buried fault plane is computed by using the dislocation model of Mansinha and Smylie, (1971), by prescribing a reverse fault mechanism on each one of the segments. For the tsunami initial condition, the sea-level change was taken to be the same as the sea floor uplift calculated from the dislocation model. The propagation of the tsunami was simulated by the vertically integrated long- wave equations (Pedlosky, 1979):
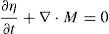
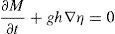
In these equations, t is time, η is the vertical displacement of the water surface above the equipotential level, h is the depth of the water column, g is the gravity acceleration, and M is the vector of the discharge fluxes in longitudinal and latitudinal directions. These equations are solved in a spherical coordinate system by the method of finite differences with Leap-Frog scheme (Goto et al., 1997). In the computation, the time step was set to 1sec, and a grid spacing of 27sec was used for the whole region, whereas a grid spacing of 3sec was used to describe the shallow areas.
For near shore bathymetry, from 1000 m depth to the coast, we used data from local navigational charts, while for depths greater than 1000 m we used data from the ETOPO-2 data set (Smith and Sandwell, 1997).
A digital terrain model (cells of 10 × 10 m2) for mapping the observed tsunami run-up values, as well as the synthetic ones resulting from the tsunami model, was interpolated from the digital topographic data set (GEMA), obtained by photogrammetry in a grid spacing of 3sec in the years 1980-1990 (INEGI, 1994).
ResultsModel results or synthetic tsunamis are heights and times of arrival of wave trains within the first ten hours after the quake at locations defined here as virtual tide gauges (VTG), distributed along the coasts of Jalisco and Colima as illustrated in Figure 4. Synthetic run-up values are defined here as the maximum height (hm) of the synthetic tsunami above the sea level at the tsunami arrival time, at each one of the VTG locations.
Rupture area and dislocationThe initial hypothesis considered the offshore rupture area L = 150km and W = 60km with a maximum coseismic dislocation of 4 m (Pacheco et al., 1997). However, by setting di= 4 m for the ten segments, all of the resulting synthetic run-up values (hm) overestimate the corresponding observed ones (hc). Guided by our prejudice that causal faults slipped with simple geometry, and that seafloor deformation field should be homogeneous and “smooth”we varied di smoothly as to obtain our best fit between hm and hc by setting up to 1 m the dislocation of the fault plane for the first 60km along the fault plane starting from its NW edge (offshore Chalacatepec and Chamela), and to 3 m the dislocation of the next 90km (offshore Tenacatita, Navidad and Manzanillo). For 19 of the 23 surveyed sites, the resulting synthetic run-up values are within 20% of the observed ones. Larger differences (less than 30%) are observed at the Bays of Chamela, Tenacatita, and Melaque, probably by the effects of local bathymetry. Observed and synthetic run-up values are shown in Table 1. The moment magnitude for this heterogeneous fault model is Mw7.93.
.
A series of plots (Figure 5) illustrate the sensitivity of the results (hm) by shifting the location of the fault plane 30km onshore; 30km NW, and 30km SW, respectively from our preferred location illustrated in Figure 4.
 by considering the rupture area proposed in Figure 4; b) by shifting the rupture area 30km onshore; c) by shifting the rupture area 30km NW; d) by shifting the rupture area 30km SE. The origin of the distance axis corresponds to the NW edge of the fault plane illustrated in Figure 4.")
Observed hc versus synthetic hm run-up values obtained for the coast of Jalisco and Colima: a) by considering the rupture area proposed in Figure 4; b) by shifting the rupture area 30km onshore; c) by shifting the rupture area 30km NW; d) by shifting the rupture area 30km SE. The origin of the distance axis corresponds to the NW edge of the fault plane illustrated in Figure 4.
As expected, by shifting the fault plane 30km onshore, most of the synthetic run- up values are 40% smaller that the observed ones; by shifting the fault 30km NW, some of the synthetics are 50% larger than the ones observed in Chamela, and 40% smaller in Manzanillo; while by shifting the fault 30 SE, most of the synthetics underestimate the observed ones, with exception of the ones in Manzanillo.
Arrival timesSynthetic tsunami waveforms at VTG's are shown in Figure 6; the synthetic tsunami arrival time in Jalisco is 9 ≤ t ≤ 12minutes after the quake, while the time of the maximum wave height is 39 ≤ t ≤ 46minutes, with exception at El Tecuán where the maximum occurs at t = 72minutes.

Synthetic tsunami waveforms at ob tained the V TG locations illustrated in Figure 4.
By mapping observed run-up values as well as synthetic ones along the coast, we delineated the extent of flooding by the tsunami (Figure 7). In general, the flooding is extending in a strip of 50 m wide from the shoreline. Larger flooding areas are observed in Chalacatepec, the northern part of Chamela Bay, and in the Bays of Tenacatita and Navidad along rivers beds and wetland areas, where eyewitnesses reported that the tsunami penetrated up to400 m inland. These maps can be used for urban planning and preparedness for large local tsunamis as the one occurred in 1995.
 synthetic run-up values (hm) along the coast of Jalisco and Colima; b, c, and d) enlarged view of the extent of flooding in Chalacatepec, Chamela, and Tena- catita, respectively.")
Extent of flooding by the October 9, 1995 Jalisco-Colima tsunami by mapping observed run-up values as well as synthetic ones along the coast of Jalisco and Colima: a) synthetic run-up values (hm) along the coast of Jalisco and Colima; b, c, and d) enlarged view of the extent of flooding in Chalacatepec, Chamela, and Tena- catita, respectively.
We model the source mechanism of the October 9, 1995 Jalisco-Colima earthquake as constrained by field survey reports of tsunami run-up and extent of flooding, and on the numerical simulation of the tsunami by considering an earthquake (Mw∼8.0) with rupture area A = 9000 km2, L = 150km, W = 60km, with two different coseismic dislocation patches: 1 m the dislocation of the first 60km along the fault plane starting from its NW edge (offshore Chalacatepec and Chamela), and 3 m the dislocation of the next 90km (offshore Tenacatita, Navidad and Manzanillo).
As expected, the source mechanism of the earthquake obtained in this study is a simplified model in comparison of the seismic source obtained by inverting seismic and GPS data. However, the fact that this simplified model reproduces adequately the location of the rupture area and its coseismic dislocation, is still important in order to provide some degree of certainty for the tsunami source of those historical tsunamis for which no seismic nor tide records are available, and only testimonies and vague relates of its effects are documented.
We thank CONACYT for the scholarship to support the PhD student Elizabeth Trejo in the graduate program BEMARENA at the University of Guadalajara. To anonymous reviewers for their helpful review. We also acknowledge CONACYT-FOMIXJAL support for the Project M2012-08-189963 “Caracterización del Peligro Sísmico y Tsunamigénico asociado a la estructura cortical del contacto Placa de Rivera-Bloque Jalisco (TSUJAL)”. TSUJAL Project CGL2011-29474-C02-01, Ministerio de Ciencia e Innovación, Dirección General de Investigación y Gestión del Plan Nacional de I+D+i, España.