


With people’s increasing concern about food safety, cold-chain logistics distribution centre is playing an important role in preventing food from going bad. Now cold-chain logistics distribution centres have the problems of too much transportation, low degree of automation, unreasonable layout planning, complex distribution process etc. It is important to solve these problems in order to achieve efficient distribution. Firstly the modeling and simulation for the operation process of a fruits and vegetables cold-chain logistics distribution centre by using Flexsim software is realized. Then the paper analyses the preliminary output data and finds out the bottleneck and idle resources. Finally this paper makes adjustments for the system to get a better result which hopes to give a reference for the modeling and simulation for the operation process of other cold-chain logistics distribution centres.
Cold-chain logistics is a complicated system engineering which keeps refrigerated and frozen goods in specified low temperature environment during production, storage, transportation, process and sale in order to guarantee the quality and performance of goods [1][2]. In this supply chain system, cold-chain logistics products have features of freshness, perishability [3], timeliness, large costs [4], logistics performance [5] etc. It is very important for cold-chain logistics distribution centre to reduce processing time in lowering the risk of food spoilage.
At present, the research about cold-chain logistics distribution centre is still in early stages. Domestic and foreign experts mainly focus on distribution mode selection [6] [7], routing selection based on VRP method [8], storage and picking methods [9] etc., which basically involves the subsystems of cold-chain logistics distribution centre. However, few studies on the overall process of cold-chain distribution centre have been discussed. Meanwhile, domestic cold-chain logistics distribution centres have the problems of too much transportation, low degree of automation, unreasonable layout planning, complex distribution processes etc. [10]. It is important to solve these problems in order to achieve efficient distribution. The analysis for cold-chain logistics distribution centre is one kind of typical random discrete event system. Analytical method can’t analyse and optimize such system completely.
However, simulation technique can show specific status and find out the bottleneck and idle resource of the system which gives a detail description about actual process and information of this logistics system. Now experts mainly focus on the inventory layout of distribution centre [11], picking strategy on simulation of logistics system. For example, Hassini [12] confirms an optimization algorithms for storage and distribution of the goods, and the algorithms are successfully applied to a large supermarket distribution centre; Chiun [13] simulates inventory layout and sorting system of a distribution centre by using WITNESS software; Zhao [14] builds a simulation model of picking process and then optimizes this model by using Arena software. Fathollah.M [15] provides a simulation framework of a certain supply network in automotive industry in order to study the impacts of commonality.
By using modeling and simulation theory and Flexsim software, this paper firstly analyses the process of a fruits and vegetables cold-chain logistics distribution centre and then builds a simulation model for this distribution centre; Secondly the paper gets the efficiency of key equipment and workers by using Flexsim so that the preliminary output is analysed; Finally the paper finds out the bottleneck and idle resource and makes several adjustments to improve the operation efficiency for this fruits and vegetables cold-chain logistics distribution centre.
2Modeling and simulation steps by using Flexsim softwareFlexsim software is a set of computer 3-D image processing technology, simulation techniques, artificial intelligence technology, and data handling techniques. Flexsim is suited to production-manufacturing, storage and delivery, transport system and other fields [16] [17]. Flexsim provides original data, entering modeling, operation model to realize simulation experiment and optimizes the system. Modeling simulation usually follows the basic steps below:
- a)
Survey the system, and then determine simulated targets.
- b)
Collect basic data of the system. The collection of simulation data involves two aspects. One is that the data is collected according to the established simulation goals to keep the system running normally. The other is that the data involves starting conditions and internal variable of the system.
- c)
Build the system model. Discrete events should define the entities of the system accurately by using flow chart or network diagram. Flow chart includes three parts: arriving model of temporary entities, queuing discipline, model of service.
- d)
Build the simulation model. The process includes confirming the storage form of model and data, choosing software development platform and program design language according to mathematical model and features of the system.
- e)
Model validation. Determine whether simulation model and computer language can show every part of the system precisely (composition of system, system organization, suppose of parameters).
- f)
Simulation and running. In order to forecast actual moving principle of the system, it is important to understand the output response with different inputs and different simulation mechanism.
- g)
Outputs and analysis of the simulation results.
Specific steps are shown in figure 1.
3Modeling for the operation process of a cold-chain distribution centre3.1The operation process of a cold-chain distribution centre
Cold-chain logistics distribution centre usually has the functions of gathering and distributing, linking, low-temperature transport, refrigeration storage, sorting, loading and unloading, low temperature processing and logistics information handing etc. The internal operation process of cold-chain logistics distribution centre has six basic steps, including ordering, receiving goods, processing, storage, sorting and distribution etc. [18] [19]. Various problems may occur during these processes. The problems which involve the relevant context of working environments are complex [20].
Based on the above analysis and considering the reality, a fruits and vegetables cold-chain distribution centre has resources including technical cold storeroom, sorting and packaging equipment, workers, information service etc.
This distribution centre is divided into five areas: receiving area, circulating and processing area, tallying and sorting area, storage area, distribution and delivery area. The cold-chain distribution centre includes specific areas below:
- a)
Receiving area includes unloading, checking and storing goods. Fruits and vegetables remain a short time in consideration of shelf life in this area. This area involves the elements including checking equipment, conveyor and workers.
- b)
Circulating and processing area mainly deals with fruits and vegetables from receiving area (washing, partition, packaging etc.). In this area the resources contain processing equipment, workers etc.
- c)
Tallying and sorting area mainly sorts and packs the fruits and vegetables. This area involves the elements including sorting area, conveying equipment, automatic sorting machine, workers etc.
- d)
Storage area contains refrigerated storage and freezing storage. The resources that this area needed are goods shelf, forklifts, workers, freezing equipment etc.
- e)
Distribution and delivery area: workers should send fruits and vegetables according to customers’ demand, reasonable route, and time restriction. The resources of this area involve vehicles, workers, conveying, equipment etc. As figure 2 shows, the specific operation procedures are as follows

As cold-chain goods have features of perishability, short refrigeration cycle etc. This paper sets two simulation targets. One is transport turnover volumes of fruits and vegetables. The other is operation capability indicator of the distribution centre (efficiency of workers, machines) in order to find out the bottleneck of this operation system and improve operation process balance of the fruits and vegetables cold-chain distribution centre.
3.3Data collectionBy collecting data, the paper uses variable t (day) (t≥0) representing the refreshing time of the fruits and vegetables. The paper classifies the fruits and vegetables into three types according to variable t. The kinds of fruits and vegetables for simulation include short refreshing time of the goods (refreshing time t<3), refrigerated goods (3≤t≤7) and frozen goods (3≤t≤7). The arrival interval of the fruits and vegetables follows Poisson distribution (10,1) (min). The goods arrive 4000 per batch and the average weight is 1000 kg per batch. The distribution centre arranges the machine, equipment and staff according to different process. Receiving area is equipped with conveyors, workers, checking equipment and the time dealing with the fruits and vegetables per kg follows Uniform distribution(2,5) (min); The time that circulating and processing area deals with the fruits and vegetables follows Uniform distribution(3,5) (min); Tallying and sorting area is equipped with sorting machine and workers, the time sorting fruits and vegetables per kg follows Uniform distribution (1,3) (min); The working time of Distribution and delivery area follows Uniform distribution(5,10) (min).
3.4Modeling for the operation process of a fruits and vegetables cold-chain logistics distribution centreAccording to the analysis of the operation process for cold-chain distribution centre, this paper uses flow chart to build the system model. The model is also the simulation module for the operation process of this Cold-Chain Logistics Distribution Centre. Compared with actual process of this cold-chain distribution centre, the simulation module is reasonable. Figure 3 shows the simulation model for operation process of the system
4Simulation and results analysis for the operation process of a cold-chain logistics distribution centre based on flexsim4.1Operation Parameter and Elements of Simulation
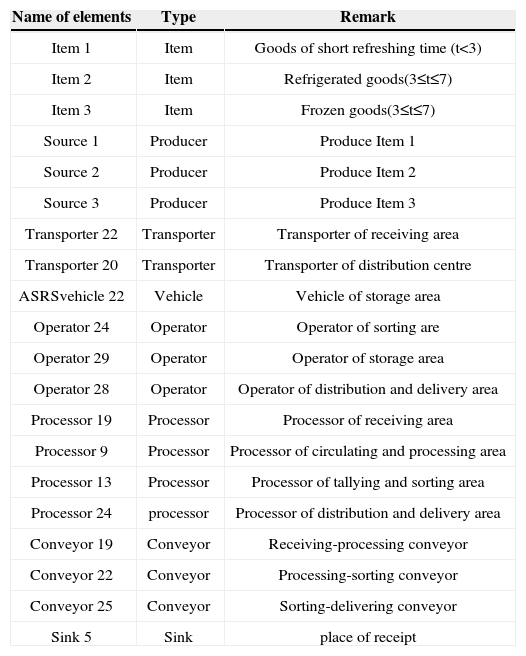
Set simulation time: the unit time of simulation is 1 min. Determine the simulation working hours as 8/day (480 min), and get the results of simulation. Table 1 below shows the entity elements of simulation model.
Entity Elements of Simulation Model.
| Name of elements | Type | Remark |
|---|---|---|
| Item 1 | Item | Goods of short refreshing time (t<3) |
| Item 2 | Item | Refrigerated goods(3≤t≤7) |
| Item 3 | Item | Frozen goods(3≤t≤7) |
| Source 1 | Producer | Produce Item 1 |
| Source 2 | Producer | Produce Item 2 |
| Source 3 | Producer | Produce Item 3 |
| Transporter 22 | Transporter | Transporter of receiving area |
| Transporter 20 | Transporter | Transporter of distribution centre |
| ASRSvehicle 22 | Vehicle | Vehicle of storage area |
| Operator 24 | Operator | Operator of sorting are |
| Operator 29 | Operator | Operator of storage area |
| Operator 28 | Operator | Operator of distribution and delivery area |
| Processor 19 | Processor | Processor of receiving area |
| Processor 9 | Processor | Processor of circulating and processing area |
| Processor 13 | Processor | Processor of tallying and sorting area |
| Processor 24 | processor | Processor of distribution and delivery area |
| Conveyor 19 | Conveyor | Receiving-processing conveyor |
| Conveyor 22 | Conveyor | Processing-sorting conveyor |
| Conveyor 25 | Conveyor | Sorting-delivering conveyor |
| Sink 5 | Sink | place of receipt |
Simulation model is abstraction from real system to mathematical model. So the paper sets several assumptions by surveying this distribution centre.
- 1.
Fruits and vegetables are sent to distribution centre by fixed batch and the arriving time of fruits and vegetables each day follows Poisson distribution.
- 2.
The fruits and vegetables arrive continuously during simulation.
- 3.
The weight of fruits and vegetables is equal without distinction.
- 4.
The refreshing time is not the same for different fruits and vegetables and the maximum refreshing time is 7 days.
- 5.
Simulation module includes receiving area, circulating and processing area, tallying and sorting area, storage area, distribution and delivery area. These areas are consists of specific operation process.
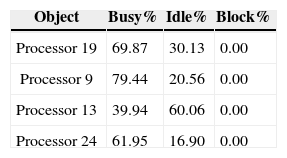
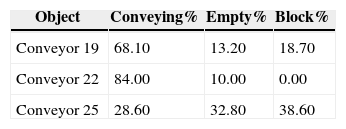
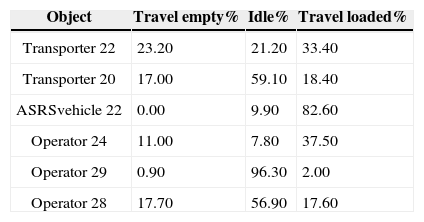
By using the Flexsim software and running the simulation model, the paper get the results of working state statistics of machines (Table 2), working state statistics of conveyors (Table 3) and working state statistics of workers (Table 4).
Table 2 shows the busy rate of Processor 13 (Processor of tallying and sorting area) is 39.94%. So the use efficiency of Processor 13 is low.
Table 3 shows the conveying rate of Conveyor 19, Conveyor 22, Conveyor 25 is respectively 68.1%, 84% and 28.6%. However, the conveying rate of conveyor 25 (Sorting-delivering conveyor) is only 28.60%, and the block rate of conveyor 25 is 38.60%. It represents that staff or equipment of conveyor 25 didn’t deal with the goods in time, in other words, staff or equipment of this area is not enough.
Table 4 shows the idle rate of Transporter 20 (Transporter in distribution centre), Operator 29(Operator in storage area), Operator 28 (Operator in distribution and delivery area) is respectively 59.1%, 96.3%, 56.9%. It indicates that the system has bottleneck from tallying and sorting area, storage area to distribution area.
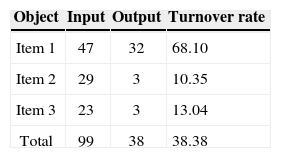
The total quantities of Item 1, Item 2, and Item 3 are absorbed by Sink 5. Table 5 shows the turnover rate of system.
Table 5 shows that the turnover rate of Item 1 is 68.10%; the turnover rate of Item 2 is 10.35%; the turnover rate of Item 3 is 13.04%.
The total turnover rate is 38.38%. It means the turnover rate of goods is extremely low and the operation process of distribution centre has problems of delay and blocking.
From the above analysis of simulation results, it shows that the utilization rate of equipment and workers etc. is low. The paper takes several measures to improve operation efficiency of this cold chain distribution centre.
5Improvement for the operation process of a cold-chain logistics distribution centre5.1Problem analysis- 1.
The backlog of goods from tallying and sorting area to frozen storage area leads to low flow rate of Item 2, Item 3.
The bottleneck is restriction of conveying vehicle which can be solved by increasing the number of vehicles.
- 2.
The work efficiency of equipment in distribution and delivery area is very low. The reason is that the machine is idle for a long time to wait for conveying workers which can be solved by increasing a staging areas.
- 3.
The idle rate of Operator 29 (Operator of storage area) is high, and a forklift can replace operator 29 to solve this problem.
- 1.
Adjust the number of machine and workers. Increase a vehicle ASRSvehicle 29 in storage area and increase. Processor 30 in distribution and delivery area, and then cut Operator 29.
- 2.
Change storage rule of goods shelf in frozen storage area. When storing goods storage area, take the distance into consideration first instead of randomly putting goods.
- 3.
Increase a staging area in front of distribution and delivery area. Optimized simulation modeling graph is shown below (figure 4).

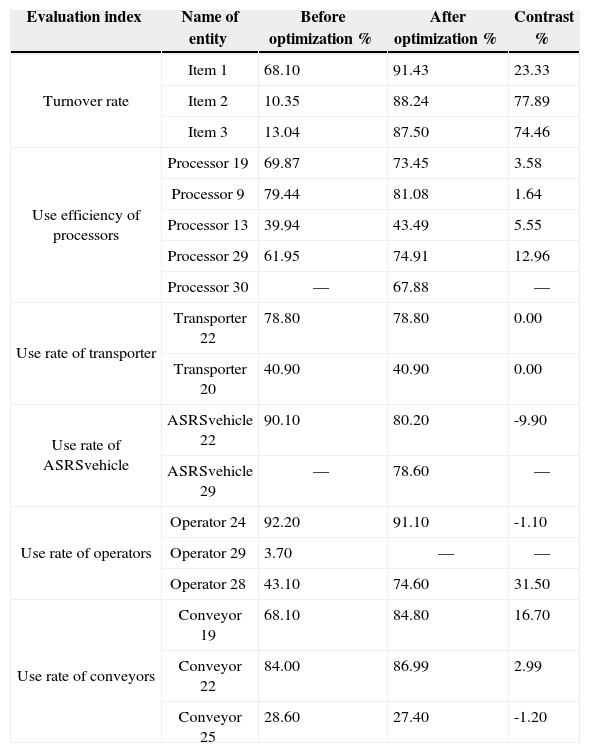
Table 6 below shows the contrast of two simulation results.After the system is optimized, the turnover rate per day of all kinds of fruits and vegetables surpasses 87%. The turnover rate of Item 1 (refreshing time t<3) reaches to 91.43% which is improved by 23.33%; the turnover rate of Item 2 (refrigerated goods 3≤t≤7) reaches to 88.24%; the turnover rate of Item 3 (frozen goods 3≤t≤7) reaches to 87.5%.
Contrast of two Simulation Results.
| Evaluation index | Name of entity | Before optimization % | After optimization % | Contrast % |
|---|---|---|---|---|
| Turnover rate | Item 1 | 68.10 | 91.43 | 23.33 |
| Item 2 | 10.35 | 88.24 | 77.89 | |
| Item 3 | 13.04 | 87.50 | 74.46 | |
| Use efficiency of processors | Processor 19 | 69.87 | 73.45 | 3.58 |
| Processor 9 | 79.44 | 81.08 | 1.64 | |
| Processor 13 | 39.94 | 43.49 | 5.55 | |
| Processor 29 | 61.95 | 74.91 | 12.96 | |
| Processor 30 | — | 67.88 | — | |
| Use rate of transporter | Transporter 22 | 78.80 | 78.80 | 0.00 |
| Transporter 20 | 40.90 | 40.90 | 0.00 | |
| Use rate of ASRSvehicle | ASRSvehicle 22 | 90.10 | 80.20 | -9.90 |
| ASRSvehicle 29 | — | 78.60 | — | |
| Use rate of operators | Operator 24 | 92.20 | 91.10 | -1.10 |
| Operator 29 | 3.70 | — | — | |
| Operator 28 | 43.10 | 74.60 | 31.50 | |
| Use rate of conveyors | Conveyor 19 | 68.10 | 84.80 | 16.70 |
| Conveyor 22 | 84.00 | 86.99 | 2.99 | |
| Conveyor 25 | 28.60 | 27.40 | -1.20 |
At the same time, the utilization rate of equipment in the distribution centre is improved extremely. The using rate of worker 3 (operator 28) is improved by 31.5%; the using rate of conveyor 19 (receiving-processing conveyor) is improved by 16.70%; the using rate of processor 29 in distribution and delivery area is improved by 12.96%.
6ConclusionOn the basis of research status for cold-chain logistics distribution centre, this paper analyzes a fruits and vegetables Cold-Chain Logistics Distribution Centre and collects the fundamental data, then builds the simulation model for the operation process of the Cold-Chain Logistics Distribution Centre. By using Flexsim software, this paper obtains the basic data of equipment and workers and finds out the bottleneck and idle resources. Finally the paper provides specific improved measures to make the turnover rate of cold chain goods and the using rates of equipment and workers increase greatly.