


This article analyzes the food cold chain (FCC) equilibrium based on collaborative replenishment policy. The entirety of collaborative replenishment (ECR) includes one supplier, one retailer and one consumer. The two players join in the non-cooperative game. Both of them pursue their own ideal benefits and achieve the equilibrium in terms of food quantity and price. A new iterative algorithm based on the theory of fixed point is designed to improve the equilibrium model. A numeric example was set to identify the applicability of the model. The parameter sensitivity analysis shows that the overall profit of ECR will increase with consumers’ demand, while the customer satisfaction will decrease to some extent when the food deterioration rate and shortage cost increase, the overall profit of ECR will decrease. We find that the former leads to decreasing of the customer satisfactory and the latter do the opposite. Appropriate strategies should be chosen based on the actual situation for each equilibrium subject.
The food cold chain (FCC) is a specific supply chain, and it keeps the products in stable temperature to maintain its quality (Lan, 2009) [1]. In order to improve the customer satisfaction and reduce the cost, the cooperative relationship between the companies in FCC must be built, which can also prevent the occurrence of the bullwhip effect. The purpose of collaborative replenishment between the supplier and retailer in FCC is to get more benefits through the collaboration and integrate the plans together. Supply chain equilibrium is a branch of the Equilibrium Theory. Consumers will have their own demands on quality, quantity and price in the FCC, which will feed back to affect the collaborative replenishment between supplier and retailer. It will further affect the overall benefits of ECR.
We propose a FCC equilibrium model based on the collaborative replenishment policy. In the dynamic supply chain system, a supplier and a retailer get the maximum benefits through the collaborative replenishment. Then they reach the equilibrium condition by coordinating its relationship with consumers and making the consumers achieve their best satisfaction. After that, an iterative algorithm was designed based on the theory of fixed point to solve the analytical model. The method can avoid the previous difficulties of function derivation when applying the variational inequality to solving the supply chain equilibrium model.
The organization of the paper is as follows. First, we review literature in FCC, equilibrium theory and collaborative replenishment policy in Section 2. Then we make the analysis of FCC equilibrium based on collaborative replenishment in Section 3. Future more, we describe the establishment and analysis of the proposed model and its iterative algorithm in Section 4. Section 5 illustrates a numerical example to demonstrate the applicability of the proposed model. Finally, concluding remarks are then summarized in Section 6.
2Literature review2.1Food cold chain (FCC)The early research is based on the conditions to discuss the character of the FCC. Jean-Pierre Hugot et al. (2003) [2] believe that the Cold chain can combine with the food in order to keep its quality. K. Likar et al. (2006) [3] studied present situation, problems and countermeasures about the FCC. With respect to the FCC management, Liu (2007) [4] researched the issues about the FCC under circumstance of supply chain and pointed out that the FCC was a special supply chain which could be improved and perfected by supply chain theory. Panda et al. (2008) [5] analyzed the inventory model on perishable seasonal products. Kanchana and Anulark (2006) [6] established a cyclical model to solve the twostage perishable product inventory--distribution system problems. We can find that most researches built their models based on the special conditions, such as the temperature system. Few of them pay attention to the relationship between food quality and the price.
2.2Supply chain equilibriumNagurney (2002) [7] developed a supply chain network equilibrium model with the competitive factors. Nagurney (2003) [8] proposed a dynamic global supply chain super network model, which considered the exchange rate effect on the benefits got by manufactures and sellers. On the basis above, Dong (2004) [9] and Jose M. Cruz (2011) [10] established a random demand equilibrium model. Anna Nagurney et al. (2012) [11] summarized the multi-period effects of social relationship in the supply chain networks and made the model. Other related studies from different perspective were as follows: Wua and Mallik (2010) [12] considered a supply chain system with two manufacturers producing a single substitutable product from an equilibrium aspect. Morales and Vermeulen (2009) [13] researched the existence of equilibrium in a decentralized two-level supply chain. Leng and Parlar (2010) [14] analyzed both simultaneous-move and leader-follower games to determine the Nash and Stackelberg equilibrium respectively. Wenlong Chai and Hujun Sun (2013) [15] studied the price competition of a supply chain with demand disruption, which optimized the profits of chain partners. Ian Liu and Haiyan (2013) [16] analyzed different cases of the optimal pricing and ordering strategy in Bertrand-Nash game and Stackleberg game. M. Cedillo-Campos and C. Sanchez-Ramirez(2013) [17] proposed a dynamic self-assessment of performance on supply chains operating, which come to the conclusion that it is necessary to integrate the local actors of differentiated advantages which include suppliers, manufacturers, logistics providers, etc.We can find that few people make research in the supply chain equilibrium of FCC, so we expand the using branch of the equilibrium theory.
2.2Collaborative replenishment policyEffective collaborative replenishment policy should balance the benefits of single point in the supply chain and the whole benefits of supply chain.
Ju-Chia Kuo et al. (2009) [18] combined the temperature control with the replenishment policy and made the advanced Multi-Temperature Joint Distribution System for the FCC. Zhang et al. (2006) [19] studied the time-based VMI collaborative replenishment pattern. Zhao and Wang (2008) [20] constructed a collaborative replenishment policy model which better reflect the modern market competition under random demand by introducing the CPFR operational mechanisms. Chu and Leon (2008) [21] considered the collaborative replenishment between a single-retailer and multi-buyer. Lyu et al. (2010) [22] proposed three collaborative replenishment mechanism models in the collaborative supplier and store-level retailer environment.
Since the 60s of last century, replenishment problems for deteriorating items had been paid much attention by scholars. Ghare and Schrade (1963) [23] first study the optimal replenishment policy for deteriorating items. Assuming that the deterioration was carried out by exponential distribution and the demand was a fixed constant, they finally got an EOQ formula. Lin (2007) [24] considered the collaboration between a supplier and a buyer and took the deterioration property into consideration. Du et al. (2007) [25] studied the problem of VMI inventory replenishment and shipment scheduling for deteriorating items, and developed a mixed replenishment ship model based on VMI under Poisson demand process. Hernandez, S et al. (2012) [26] proposed a new method,Golden-section Algorithm, for the multi-item replenishment problem to solve inventory management problems, which can be more effective than traditional method.
Despite remarkable advances in FCC, supply chain equilibrium and collaborative replenishment was discussed the issue of the FCC supply chain equilibrium based on collaborative replenishment. Based on the papers, we establish an equilibrium model of the FCC supply chain in which a supplier and a retailer form an entirety based on collaborative replenishment, and act as a whole to game with the consumers.
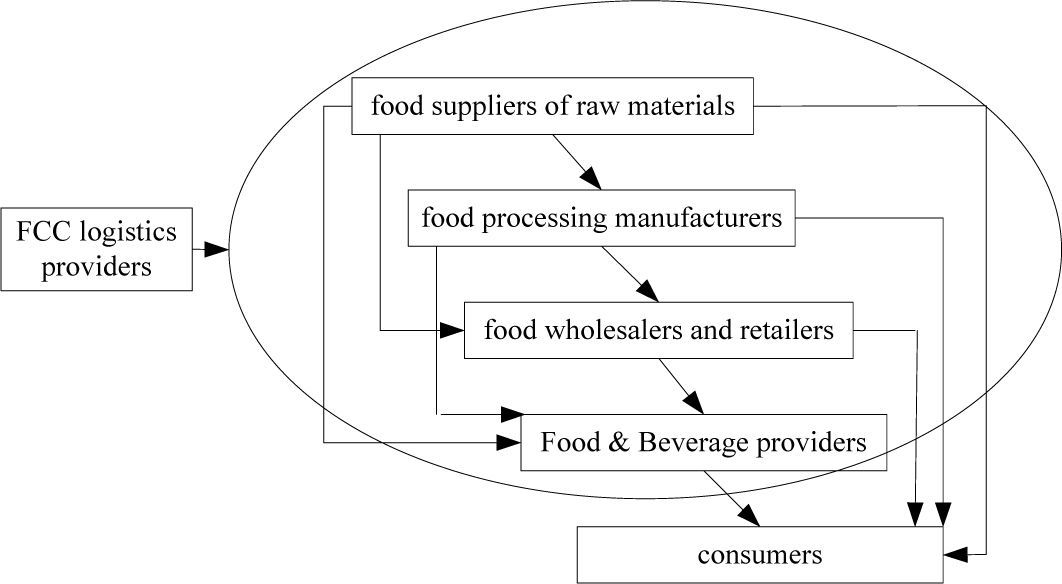
3AnalysisThe FCC system consists of different subjects, which can be seen from Figure 1 that the different subjects of the FCC system are closely associated with each other which compose different structures. In order to illustrate the model more clearly, we divided the subjects into two parts: suppliers and retailers. Suppliers contain food raw material suppliers, food processing manufacturers etc; retailers who provide food to consumers but not product food directly contain food wholesalers and retailers, food & beverage providers etc.

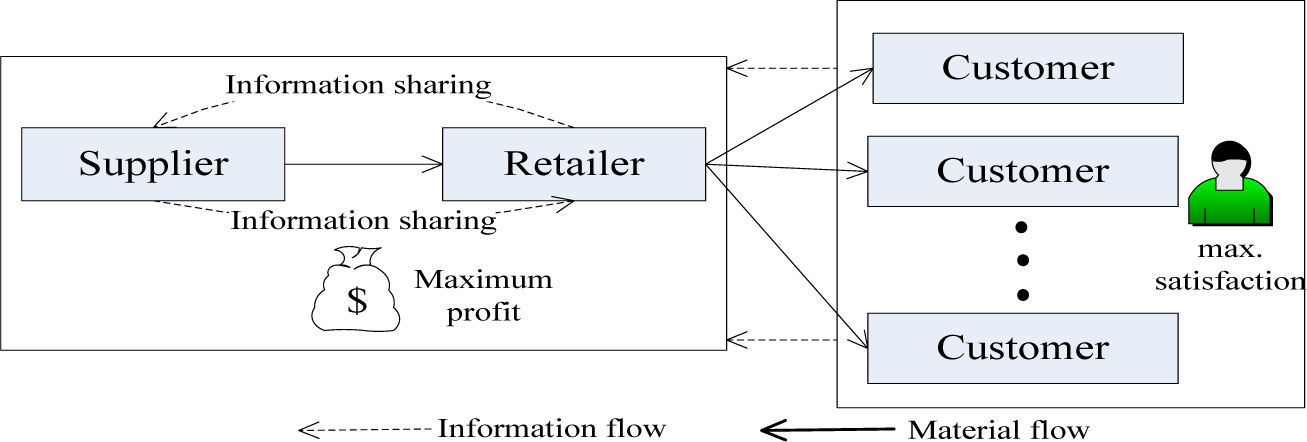
The FCC equilibrium model based on collaborative replenishment has absorbed the idea of CPFR and takes a supplier and a retailer as a whole, which act as a subject to takes a game with consumers, and finally achieve the FCC equilibrium condition. As shown in Figure 2.
3.1ECR’s benefits
By taking the collaborative replenishment, the supplier and retailer establish a stable replenishment through information sharing. It will reduce the dealer’s inventory level or food shortage situation and make the maximum benefits. Here, we consider that supplier can control the food quality perfectly so that the deterioration won’t occur in the storage of supplier.
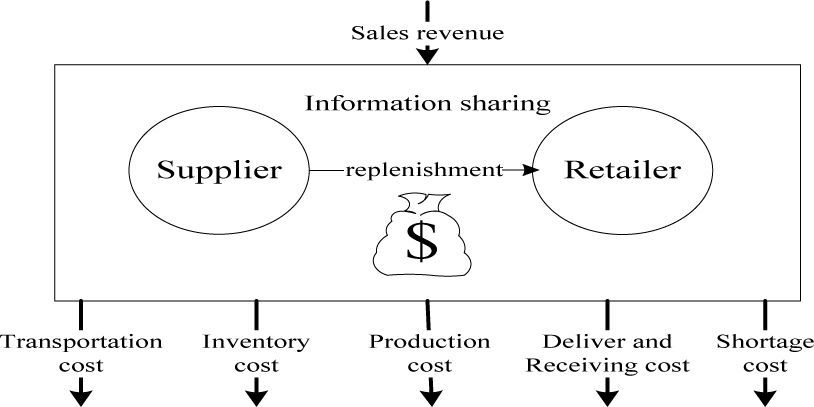
The collaborative replenishment policy considers the whole profits and costs instead of each account. Therefore, the income of ECR is the sales revenue from the retailer, but the costs of ECR includes production cost, fixed delivery cost and inventory cost from the supplier; the fixed receiving cost, inventory cost and shortage cost from retailer and transportation cost shown in Figure 3.
3.2Consumers’ benefits
Consumers have demand for food in price, quantity and quality. We define consumers’ maximum satisfaction as the maximum benefit, which reflects their mental states. “Satisfaction” is a relative concept but not an absolute one. The market observation and research made by Spremann show that the consumers’ satisfaction for a product mainly relies on the ratio between the quality and price (Lu and Xi, 1996) [27]. Therefore, we define the ratio between the actual food purchases and the theory demand as customers’ satisfaction.
4Sourcing modelThe proposed model is based on the following assumptions:
- (a)
The food deterioration rate in stock is a constant θ and the food has no value after metamorphism.
- (b)
Divide the quality guarantee period of food into m stages.
- (c)
Rational demand of consumers is real need without considering the impact of food price and quality.
- (d)
Actual demand of consumers refers to the final actual purchases, which is positively correlated with food quality and inversely correlated with food price.
- (e)
As different replenishment leads to different sales cycle, the maximum benefits of ECR and consumers per unit time (instead of a sales cycle) are_considered.
- (f)
The supplier and retailer share information through collaborative replenishment and the supplier can complete replenishment instantaneously.
The decision variables are Q Order quantity from the retailer in each sale cycle Pi Sale price of food at sale stage i
The related parameters are as follows: T The time span of each sale stage m The maximum value of sale stage, mT is the quality guarantee period n The actual value of the sale stage contained in a sales cycle (n≤m), so nT is the time span of sales cycle. For the further research, we give the available value by constraints. Qi The inventory of retailer at the beginning of sale stage i qi The quality of food at sale stage i Di Actual demand at sale stage i Si Actual sale volume at sale stage i Oi Out of stock at sale stage i h1 Inventory keeping cost for the supplier per unit time and volume h2 Inventory keeping cost for the retailer per unit time and t volume Cp Shortage penalty cost Cd Fixed cost of production for the supplier Cm Cost of production per unit food for supplier Cf1 Fixed delivery cost for the supplier Cf2 Fixed receiving cost for the retailer
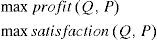
The units of measure of profit and satisfaction are different. Therefore, we proposed a multi-objective nonlinear programming model with two objectives. The first objective is maxim profit, the second is maxim satisfaction.
The optimal policy of the FCC equilibrium model is a simpler formal set (Q, P), where Q is from the retailer. The order quantity in each sale cycle and p=(p1,p2… pn) is a vector. It represents selling prices of on-sale food at each stage. The typical process under this policy is described as follows: the supplier provides volume of Q to the retailer in every sales cycle, and the retailer sets appropriate sale price according to actual conditions at the same time.
(a) Computational formula of the ECR’s maximum benefitsAs described in section 3, the income of ECR is only the sales revenue from the retailer and can be estimated by:

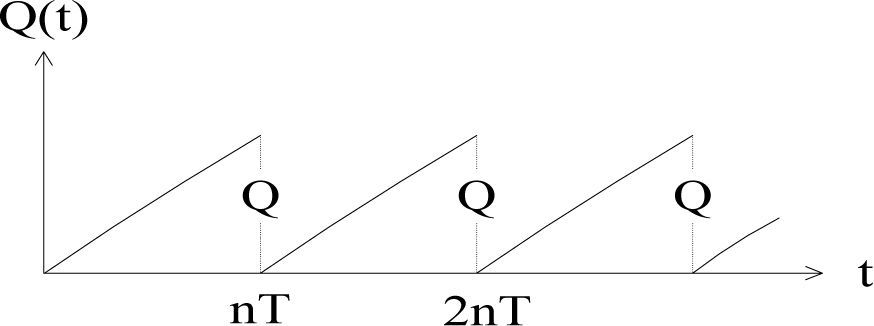
We choose the food manufacturer as the supplier in the FCC equilibrium model. The supplier will produce Qin a sales cycle nT. The inventory change of the supplier is described in Figure 4:

The supplier’s average production ability is

So the supplier’s inventory in any time t of a cycle is

Here t0 is the beginning of the corresponding sale cycle. The inventory cost for the supplier in a cycle would be

Supplier’s production cost is the sum of fixed production cost and production cost of food:

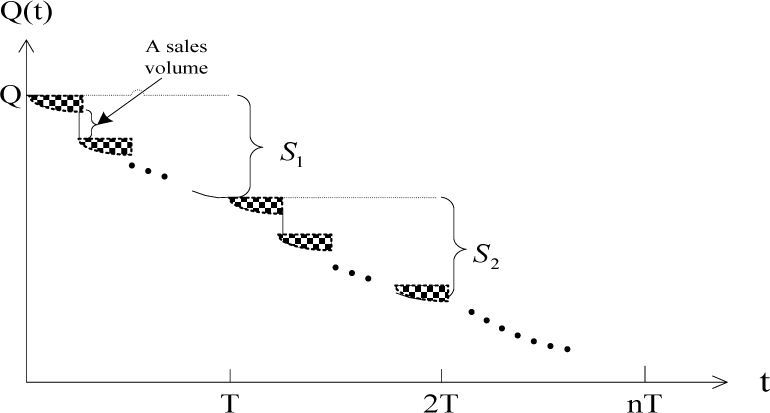
In each sale stage of a sale cycle, the retailer set an appropriate sale price pi according to the quality qi and inventory Qi of food to meet the consumer demand as well as maximize the sales profit. The inventory change of the retailer is described in Figure 5:

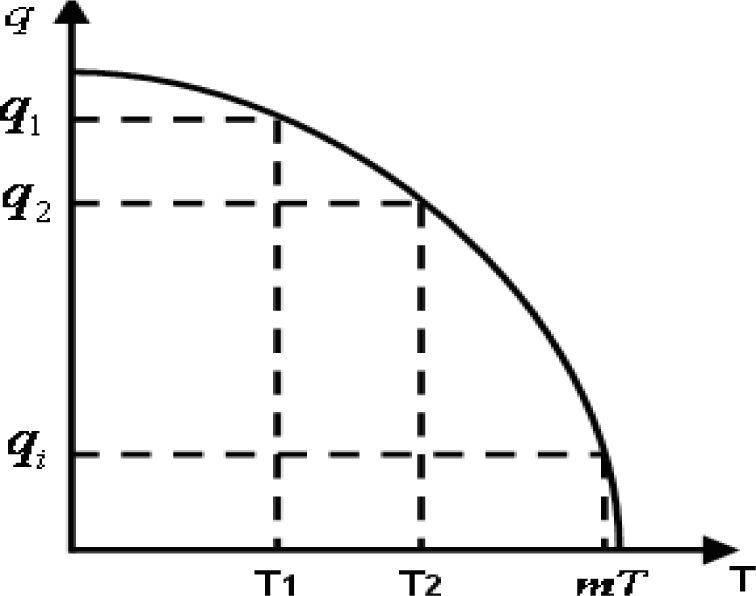
The quality of food will decrease as the guarantee period reaches even though the food is under right temperature and humidity. It can be represented by the dash area in Figure 5. With the elapse of time, the quality of food will decrease will rapidly drop to 0 once exceeds guarantee period of food, as shown in Figure 6.

For the convenience of modeling, we assume that the qualities of food is constant in a certain sale stage, and the quality is 1 in the first sale stage and 0 when exceeds guarantee period. Suppose that the food quality in each sale stage is approximated linear changes and the quality of food in the sale stage i is

As mentioned in section 3, the actual demand of consumers can be got by the following formula,

Here, the letter k is the plastic factor directed by large amounts of statistics data, which is about the food selling in real life. The actual sale volume or purchase volume at sale stage i can be expressed as

The expression of the retailer’s inventory (Ghare and Schrader, 1963) at the beginning of sale stage i is presented as follows

We define the inventory of retailer in t as I (t) and use the inventory at the beginning of sale stage Qi to approximately replace the corresponding I(t). Then the inventory cost could be expressed as:

In every stage, the shortage will take place when the inventory of the retailer fails to meet the demand of consumers. The shortage can be expressed as

Then the shortage cost is

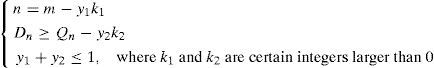
For a certain replenishment quantity, n should meet one of the following two conditions at least:
- (1)
n equals to the maximum value of sale stage m, and the quality of food drops to 0 and the sale cycle comes to the end;
- (2)
The shortage takes place at the n - th sale stage. n should meet the constraint conditions in order to sum up as follow:
In conclusion, the ECR’s maximum benefits can be described by
(b) Computational formula of consumers’ maximum benefits
We employ customer satisfaction to present the consumers’ benefits in section 3. Customer satisfaction can be estimated by the ratio between the actual food purchases and the theory demand, so the consumers’ maximum benefits per unit time should be
(c) The FCC equilibrium model
The game theory can be divided into cooperative game and non-cooperative game according to the different hypothesis [28]. Non-cooperative game is the strategy selection problem [29] which researches on how to choose the maximum benefits decisions in the interactive situation. The ECR and consumers form a non-cooperative game, and both of them make effort to get the maximum benefits. But the equilibrium condition is the best choice for all the parties (Huang, 2008) [30], so all participants will try to reach the equilibrium state. And the FCC will reach the equilibrium condition after collaborative replenishment, so formula (14) and (15) are met
max satisfaction=∑i=1nSi/λT/n4.2The iteration algorithm based on the theory of fixed point
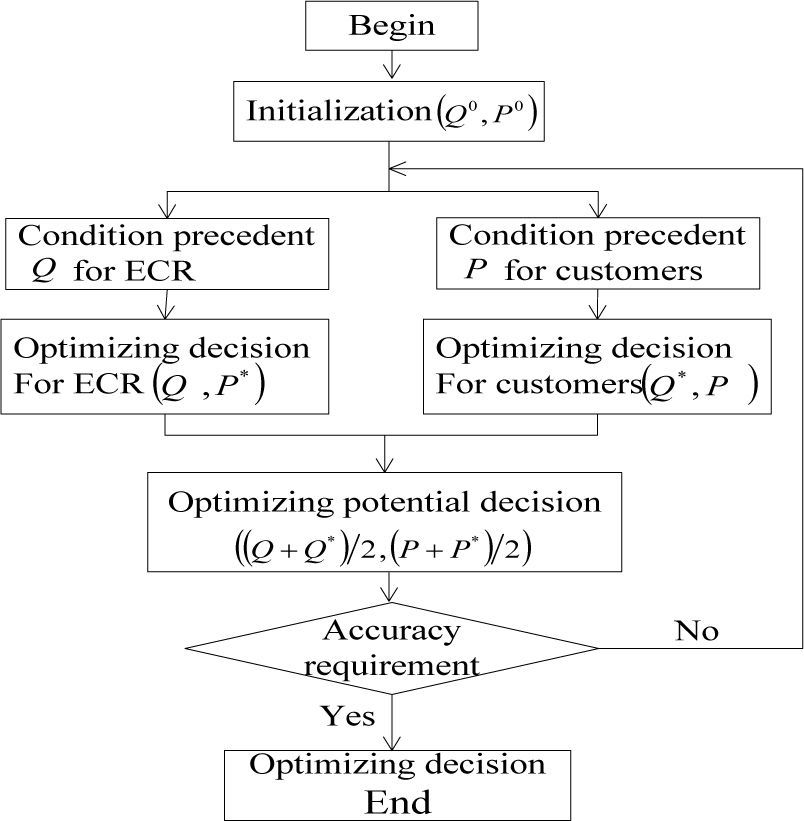
The usual methods to solve the multi-objective programming are the primary-object method, Lexicographic method, evaluation function methods, robustness estimate and so on. They all require to derivative the equation. To simplify the solving process, we design an iteration algorithm based on the theory of fixed point for the first time.
First we express the formula (14) and formula (15)
with the simpler formal set (Q, P)
We suppose that (Q*, P*) is the optimal solution of the above extreme-value problem and construct the function below:
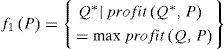

We can get the following function according to f1(P) and f2(Q)

Then we can see (Q*, P*) ∈ f(Q, P)
Theorem 1 (Brouwer Fixed Point Theorem (Alpern and Katrantzi, 2009) [31]): Set D as a bounded closed convex set in Rn, mapping T : D → D is continuous, and then the fixed point must exist in D, which are εx0, ∈D, Tx0=x0.
It is easy to know that f(Q, P) is a continuous function defined on the set of real number and satisfy f(Q, p) : R → R, so we know from Brouwer Fixed Point Theorem that there exists (Q, P) ∈ R, meeting the equationf(Q, P)=(Q, P), that is to say there is a fixed point solution in f(Q, P).

The iterative algorithm is based on the fixed point theory. The main making (Q, P) calculates the optimal p’ for ECR with the condition of Q and the optimal Q’ stands for the consumers at the condition of P respectively. Then we contrast the difference of the maximum benefits of ECR and the consumers between the successive two iterative. It will end the algorithm until the difference reaches an allowed scope. The following summarizes the primary computational steps executed in the iterative algorithm.
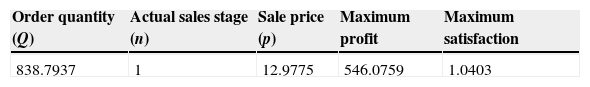
5Results5.1Computational resultsThe preceding theory can be illustrated by the following numerical example under different parameters: θ=0.04, m =3, T =4, h1 =0.02, h2 =0.03, Cp =4, Cd =20, λ =200, Cf1 =20, Cf2 =20, cm =10, Ct =0.04
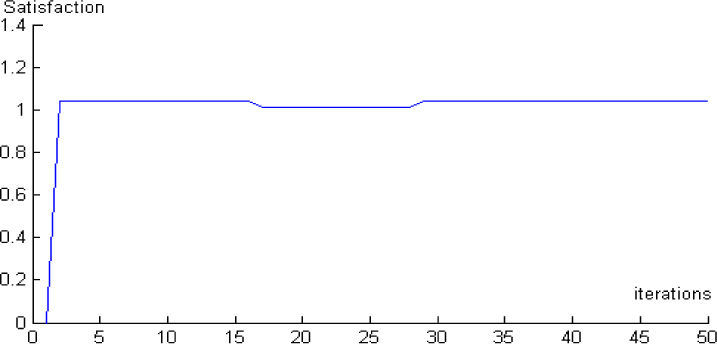
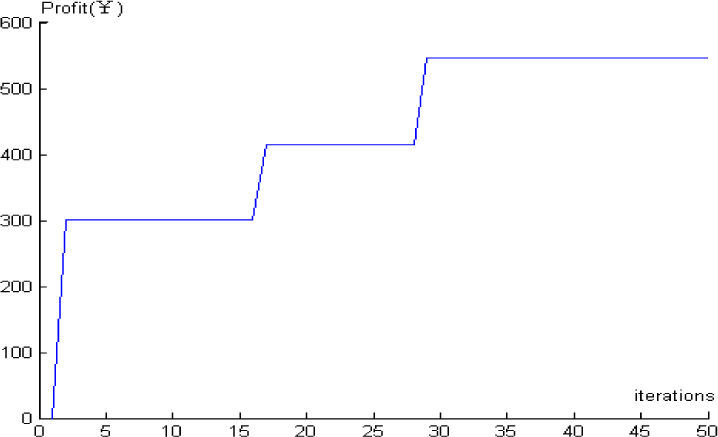
The results obtained upon the above solution procedure to this numerical example problem with MATLAB program are given in Figure 8-9 and Table 1.


As shown in Figure 8-9, when the iterative number increasing, the ECR’s maximum benefits will grow bigger until reaching a stable state. The consumers’ satisfaction reduces a little in the medium-term of the iterative process, so its value is greater than 1.
5.2Parameter sensitivity analysisSensitivity analysis is used to check the validity and sensitivity of the model when one parameter value changes. The results are shown in Table 2-4. The main conclusions drawn from the sensitivity analysis are as follows:
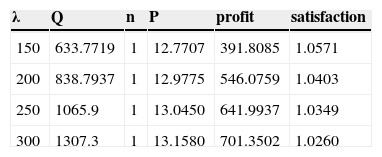
(1) Sensitivity analysis of the parameter λ impact on optimal solution is shown in table 2.
The results show that the ECR’s order quantity will increase to meet consumers’ demand. The high demand and sale price will in turn increase the ECR’s benefits, but the consumers’ satisfaction will reduce due to the high price although demands are satisfied.
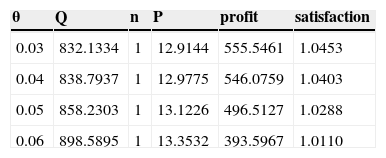
(2) Sensitivity analysis of the parameter θ Change the value of deterioration rate to 0.03, 0.04, 0.05, 0.06 and its impact on the optimal solution are shown in Table 3.
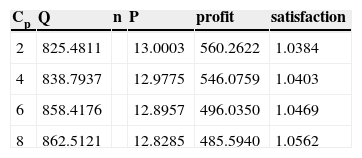
(3) Sensitivity analysis of the Cp
The values of parameter Cp are recorded as 2, 4, 6, 8 and its impact on the optimal solution are shown in Table 4.
When the shortage penalty cost becomes larger, the ECR will increase the order quantity to avoid out of stock. Although the high order quantity can meet the consumers’ demand, it increases the over storage risk which can lead to metamorphism.
On the other hand, if a great quantity of food can’t be sold out, the ECR’s benefits will be lower when they exceeded the shelf life. For the case, high order quantity will satisfy consumers’ need completely, what’s more the consumers’ satisfaction will become larger.
According to the result, when given a fixed shortage penalty cost, the ECR should set an appropriate price to balance both the consumers’ satisfaction and the profit, which based on the sales.
5.3SummaryThe preceding numerical example contains one sale stage. Based on its sensitivity analysis, we think it is caused by the metamorphic processes of food. The food quality at the 2-th (or longer) stage has dropped to a lower level which the consumer can hardly accept, so the food can be sold by ECR only at the first sale stage. In different types of problems, the sale stage may have different value to meet the satisfaction of both sides. The MATLAB program can be used in different sale cycles.
6ConclusionsIn this paper, we make the FCC equilibrium model with the consideration of food loss. Compared with previous literature, the FCC equilibrium method has two distinctive features. First, the entirety of the collaborative replenishment and the consumers are the main subjects in the non-cooperative game and both of them achieve equilibrium in the end. Second, the algorithm based on the fixed point theory is designed to solve the equilibrium model. In this case, the numerical example has shown its availability and flexibility. We can provide a basic foundation for the further study in the FCC equilibrium models.
The proposed model can be extended in several ways as follows: includes more suppliers, retailers and consumers; distribute the benefits between the supplier and retailer after reaching the equilibrium condition which plays an important part in the FCC; work out a reasonable mathematical expression of plastic factor k or the appropriate expression evolution of food quality.