


Modeling of microbial growth and ammonia consumption at different temperatures was developed in the production of a polyhydroxyalkanoate (PHA) biopolymer in Pseudomona fluorescens in the range of 25–35°C. A logistic model was employed to predict accurately the microbial growth limiting conditions of nitrogen. A new model based in a mixed mathematical equation comprising a logistic model, and a magnetic saturation model resulted appropriate to estimate the ammonia consumption under limiting conditions. Favorable conditions for PHA production in P. fluorescens were found at temperature of 30°C, reaching the maximum biomass concentration of 2.83gL−1, and consuming 99.9% of the initial ammonia, to produce 2.13gL−1 of PHA. The proposed models could be useful to predict the behavior of a fermentation process to produce PHA in real time.
This paper develops a mathematical model to describe the behavior of a bioprocess. Specifically it focuses on studying the growth kinetics bacteria in the production of PHA biopolymers, which are considered an interesting family of biodegradable polymers with applications in sectors such as textiles, biomedicine and packaging. The development of this model could open the opportunity to propose models of automated bioprocess control and optimize productivity at large scale of these biomaterials, due to limited information about kinetic models at different conditions of temperature and nitrogen concentration
1.1PHA biopolymerPolyhydroxyalkanoates (PHAs) are thermoplastic polyester synthesized by bacteria as a form of intracellular carbon and energy storage and capsulated as inclusions in the cytoplasm. The most employed bacteria in the PHA production is Ralstonia eutropha, other producer microorganisms includes Pseudomona fluorescens, P. putida, Bacillus megaterium and Escherichia Coli (Braunegg, Lefebvre, & Genser, 1998; Jiang et al., 2008; Lee & Gilmore, 2005).
The most important members of the PHAs family are poly-3-hydroxybutyrate (PHB) and poly-3-hydroxyvalerate (PHV). PHB is similar in mechanical properties to polypropylene, while PHV is more flexible and used in P(3HB-co-3HV) co-polymers in order to improve softness (Albuquerque, Eiroa, Torres, Nunes, & Reis, 2007; Martelli et al., 2012). PHAs are completely biodegradable by bacteria and fungi under proper conditions (Laycock, Halley, Pratt, Werker, & Lant, 2013).
PHAs can be produced under controlled conditions by biotechnological processes. A multiplicity of polyesters can be synthesized by varying the producing strain, the source and composition of substrates and the operational conditions, such as temperature, during the growth and polymer accumulation processes of bacteria (Braunegg et al., 1998). According to the metabolic pathway used by bacteria to transform a carbon source into PHA, limiting conditions of nitrogen during the cell growth trigger the production of PHA, due to a physiological induced stress in the bacterial metabolism (Chen et al., 2012; Rehm & Steinbüchel, 1999).
PHA polyesters are ten times more expensive to produce than polyethylene (Wen, Chen, Tian, & Chen, 2010) due to the high production cost, which is made up of operating expenses and improper control of the bioprocess. Many studies showed that the optimal temperature maximizes the bacterial growth rate during the growth phase and limiting nitrogen concentration conditions during the accumulation phase assure high intracellular PHA content (Fernández et al., 2005). For that reason it is necessary to control the nitrogen levels and understand the mathematical behavior of fermentation in order to formulate a control loop for the bioprocess.
1.2Mathematical modelingThe automation of the PHA production process by using nitrogen limiting conditions at specific temperatures would allow the operation in a batch reactor to be more reliable and optimal. Therefore, a model representing the influence of temperature on cell growth and nitrogen consumption during the PHA production is necessary Divyashree, Rastogi, and Shamala (2009) proposed a kinetic model for PHA biosynthesis in B. flexus by using a modified logistic equation to model the cell growth at a constant temperature of 30°C, supposing a constant relationship between the cell growth and the PHA production. However authors do not relate the behavior of the nitrogen consumption in the PHA production at different temperatures.
In contrast, the effect of temperature on the maximal specific growth rate of B. cereus was studied between 5°C and 40°C by Choma et al. (2000). Arrhenius plot fitting from experimental data has been used to establish the variation of the temperature characteristic, which is analogous to activation energy in kinetic studies. Arrhenius equation could be used to predict the effect of temperature on microbial growth rate and substrate consumption.
Recently, some generalized logistic models have been used to study biomass growth when either substrate inhibition or limiting conditions occurs in bacterial culture at constant temperature (Chowdhury, Chakraborty, & Chaudhuri, 2007; Fujikawa, Kai, & Morozumi, 2004; Salih, Mytilinaios, Schofield, & Lambert, 2012). Bacterial growth and substrate consumption curves are generally sigmoid, however when cellular lysis occurs, for example during PHA accumulation in the cytoplasm under nitrogen conditions, or by changing the culture temperature, the substrate consumption curve change its behavior, decreasing during the exponential growth phase, and increasing slightly during the stationary phase. In consequence a mixed mathematical model to predict accurately the substrate and biomass concentration changes along fermentation is required.
This study aimed at modeling the effect of temperature and ammonia consumption on the microbial growth of bacteria P. fluorescens to produce PHAs. A new sigmoid and magnetic saturation models were proposed to predict the evolution of both variables. The investigation also aimed to evaluate the mathematical behavior of the model parameters as a function of temperature, in order to formulate a bioprocess control in the large scale production of PHAs.
2Materials and methods2.1MicroorganismPHA-accumulating strain P. fluorescens was used in this study, it was provided by the Microbiology Laboratory at the Universidad Pontificia Bolivariana in Medellin.
2.2Culture mediumThe strain was cultured aerobically in a liquid medium containing: 10gL−1 sugarcane molasses (sucrose 60% p/p, H2O 16% p/p, glucose 5% p/p, fructose 5% p/p, ash 9% p/p, proteins 5% p/p), 8g L−1 KH2PO4, 8.3gL−1 K2HPO4·3H2O, 4.2gL−1 Na2HPO4·12H2O, 0.8gL−1 (NH4)2SO4, 0.1 NH4Cl, 0.02gL−1 MgSO4·7H2O, 0.02gL−1 CaCl2·2H2O. Medium was supplemented with 1.5mLL−1 of trace elements solution containing: 40gL−1 FeSO4·7H2O, 10gL−1 MnSO4·H2O, 4gL−1 CoCl2, 2gL−1 ZnSO4·7H2O, 2gL−1 MoO4Na2·2H2O, 1gL−1 CuCl2·2H2O. Sugarcane molasses were used as a primary carbon source while ammonia compounds as limiting nitrogen source. The pH of the medium was adjusted to 7.0 with 1M NaOH.
2.3FermentationA 3L Applikon bioreactor (Applikon, ADI 1030) was used for batch cultivation of P. fluorescens, containing 2.4L of medium, air flow rate was 1.5Lmin−1 and stirrer speed was 500rpm. Experiments were carried out at temperatures of 25°C, 30°C and 35°C in order to evaluate its effect on microbial growth and ammonia consumption. Pre-culture was prepared in 500mL erlenmeyer flask containing 250mL of medium. The bioreactor was sterilized at 121°C for 20min, cooled and then inoculated with 10% inoculum (v/v).
2.4Analytical methodsMicrobial growth was monitored by measuring the cell density of the culture at 640nm in a UV/vis spectrophotometer (Shimadzu, UV 1606 PC) after suitable dilution with distilled water.
Cell dry weight standard curve was obtained by collecting and washing the cells after bacterial culture by filtration (Millipore filters of 25mm diameter and 0.45μm) and the dry weight was measured. Six levels of dilution of cell suspensions, based on the dry weight were prepared and corresponding absorbance was measured at 640nm in a UV/vis spectrophotometer (Shimadzu, UV 1606 PC). Furthermore data of absorbance versus cell concentration were correlated linearly.
Ammonium concentration was determined by UV/vis spectroscopy at 628.5nm (Shimadzu UV-1606 PC) through the formation of colored complexes with indophenol. Supernatant samples from broth culture were first diluted by 1/5 factor, each of the diluted samples was added to 1mL of phenol 1% (w/v) and 0.4mL of sodium hypochlorite 12% (w/v) solutions. After a reaction time of 30min a blue-green colored complex is formed and absorbance was measured.
The cells were harvested and treated with 10% NaClO at 80°C for 15min. After centrifugation, the pellets were washed, dried, and extracted with chloroform at 60°C for 1h. The non-PHA cell matter was removed by filtration, and the dissolved PHA was separated from chloroform by evaporation, washed twice with methanol, filtered out and dried at 60–70°C.
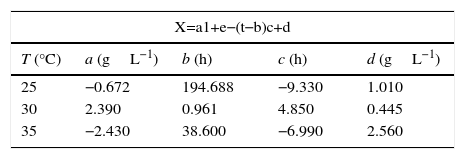
2.5Mathematical modelingThe microbial growth model was based in a logistic model for total biomass concentration as a function of time parameterized as shown in Eq. (1),
where X refers to total biomass concentration in the culture, cell+PHA (units gL−1).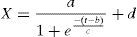
Parameter d refers to the maximum biomass concentration in the culture, cell+PHA (units gL−1). In contrast, a refers the difference between initial and final biomass concentration (units gL−1).
Parameter b refers to the lag phase time during growth kinetics in hours, and c is a shape factor related with the exponential growth phase time, in hours.
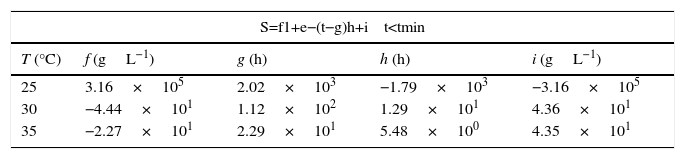
Similarly, ammonia consumption model was based in a mixed mathematical equation comprising a logistic model, before reaching the minimum substrate time, tmin, and a magnetic saturation model after that minimum time, parameterized as shown in Eq. (2),
where variable tmin is defined as the time in which substrate reaches its minimal concentration during fermentation process.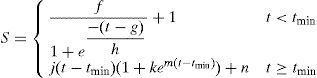
Parameter i refers to the maximum substrate concentration in the culture, cell+PHA (units gL−1). Parameter g refers the time in which nitrogen source reaches its minimal concentration in hours, n refers the concentration of substrate at tmin. Parameters j refers the rate of ammonia concentration increasing in the culture due to protein release of bacteria after tmin (units gL−1h−1), k and m are shape factors for logistic model.
The specific growth rate for microorganisms, named commonly μ, was calculated as a function of time according to Eq. (3).

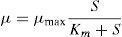
In order to establish the relationship between the specific growth rate for microorganisms and the ammonia consumption, to predict the kinetic parameter μmax, it was used the Monod model, as shown in Eq. (4).
The relationship between μmax and temperature was established by analogy with Arrhenius expression used in chemical kinetics, as shown in Eq. (5).
2.6Statistical analysis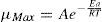
The mean of the squared errors between either the predicted cell concentrations or ammonia consumption and those measured at the observation points was defined to be as a measure of the goodness of fitting experimental data.
3Results and discussionThe culture media employed for PHA-accumulating strain P. fluorescens was formulated to provide limitation of ammonia, which was selected as the main nitrogen source, in the presence of an excess of a sugar molasses as a carbon source. Sugarcane molasses, a secondary raw material in the sugar industry, is an economic raw material to produce biopolymers such as PHAs.
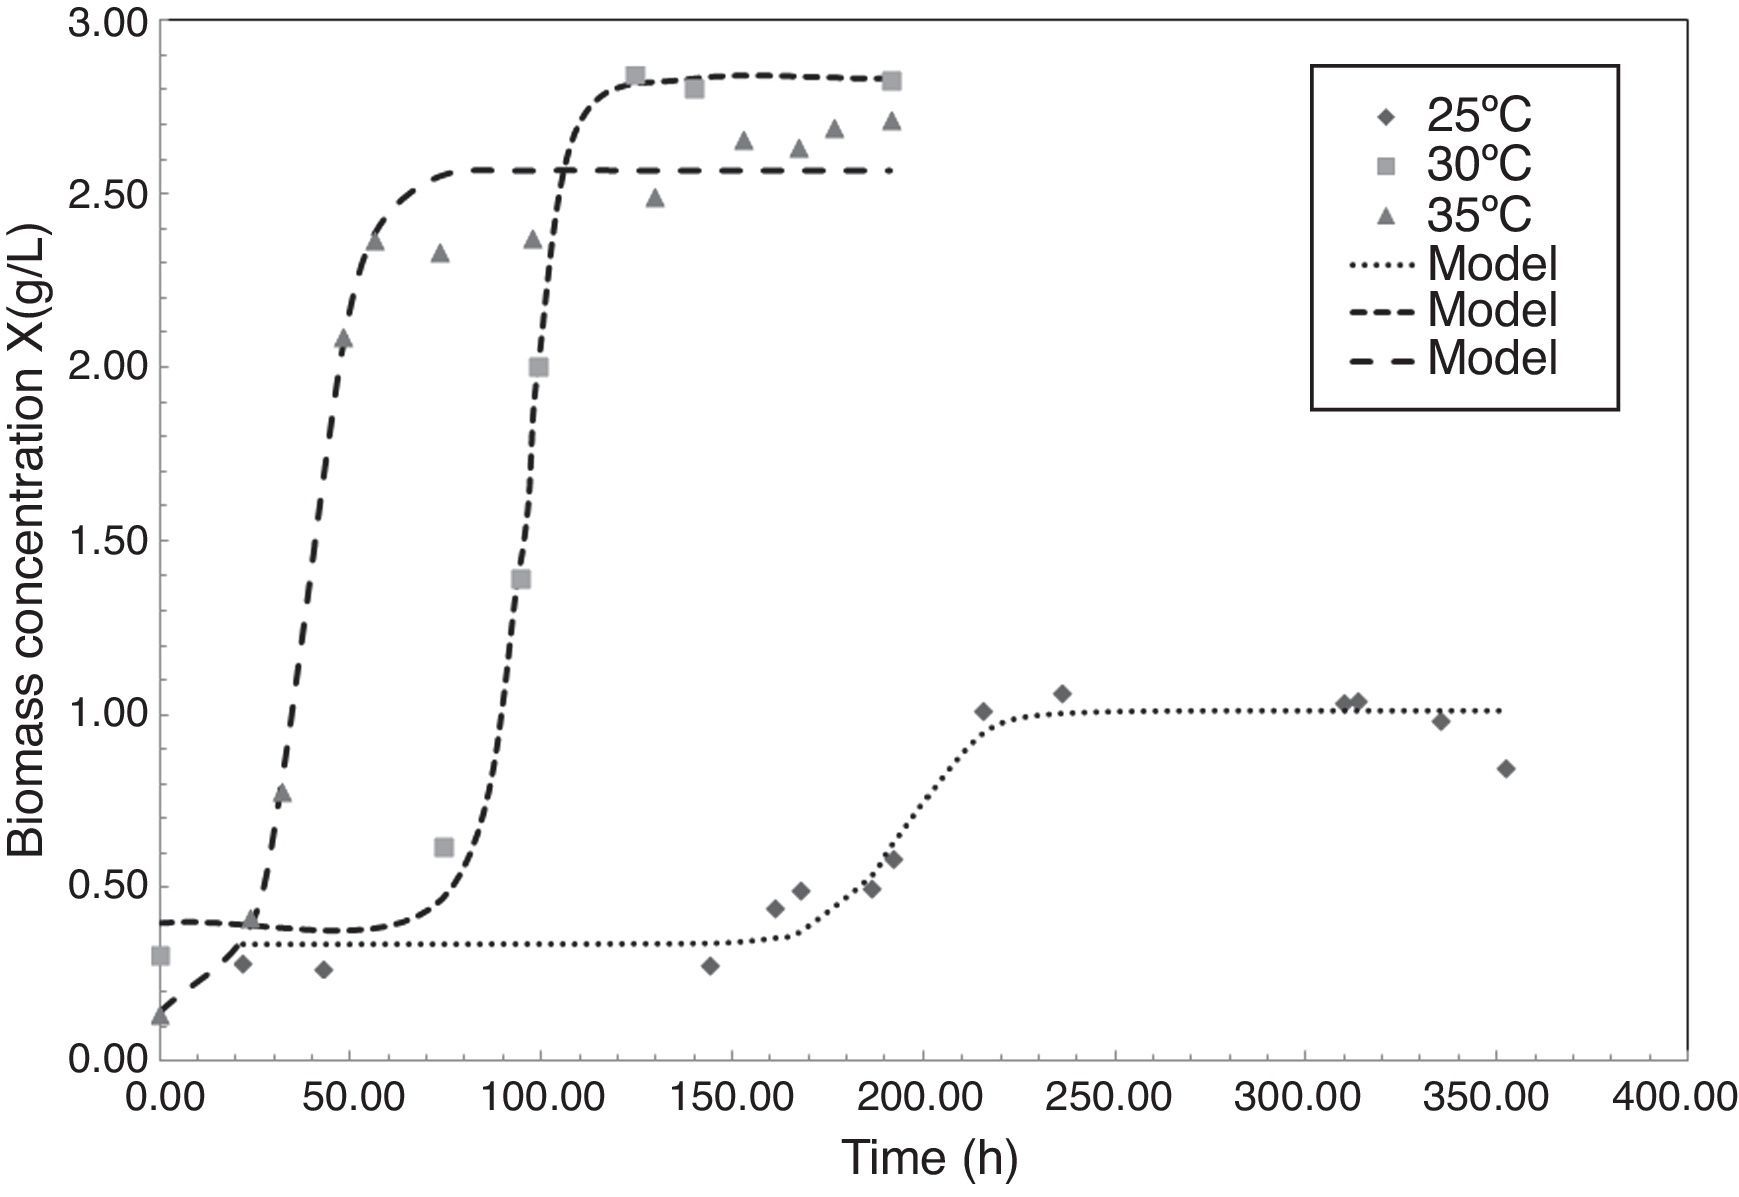
Fig. 1 shows the microbial growth of P. fluorescens, expressed as biomass concentration, at 25°C, 30°C and 35°C during the fermentation process. At 25°C the culture reaches a total biomass concentration of 2.67gL−1 in 152h, a similar result was found by Hsieh et al. (Hsieh, Wada, & Chang, 2009) in cultures of Delftia acidovorans to produce a copolymer of PHB, obtaining a biomass concentration of about 2.5gL−1 at 25°C in 72h. In contrast, when culture temperature reaches 30°C, the lag phase increases 74h, reaching the maximum biomass concentration of 2.83gL−1 in 124h of fermentation. At 35°C the culture showed a low biomass production. In general, conditions of temperature above 30°C results to be unfavorable for microbial growth, lowering dramatically the biomass concentration in the stationary phase to 1.07gL−1.

The proposed logistic model for biomass concentration (X) as a function of time, as shown in Eq. (1), fitted well to all culture conditions, generating a good predictive model for experimental microbial growth obtained. Average regression coefficient (r2) for growth at 25°C was estimated as 0.9520 due to data dispersion in biomass concentration when reaching the stationary phase. Similar results were obtained by Jiang et al. (2008), when Pseudomonas sp was cultured in sucrose to produce PHB, at temperatures around 25°C the stationary growth phase was reached in 120h, reaching high content of PHA of 22.1gL−1. In contrast, regression coefficients of 0.9799 and 0.9918 were found for growth modeling at 30°C and 35°C, respectively.
The parameters found for the logistic model are shown in Table 1. Results showed how parameters a and c present maximum values at temperatures between 30°C, while b and d are minimal in the range studied. In contrast with Fig. 1, this result was in agreement with finding of Divyashree et al. (2009) who described how temperatures of 30°C results to be optimal for PHB production in cultures of B. flexus.
According to obtained parameters of the logistic model, the asymptote values for the P. fluorescens biomass concentration varied from 2.56 to 2.83gL−1 for 25°C and 30°C, respectively. Asymptote value is important to harvest yield of organism for PHA production, for example, predictions of those parameters in an automatic process control at other temperatures, when biomass is being monitoring by an electronic device, could achieve to predict in real time the expected production of a PHA biopolymer.
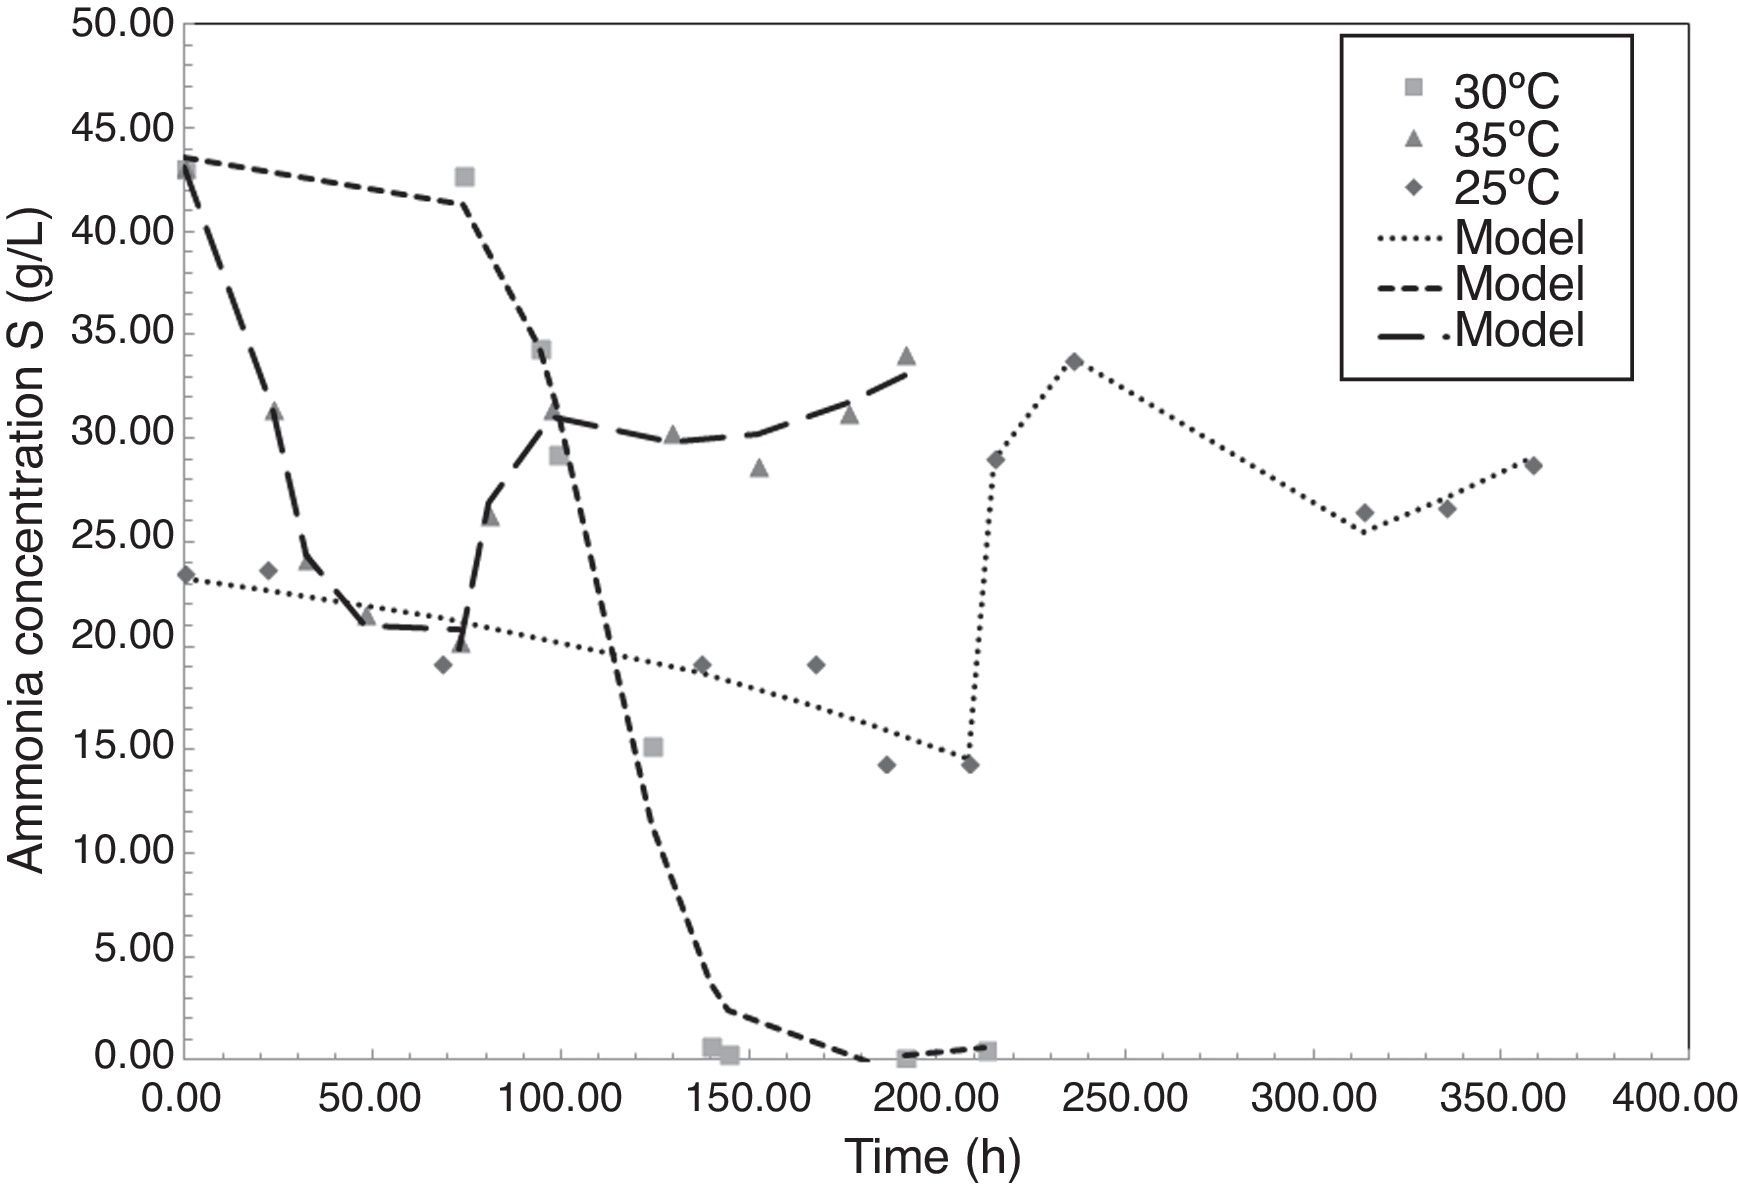
Fig. 2 shows the evolution of ammonia concentration during the fermentation of P. fluorescens at 25°C, 30°C and 35°C. Ammonia is a reduced nitrogen source consumed by bacteria to synthetize enzymes valuables for the metabolic pathway, such as acetyl CoA, and to generate proteins for cellular maintenance. The behavior obtained for the ammonia concentration during the fermentation shows how at any temperature a first step of reduction occurred, followed by an increasing in the concentration. According to various authors, when PHA content in the cytoplasm is high or when operational conditions are unfavorable for the cell growth, i.e. high temperatures, strong shear stress, or competition for space and nutrients, the cell can continuously synthesize and release proteins to the media, increasing the presence of amino groups (NH2) in the fermented broth (Bleves et al., 2010). Pseudomona bacteria have showed that behavior. Amino compounds in proteins form colored complexes with indophenol same as ammonia (NH4+).

According to Fig. 2, at each temperature there is a time when the ammonia content is minimal; in this paper that time is called as tmin. In experiments, tmin was 208.4h, 191.5h, and 73h at 25°C, 30°C and 35°C, respectively. After tmin cells begin to metabolize accumulated carbon sources due to nitrogen limitation, reducing the yield of PHA production. At 30°C the P. fluorescens consumes 99.9% of the initial ammonia, generating more limiting conditions and therefore more PHA accumulation in the cytoplasm. According to studies reported by Rehm and Steinbüchel (1999), when the levels of nitrogen source limited, the bacteria increase the activity of PHA synthase, the enzyme responsible of PHA production.
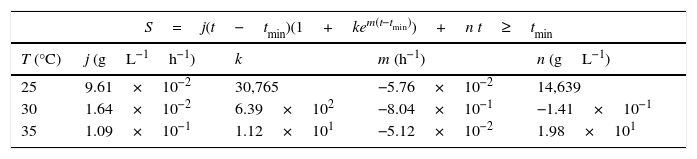
Modeling of ammonia consumption requires a specific model before and after tmin as shown in Eq. (2). The parameters obtained after fitting the experimental data are presented in Tables 2 and 3.
Saturation model parameters for ammonia consumption of P. fluorescens at 25°C, 30°C and 35°C after tmin.
| S=j(t−tmin)(1+kem(t−tmin))+n t≥tmin | ||||
|---|---|---|---|---|
| T (°C) | j (gL−1h−1) | k | m (h−1) | n (gL−1) |
| 25 | 9.61×10⁻² | 30,765 | −5.76×10⁻² | 14,639 |
| 30 | 1.64×10⁻² | 6.39×10² | −8.04×10⁻¹ | −1.41×10⁻¹ |
| 35 | 1.09×10⁻¹ | 1.12×101 | −5.12×10⁻² | 1.98×101 |
Proposed model fitted well with experimental data. Regression coefficient (r2) for ammonia consumption models were 0.9869, 0.9830 and 0.9980 at temperatures of 25°C, 30°C and 35°C, respectively.
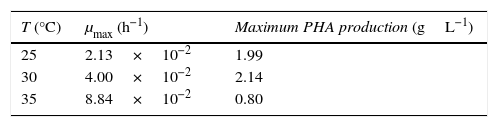
By using Eqs. (1)–(3) to calculate μ and S and fitting Eq. (4), it was possible to calculate the maximum specific growth rate (μmax) for P. fluorescens at 25°C, 30°C and 35°C. Results are showed in Table 4 along with the maximum PHA production in the stationary growth phase. In general the maximum growth rate increases with the increment of temperature, however the PHA production is higher at 30°C, what was expected according to results showed in Figs. 1 and 2, when a maximum biomass production of 2.83gL−1 and the more limiting condition of ammonia were obtained.
In contrast, as shown in Table 4, the maximum growth rate of P. fluorescens increases with temperature as analogy with Arrhenius model employed in kinetic analysis (Choma et al., 2000; Fujikawa et al., 2004). The logarithm of the maximal specific growth rate of P. fluorescens was plotted against the reciprocal of the absolute temperature to obtain its Arrhenius plot over the temperature growth range from 25°C to 35°C. When the Arrhenius law was fitted to experimental data, it was obtained a temperature characteristic (Ea) of 115.64kJmol−1 with a correlation coefficient of 0.997.
Arrhenius pre-exponential factor (A) was estimated in 3.53×10¹⁸. Similar findings were reported by Choma et al. (2000), studying the growth of B. cereus, similar PHA-producing bacteria, at different temperatures. They reported a temperature characteristic of 170.8kJmol−1 in a culture range of 13–38°C; resulting 1.5 times suggesting that B. cereus used more energy to assume its growth at moderated temperature than P. fluorescens.
4ConclusionsA logistic model was employed to predict accurately the microbial growth of P. fluorescens at 25°C, 30°C and 35°C under limiting conditions of nitrogen. Similarly, a new model based in a mixed mathematical equation comprising a logistic model, and a magnetic saturation model resulted appropriate to estimate the ammonia consumption. This model could be coupled to a monitoring device of biomass and ammonia to predict the PHA production between 25°C and 35°C.
Favorable conditions for PHA production in P. fluorescens were found at temperature of 30°C, resulting in a lag phase of 74h, reaching the maximum biomass concentration of 2.83gL−1, and consuming 99.9% of the initial ammonia, to produce 2.14gL−1of PHA.
Arrhenius law was fitted to experimental data, obtaining a temperature characteristic (Ea) of 115.64kJmol−1 and a maximum specific growth rate which increased with temperature from 2.13×10⁻² to 8.84×10⁻² in the range of 25–35°C.
Conflict of interestThe authors have no conflicts of interest to declare.
Peer Review under the responsibility of Universidad Nacional Autónoma de México.