


In this proposed study, a new long term scheduling is proposed for simultaneous placement of Distributed Generation (DG) and Distribution STATic COMpensator (DSTATCOM) in the radial distribution networks. The proposed work has a unique multi-objective function which consists of minimizing power loss, and total voltage deviation (TVD), as well as maximizing the voltage stability index (VSI) subject to equality and inequality system constraints. The multi-objective problem has been solved by a novel metaheuristic optimization algorithm called as lightning search algorithm (LSA). In the proposed approach, the feeder loads are varied linearly from light load (0.5) to peak load (1.6) with a step size of 1%. In each load step, the optimal sizing for DG and DSTATCOM are calculated by LSA. Through curve fitting technique (CFT), the optimal sizing for both DG and DSTATCOM per load level is formulated in the form of generalized equation. The proposed generalized equation will help the distribution network operators (DNOs) to select the DG and DSTATCOM sizes according to the load changes. The proposed method is tested on two test systems of 33-bus and 69-bus in different cases.
In present days, distribution system acquires huge rate of power losses, i.e., 13% in the power system which has been studied in the literature (El-Fergany, 2013). In addition to that voltage stability of radial distribution networks has received much consideration with a need for together study and improvement of the operating conditions (Abul’Wafa, 2014). Hence, various research works have been taken to decrease the power losses and enhance the voltage stability in the distribution network. The optimal allocation of DG and DSTATCOM have valid effect on reducing the distribution system power losses and voltage stability enhancement along with voltage profile improvement. Different benefits of simultaneous allocation of DSTATCOM and DG in the RDS including reducing system power loss, voltage profile enhancement, power factor correction, load balancing, power quality improvement, on-peak operating costs reduction, releasing the overloading of distribution lines, system stability improvement, pollutant emission reduction, and increased overall energy efficiency. The power import from the substation can be reduced by using optimal generation of real and reactive power from DG and DSTATCOM in RDS thus controls feeder power flows. The optimal placement of DG and DSTATCOM regulate the real and reactive power flows respectively in the RDS. So the system total power loss has been decreased with good voltage profile enhancement.
In recent times, the integration of DGs has considerably increased in the RDS. The term “Distributed” or “Dispersed” Generation (DG) is described as small electric power generation that is directly linked to the systems. DG consists of induction generators, micro turbines, synchronous generators, reciprocating engines, fuel cells, combustion gas turbines, solar photovoltaic, wind turbines and other small power generation sources. DGs installation have usually less investment compared with constructing high priced new power plants and distribution and transmission lines. The features of DGs are ecofriendly, power quality improvement and economic. In addition, it gives more reliable energy solutions than traditional generating methods (Ackermann, Andersson, & Söder, 2001; Willis, 2000).
On the other hand, shunt capacitors are major devices which are generally used in distribution systems to compensate the reactive power in the RDS, but these shunt capacitors are not capable to constantly produce variable reactive power. Due to this utility has to bare extra cost of capacitors and for placing of capacitors at right places. In addition to this load balancing cannot be possible within it. Because it has some operational problems like resonance (Hussain & Subbaramiah, 2013). To resolve above-mentioned drawbacks DFACTS are used in distribution systems to compensate the reactive power requirements in the distribution networks (Jazebi, Hosseinian, & Vahidi, 2011; Taher & Afsari, 2014). Distribution STATic COMpensator (DSTATCOM) is a notable DFACTS device which has been used to enhance the distribution system efficiency and reliability by providing reactive power support to reduce the total line losses and to enhance the voltage profile (Ledwich & Ghosh, 2002; Sensarma, Padiyar, & Ramanarayanan, 2001; Wasiak, Mienski, Pawelek, & Gburczyk, 2007).
The problem of optimal allocation of DG and DSTATCOM in the RDS become a big consideration for power system researchers. Here is a literature review of the accomplished power system researches which can be divided into following three categories.
1.1Optimal DG allocation without DSTATCOMsSo many optimization techniques have been used to find the optimal location and sizing of DGs in RDS. Bee Colony Algorithm (Abu-Mouti & El-Hawary, 2011), Particle Swarm Optimization and Monte Carlo simulation (Abdi & Afshar, 2013), Genetic Algorithm (Mardaneh & Gharehpetian, 2004), Honey Bee Mating Optimization Algorithm (Niknam, 2011), Quasi-oppositional teaching learning based optimization (Sultana & Roy, 2014), Backtracking search optimization algorithm (El-Fergany, 2015), Quasi-Oppositional Swine Influenza Model Based Optimization with Quarantine (Sharma, Bhattacharjee, & Bhattacharya, 2016), Imperialistic Competitive Algorithm (Poornazaryan, Karimyan, Gharehpetian, & Abedi, 2016), Grey wolf optimizer (Sultana, Khairuddin, Mokhtar, Zareen, & Sultana, 2016) have been considered for DG allocation in RDS with different objective function.
1.2Optimal DSTATCOM allocation without DGsAnd also, various research works have been carried out on optimal allocation of DSTATCOM in the RDS. The authors (Jazebi et al., 2011) utilized evolution algorithm for combined DSTATCOM and reconfiguration in the RDS for power loss minimization. The authors (Taher & Afsari, 2014), used an immune algorithm for the problem of DSTATCOM allocation to reduce the power and energy losses in the RDS. The authors (Yuvaraj, Ravi, & Devabalaji, 2015) have taken bio inspired bat algorithm for DSTATCOM allocation problem considering load variations to decrease the power loss. Gupta and Kumar (2016) solved optimal DSTATCOM placement problem using sensitivity approaches with considering time variant load models in mesh distribution networks.
1.3Optimal DG and DSTATCOM allocation simultaneouslyIn literature, very few attempts were seen about the simultaneous allocation of DG and DSTATCOM in the RDS. Devi and Geethanjali (2014) used an optimization technique based on a PSO to allocate the DG and DSTATCOM simultaneously in the RDS for power loss reduction. Devabalaji and Ravi (2015) used BFOA to allocate the combined DG and DSTATCOM with a newly framed objective function in the RDS. The Improved Cat Swarm Optimization technique has been used to solve simultaneous allocation of DG and DSTATCOM in the distribution networks (Kanwar, Gupta, Niazi, & Swarnkar, 2015).
From the literature survey, it may be found that most of these optimization techniques have effectively been used to determine size, placement, loss minimization and voltage improvement problem of DG/DSTATCOM in radial distribution network. However, many of them suffer from local optimality and require large computational time for simulation. In addition, all the authors have focused only on three load levels (light, medium and peak) and the load variation has not been considered in radial distribution system. For each and every change in load steps affects variation the optimal size of DG & DSTATCOM, it will cause uncertainty in the distribution system for minimization of objective function (Harrison, Piccolo, Siano, & Wallace, 2008; Soroudi & Amraee, 2013; Soroudi, Ehsan, Caire, & Hadjsaid, 2011a, 2011b).
These inspired the present authors to introduce a new, simple, efficient and fast nature based lightning search algorithm optimization technique to solve simultaneous allocation of DG and DSTATCOM problems in the radial distribution systems. The multi-objective function of the proposed method is power loss minimization, voltage profile enhancement and VSI maximization of the system. The location and sizing of both DG and DSTATCOM have been calculated by using lightning search algorithm. In this paper, the feeder loads are linearly changed from 0.5 (light) to 1.6 (peak) with a step size of 0.01. For each step change in load, the optimal sizing of DG and DSTATCOM are evaluated. Curve fitting technique is used to find the optimal size of DG and DSTATCOM at each load level which is formulated in the form of simple quadrature equation. The proposed work is more helpful for the DNOs to select size of DG and DSTATCOM based on load steps. The feasibility and effectiveness of the proposed method have been tested with two standard IEEE buses such as 33-bus and 69-bus test systems and obtained simulation results are compared with other heuristic based algorithms.
2Problem formulation2.1Load flow analysisGenerally radial distribution systems have high resistance to reactance (R/X) ratio than transmission system. Therefore traditional power flow studies such as Gauss–Seidel, Newton Raphson and Fast decoupled load flow studies are not appropriate for determining the line flows and voltages in RDS. The Backward/Forward Sweep (BFS) algorithm is one of the efficient method for power flow studies of RDS (Khushalani & Schulz, 2006). The main features of this power flow study is simple, fast, required memory for processing is low with efficiencies and solution accuracies computational and robust convergence in the solution of RDS.
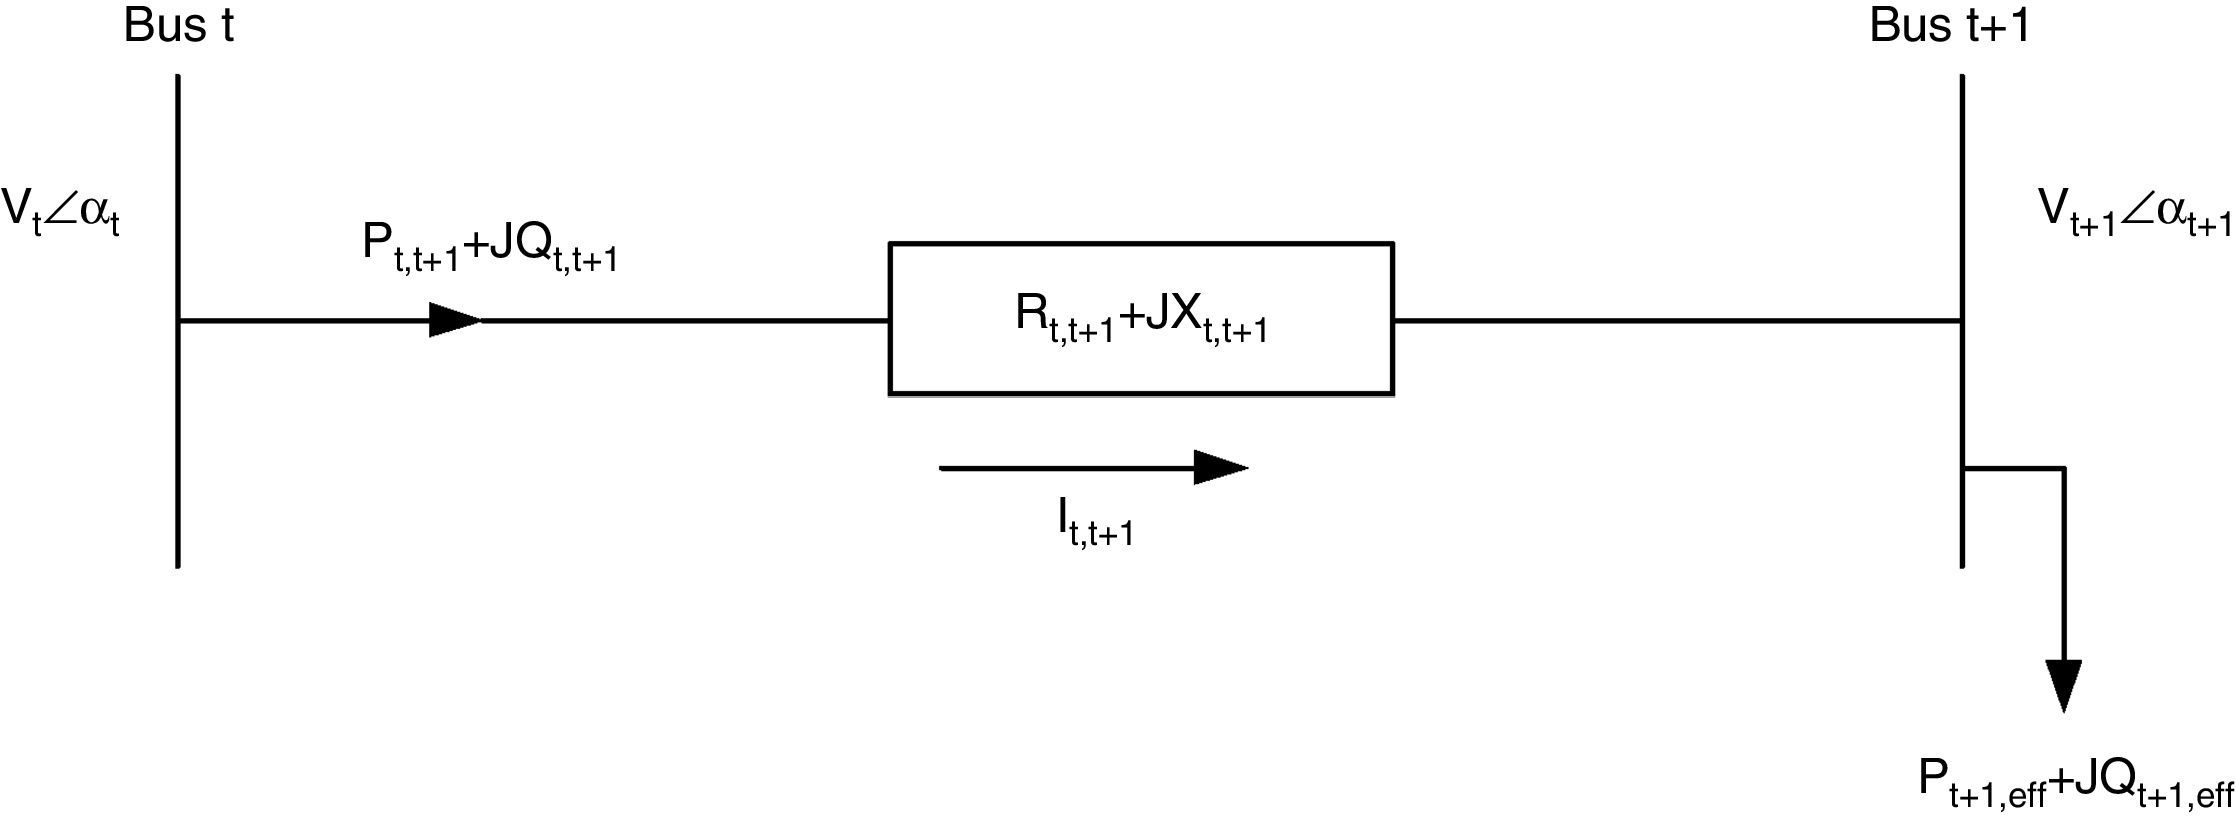
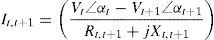
Consider two buses connected by a branch as apart in a RDS depicted in Fig. 1, where the buses t and t+1 are the sending and receiving end buses, respectively. The real power Pt,t+1 and reactive power Qt,t+1 flowing between buses t and t+1 can be calculated as:
where Pt,t+1 and Qt,t+1 are the active and reactive power flowing through in line between buses t and t+1, Pt+1,eff and Qt+1,eff are the total effective real and reactive power supplied beyond the bus t+1, respectively, and PLoss(t,t+1) and QLoss(t,t+1) are the active and reactive power losses between buses t and t+1, respectively.


The current flow between buses t and t+1 can be calculated as
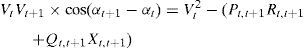
Also,where Vt and Vt+1 are the voltage magnitudes at nodes t and t+1 respectively. αt and αt+1 are the voltage angles at nodes t and t+1 respectively. Rt,t+1 and Xt,t+1 are the resistance and reactance of the line section between buses t and t+1 respectively.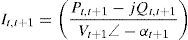
From Eqs. (3) and (4), it can be found that
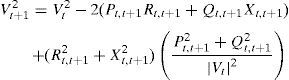
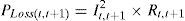
By equating the real and imaginary parts on both sides in (5), it can be obtained as follows:After squaring and adding (6) and (7), (8) is obtained as:The active and reactive power loss in the line section between buses t and t+1 are calculated asThe total active and reactive power losses of the distribution systems can be calculated by the addition of losses in all line sections, which is given bywhere Nb is total number of branches.2.2Power loss reduction using DG/DSTATCOM placement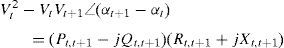

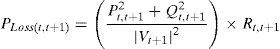

The active power loss plays a vital role in the radial distribution networks. So the optimal DG and DSTATCOM placement problem is mainly concerned with the minimization of active power loss of the networks. The total losses reduced by DG/DSTATCOM allocation in the RDS is taken as the ratio of total power loss with and without DG/DSTATCOM placement in the RDS, and is given by
The total power loss reduced by DG/DSTATCOM allocation in the RDS can be maximized by minimizing ΔPTLDG/DST.2.3Total voltage deviation (TVD)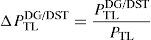
Another reason of allocating DG and DSTATCOM in the distribution system is keeping the bus voltage at the load terminals within an acceptable range and enhancing the voltage profile of the system. Optimal placement of DG and DSTATCOM into un-compensating system enhances the voltage profile, since DG and DSTATCOM can deliver required amount of real and reactive into the system and reduce the power losses; therefore the variation in voltage is enhanced. The Total Voltage Variation (TVD) of the network can be given as
2.3.1Voltage profile enhancement using TVD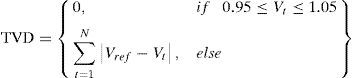
To verify the superiority in voltage profile improvement of the system, the TVD at each bus has been considered, and it made as minimum in value as much as possible (El-Fergany, 2013). From the computations, it can be observed that the minimum value of TVD indicates good improvement in voltage profile of the RDS. The voltage profile of the system with DG/DSTATCOM allocation can be maximized by minimizing ΔTVDDG/DST. It is taken as the ratio of TVD before and after DG/DSTATCOM placement of the system, and is given by
where TVDbefore is the total voltage deviation before DG/DSTATCOM placement and TVDafterDG/DST is the total voltage deviation after DG/DSTATCOM placement in the RDS.2.4Voltage stability index (VSI)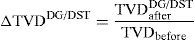
Without considering voltage stability in objective function, the radial distribution networks may be susceptible against voltage associated problems, which occur often in the RDS. Therefore, we should optimize voltage stability of the networks during the allocation of DG and DSTATCOM. Voltage stability can be defined as the ability of a system to maintain voltages in acceptable range so that when system nominal load is improved, the real power delivered to the load by the system will rise and both voltage and power are controllable (Parizad, Khazali, & Kalantar, 2010). The stability of the system can be improved when DG and DSTATCOM are placed simultaneously in the distribution networks. The VSI at each node has been calculated using Eq. (18). The low value of voltage stability index buses have more chance to voltage collapse.
Voltage stability index is used to calculate the stability level of the radial distribution networks and also used to take appropriate action to be taken if the index shows a poor level of stability.2.4.1Voltage stability index maximization using DG/DSTATCOM placement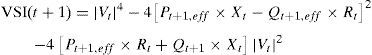
To prevent the voltage collapse in the RDS the VSI value should be maximized as much as possible. The voltage stability index is maximized by DG/DSTATCOM allocation in the RDS. It is taken as the ratio of voltage stability index with and without DG/DSTATCOM placement in the RDS, and is given by
The voltage stability index can be maximized by maximizing ΔVSIDG/DST.2.5Multi-objective function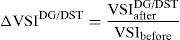
In the previous works, it is observed that most of the researchers used various single objective functions in optimal DG and DSTATCOM allocation problem in the RDS. Very often, these objectives are conflicting with each other. Thus, simultaneous optimization of the opposing objectives has become challenging task for researchers. Multi-objective function consists of a number of functions to be optimized simultaneously, subjected to certain operating constraints. In this paper, the following new multi-objective function is used which simultaneously minimizes the power loss, improves voltage profile and maximizes voltage stability index.
Mathematically, the proposed multi-objective optimization problem for optimal DG and DSTATCOM placement with equality and inequality constraints can be defined as follows
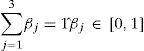
where β1, β2 and β3 are the weighting factors related to power loss minimization, TVD minimization and VSI maximization respectively.The weights are designated to give the corresponding priority to each impact indices for DG/DSTATCOM connection and depend on the required analysis (e.g., planning and operation) (Hung, Mithulananthan, & Bansal, 2014; Singh, Singh, & Verma, 2009). To determine the appropriate weights also rely on the experience of power system researchers and the concerns of distribution side utilities. Simultaneous DG and DSTATCOM allocation in the RDS has an important impact on the power loss reduction and voltage profile enhancement (by minimizing the TVD). Presently, the power loss reduction is one of the major concerns at the RDS level due to its impact on the utilities’ profit, while the voltage profile improvement (minimization of TVD) and voltage stability index maximization are less important than the power loss reduction. Hence, the authors have taken the weight for the power loss minimization as 0.4 (β1=0.4), weight for the TVD minimization as 0.3 (β2=0.3) and weight for the voltage stability maximization as 0.3 (β3=0.3).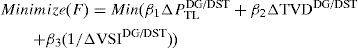
The above objective function is subjected to following equality and inequality constraints:
- a.
Power balance constraints
Power balance constraints, which are equality constraints, can be formulated as follows
where PD(t) is the power demand at bus t and PDG/DST(t) is the power generation using DG/DSTATCOM. - b.
Voltage magnitude constraint
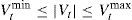
The voltage magnitude at each bus must be maintained within its limits and is expressed as
where Vtmin is the minimum voltage limits of the buses and Vtmax is the maximum voltage limits of the buses. - c.
Real power compensation
Real power constraint in which injected real power at each candidate bus must be within their permissible ranges
where PDG(t)min is the minimum real power limits of compensated bus t and PDG(t)max is the maximum real power limits of compensated bus t. - d.
Reactive power compensation
Reactive power constraint in which injected reactive power at each candidate bus must be within their permissible ranges
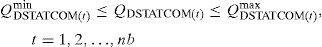
where QDSTATCOM(t)min is the minimum reactive power limits of compensated bus t and QDSTATCOM(t)max is the maximum reactive power limits of compensated bus t.


LSA is a new metaheuristic optimization tool, developed by Shareef et al. in 2015 in view of the common phenomenon of lightning (Shareef, Ibrahim, & Mutlag, 2015). This LSA optimization technique has been generalized mainly from the mechanism of step leader (SL) propagation. It considers the inclusion of faster particles acknowledged as projectiles, in the development of the binary tree structure of the step leader and also the simultaneous development of two leader tips at fork points. The idea of step leaders behind the projectiles is highly similar to the well-known term “particle” which is effectively used in PSO and it represents the initial population in the search space.
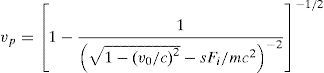
3.1Properties of the projectileA projectile when it passes through the environment under normal condition causes the loss of kinetic energy through elastic collisions with molecules and atoms in the air. The major parameters used in LSA are kinetic energy (Ep) and velocity of a projectile (vp) can be represent as
where vp and v0 represents the present and initial velocity of the projectile respectively, c is the speed of light, Fi is the ionization rate, m is the mass of the projectile, and s is the length of the path travelled by the projectile.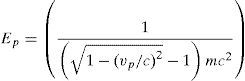
The above-mentioned equations clearly express the kinetic energy and velocity as a function of leader tip position and projectile mass. During the condition when the projectile is having lesser mass and it travelled through long distance experiences a lesser potential to ionize or it can explore to a large space. Henceforth, the exploration and exploitation properties of LSA technique can be effectively controlled by using the relative energies of the step leaders.
3.2Projectile modeling and step leader movementSimilar to other meta-heuristics algorithms, the LSA also needs a population to begin the search. The fast particles in the search are known as projectiles. Further, to model projectile there exists three types basically, such as transition projectile, which causes to develop the first step in the process called leader population N, the second projectile, i.e., space projectiles tries to turn out to be leader, and the third projectile, i.e., lead projectile represents the best position of the particle over the all step leaders. The basic function and development of each projectile is discussed below.
3.2.1Transition projectileAs discussed earlier, a leader tip is molded at first stage since the transition forms an ejected projectile from the thunder cell in a random direction. In this manner, it can be demonstrated as a random number drawn from the standard uniform probability distribution on the open interval representing the solution space. Further, the probability density function f(xT) under standard uniform distribution is given as
where xT is a random number that may provide a solution or the initial tip energy Esl_i of the step leader si; a and b are the lower and upper bounds, respectively, of the solution space. For a population of N step leaders SL=[sl1, sl2, sl3, …, slN], N random projectiles PT=p1T,p2T,p3T,…,pNT that satisfy the solution dimension are required.3.2.2Space projectile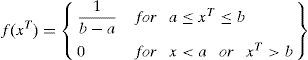
Whenever ‘N’ step leader tips are formed, then the leaders has to move by using the energetic projectiles by ionizing the section in the vicinity of the old leader tip in the next step, i.e., step+1. The position of the space projectile PS=p1S,p2S,p3S,…,pNS at step+1 can be partially modeled as a random number generated from the exponential distribution with presence of shaping parameter μ. The probability density function f(xS) of an exponential distribution is represented in Eq. (29)
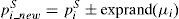
From Eq. (32) it can be understood that the space projectile position or the direction in the next step can be controlled by shaping parameter μ. Further, in the LSA, μi for a specific space projectile piS is taken as the distance between the lead projectile pL and the space projectile piS under consideration. From this condition, the position of piS at step+1 can be derived aswhere exprand is an exponential arbitrary number. If piS is negative, then the generated random number should be subtracted because Eq. (32) can generate only positive values. However, the new position of projectile pi_newS does not guarantees the stepped leader propagation or channel formation unless the projectile energy Ep_iS should be greater than the step leader Esl_i to further extend the channel or until to find a best solution. If pi_newS provides best solution at step+1, then the corresponding stepped leader sli can transformed to a new position sli_new, then piS is updated as pi_newS. Else, position of particle is unaltered until to next step. Whenever pi_newS extends sli_new beyond the recent, most extended leader during this process, then it becomes the lead projectile.3.2.3Lead projectile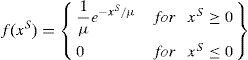
Presumably, the step leader which can travel nearest to the ground and the projectile associated with it does not have enough potential to ionize the large sections in front of the leader tip. Therefore, the lead projectile can be exhibited as a random number drawn from the standard normal distribution with the shape parameter μ and the scale parameter σ. In this condition, the normal probability density function f(xL) is expressed as
Eq. (6) expounds that, the randomly generated lead projectile can search in all directions from the current position which is well-defined by the shape parameter. This developed projectile also have an exploitation ability defined by the scale parameter. In the LSA, μL for the lead projectile pL is taken as pL, and the scale parameter σL exponentially decreases as it progresses toward the best solution. From the above discussion, the position of pL at step+1 can be derived aswhere normrand is a random number generated by the normal distribution function. Similarly, the new lead projectile position pnewL does not guarantee step leader propagation unless the lead projectile energy Ep_iL is greater than the step leader Esl_i to extend to a satisfactory solution. If pnewL provides a good solution at step+1, then the corresponding step leader sli is extended to a new position slL_new and pL is updated to pnewL. Otherwise, they remain unchanged until the next step, as in the case of the space projectile.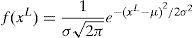

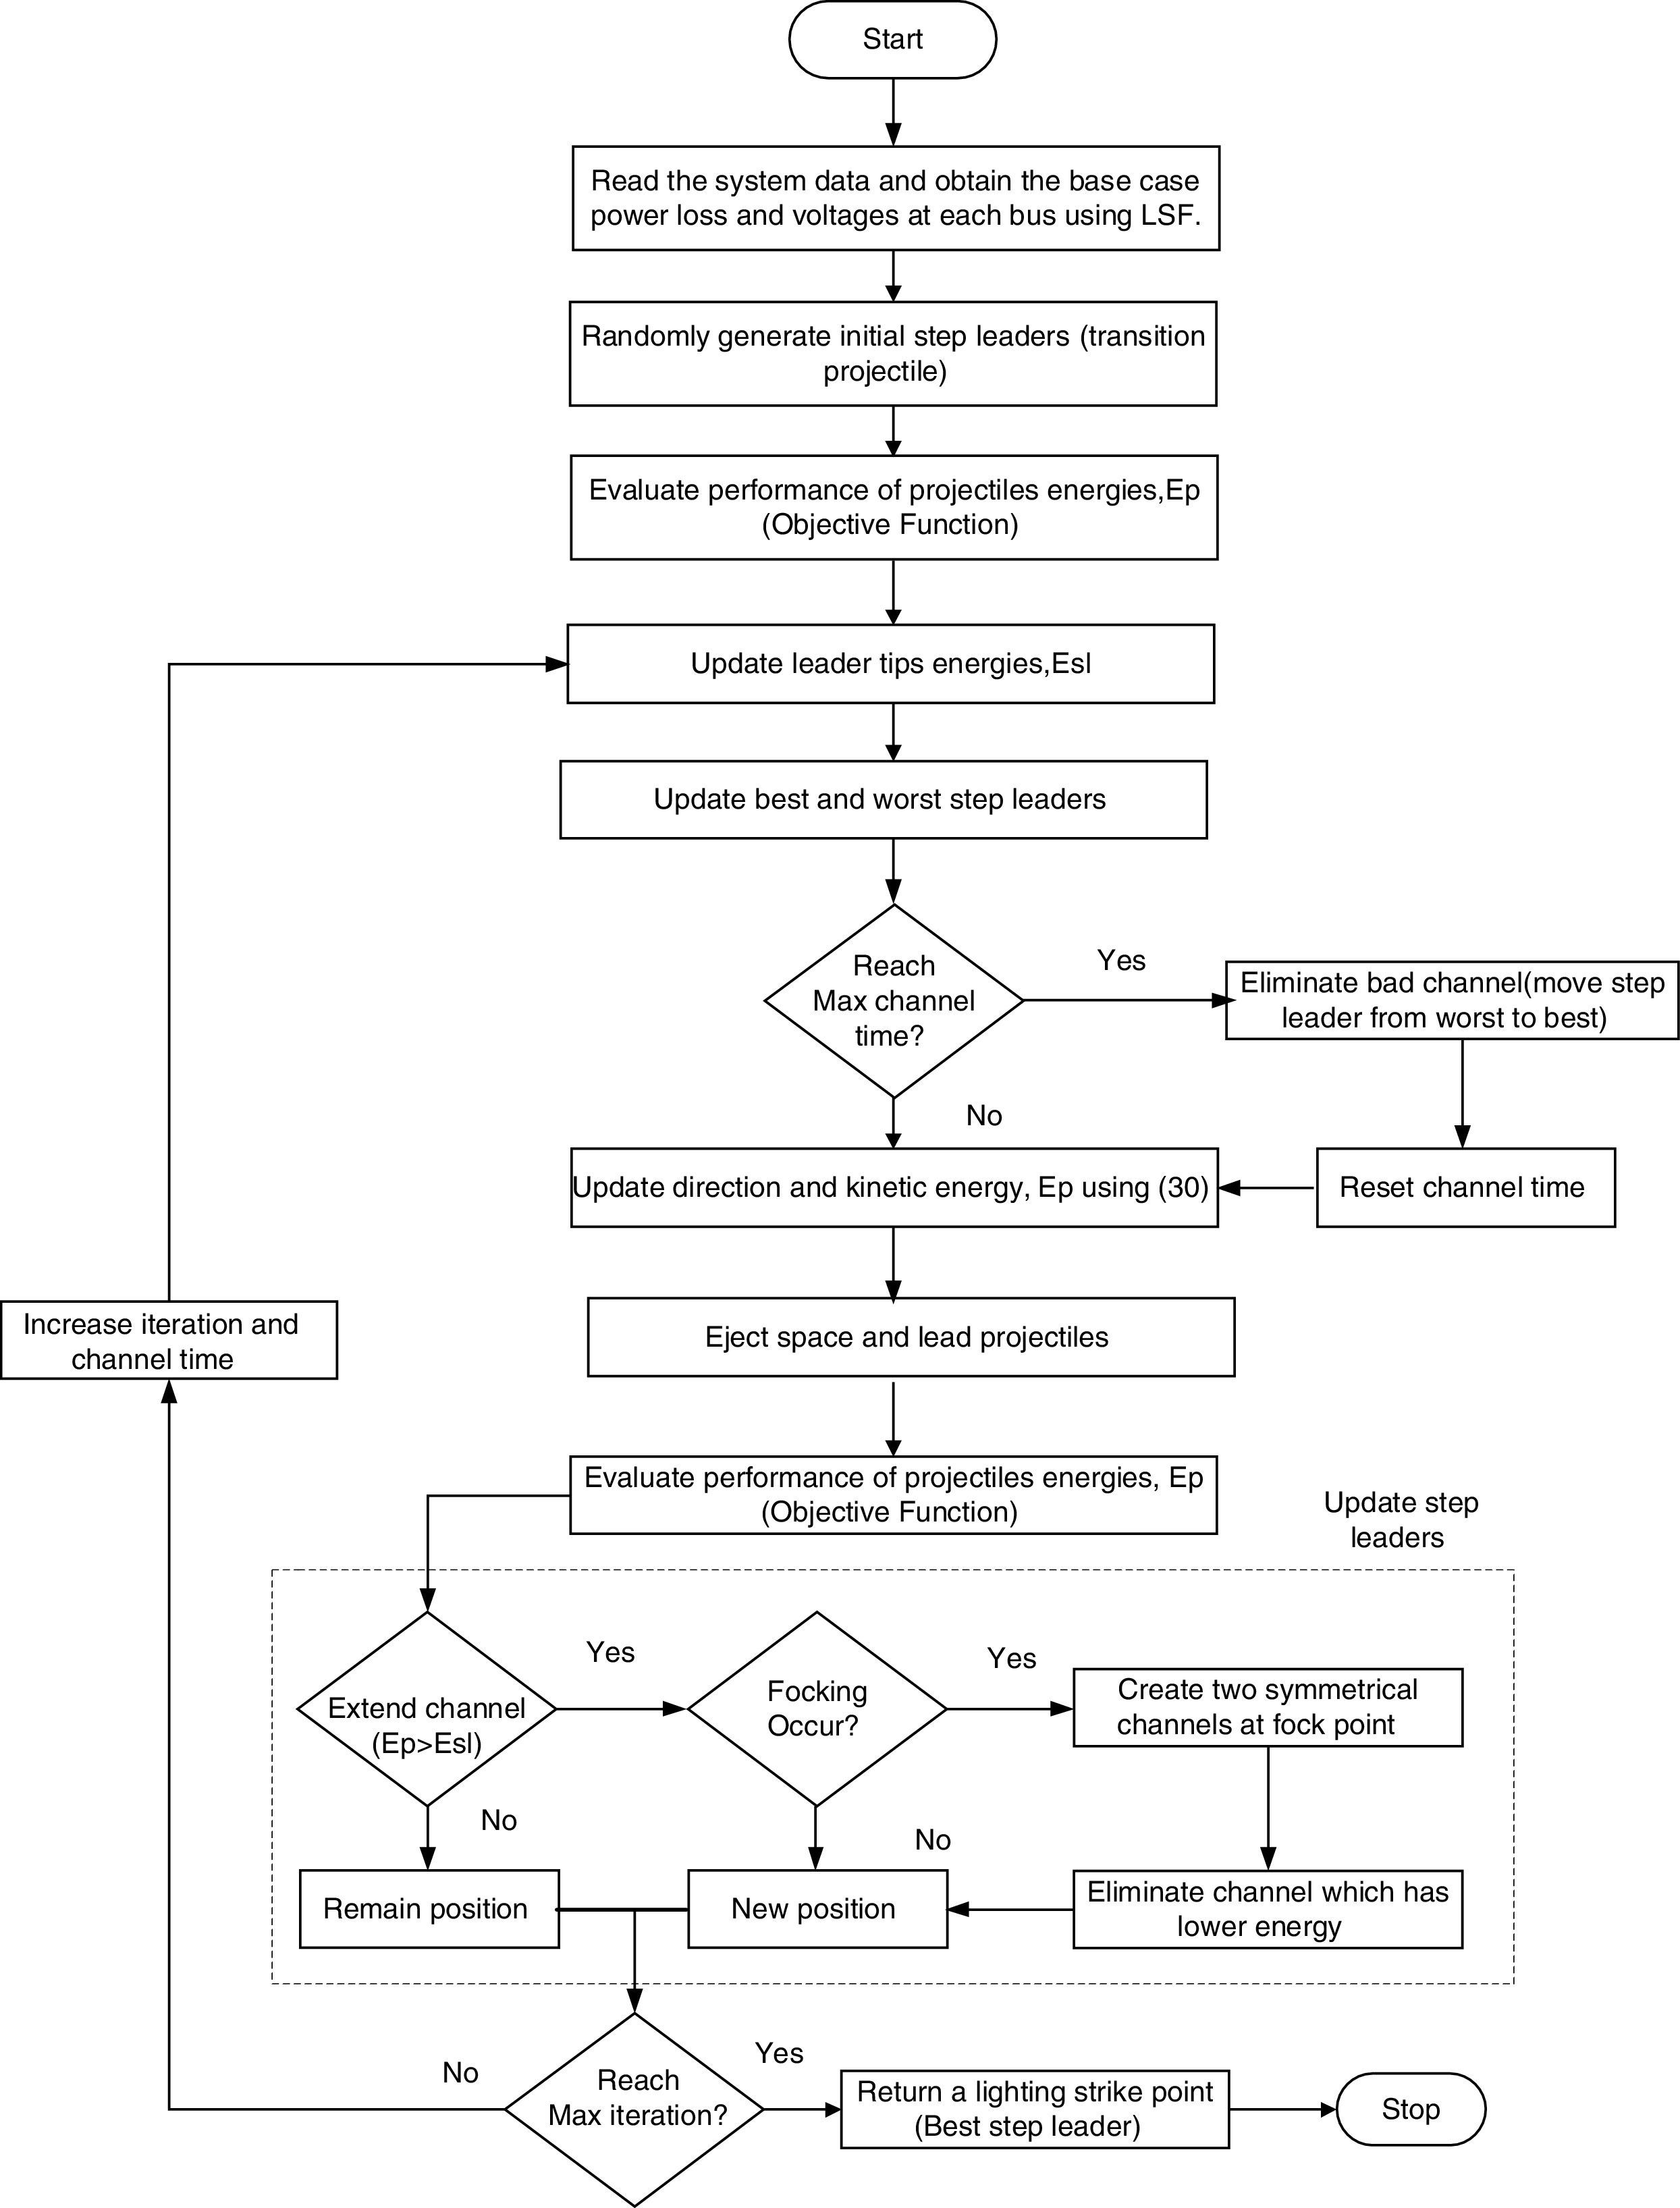
The proposed method for implementing LSA to allocate the DG and DSTATCOM simultaneously in the distribution network can be summarized as follows:
Step 1: Obtain the base case real and reactive power losses, TVD, minimum VSI value and voltage values at each bus using Backward/Forward Sweep distribution load flow analysis.
Step 2: Set the population size, maximum number of iterations, maximum channel time, and the upper and lower bounds.
Step 3: Set the number of dimensions based on the unknown parameters of the DG and DSTATCOM problem.
Step 4: Randomly create the first set of solution vectors (x) related to population size and dimension as the SL.
Step 5: Evaluate the objective function of the solution vector (f(x)) for N number of experimental data as compared to the obtained results.
Step 6: Evaluate the objective function of the step leader (f(SL)).
Step 7: Rank the SL (step leader) in descending order.
Step 8: If the maximum channel time is not reached, eliminate the worst channel and update the solutions direction and the objective function value.
Step 9: Eject the space and lead projectiles.
Step 10: Evaluate the objective function of solution vector (f(x)).
- a.
Step 11: If f(x)>f(SL)), check the possibility of a forking event and update the SL positions.
Step 12: If maximum iteration is not reached, increase the iteration and channel time then go to step 6, otherwise it is the best solution.
Step 13: Display the final optimal solution.

In the distribution networks, the load models have been characterized by voltage sensitivity values. The following load models are commonly used in the distribution networks.
- •
Constant Power – In this model, the real and reactive powers are independent from the voltage changes.
- •
Constant Current – In this model, the real and reactive powers are directly proportional to the bus voltage.
- •
Constant Impedance – In this model, the real and reactive powers are directly proportional to the square of the bus voltage.
The load variation between no-load to full-load can be determined by the following equation
where ∂ is the load factor. To validate the effectiveness and performance of proposed method, it has been implemented on standard IEEE 33-bus and 69-bus systems that work at 12.66kV and have radial structure. For all the cases of 33 and 69-bus test systems, the power system feeder loads are linearly varied from 50% (light) to 160% (peak) in a step of 1% load, at the same time the optimal size of DG and DSTATCOM are calculated by LSA for each load step variations.4.1IEEE 33-bus test system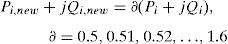
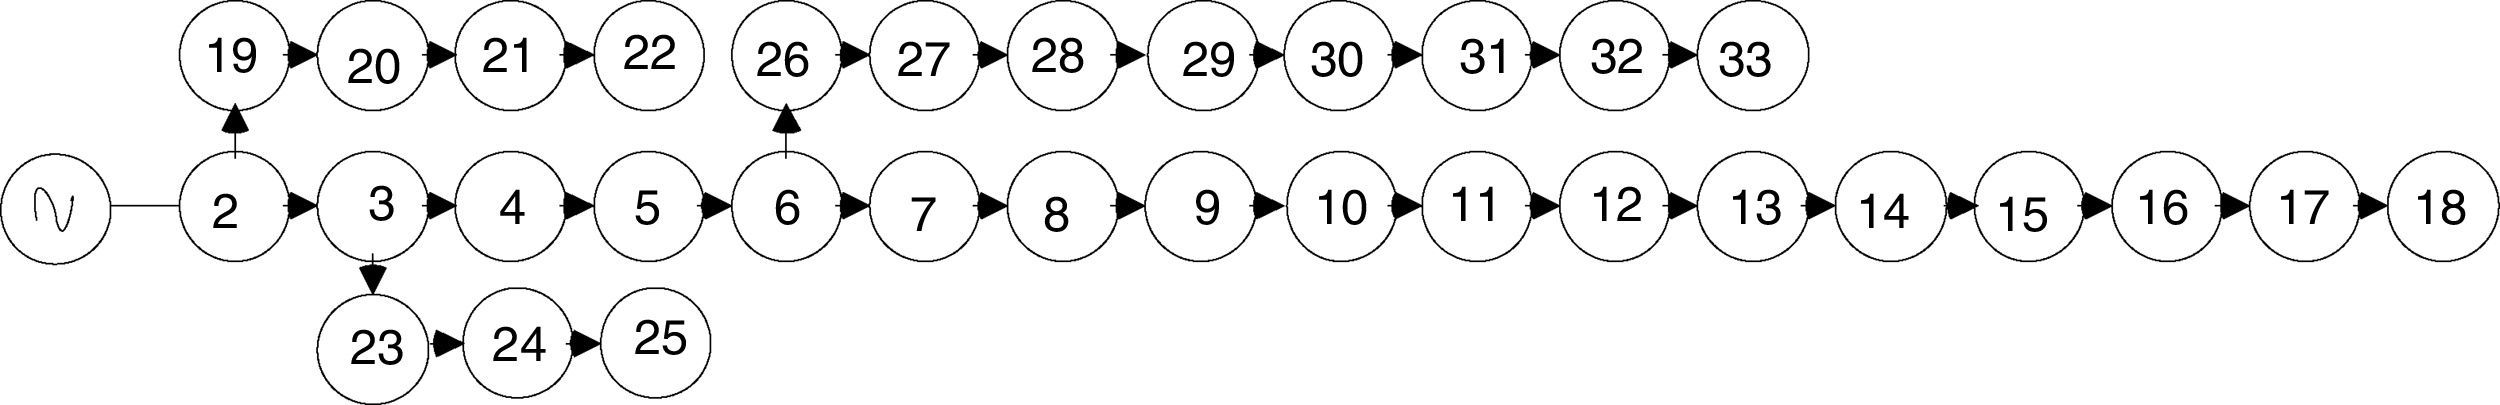
This is a medium scale radial distribution system consisting of 33 buses and 32 branches. The network base voltage is 12.66kV and the base apparent power is 10MVA. The network data, including the resistance and reactance of the lines and the loads connected to nodes, are obtained from Sahoo and Prasad (2006). The single line diagram of IEEE 33-bus radial distribution system is depicted in Fig. 3.

In IEEE 33-bus test system, four different cases have been considered to analyze the effectiveness of the proposed method.
Case (i): System without compensation
Case (ii): System with DSTATCOM
Case (iii): System with DG
Case (iv): System with DG & DSTATCOM
Case (i): System without compensation
After an initial load flow run using Backward/Forward Sweep method for an uncompensated 33 test system, the active power loss is 210.98kW and minimum voltage is 0.9037p.u. The initial TVD and minimum VSI values are 1.6229 and 0.6610p.u. respectively.
By the utilization of curve fitting technique, the base case real power loss of 33-bus test system has been approximated as following generalized equation.

Case (ii): System with DSTATCOM
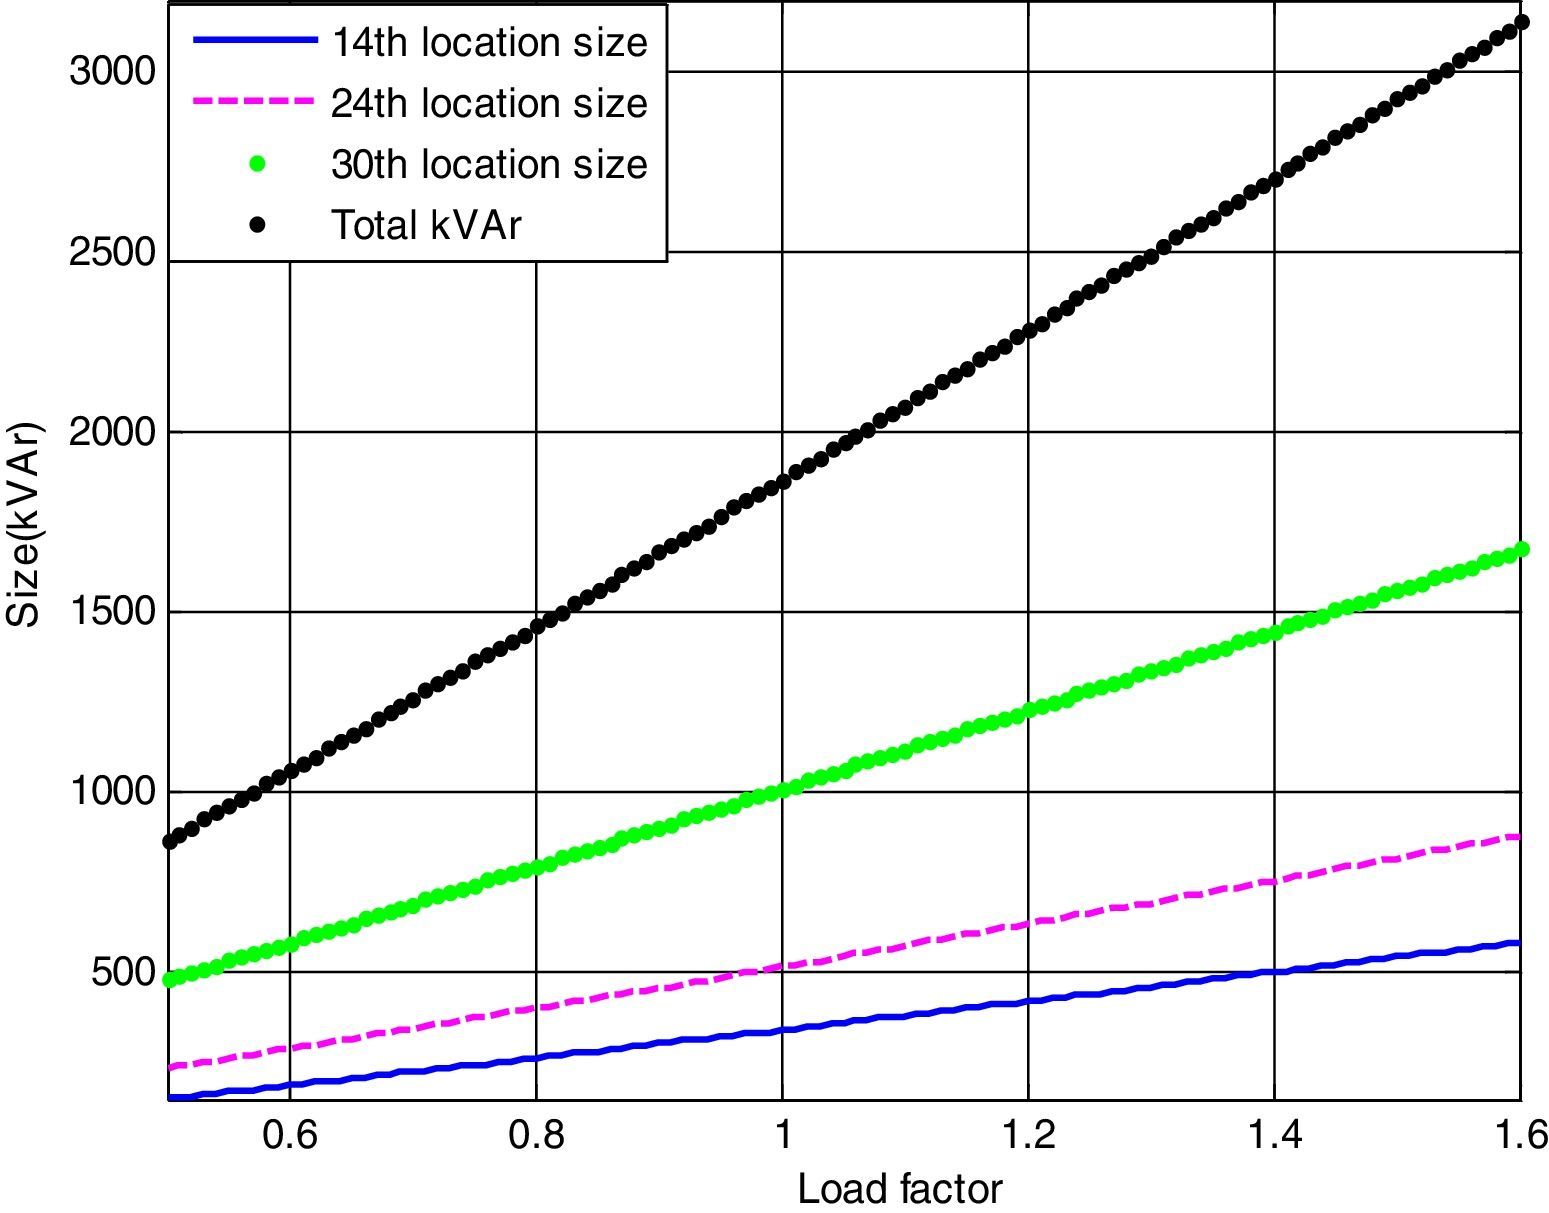
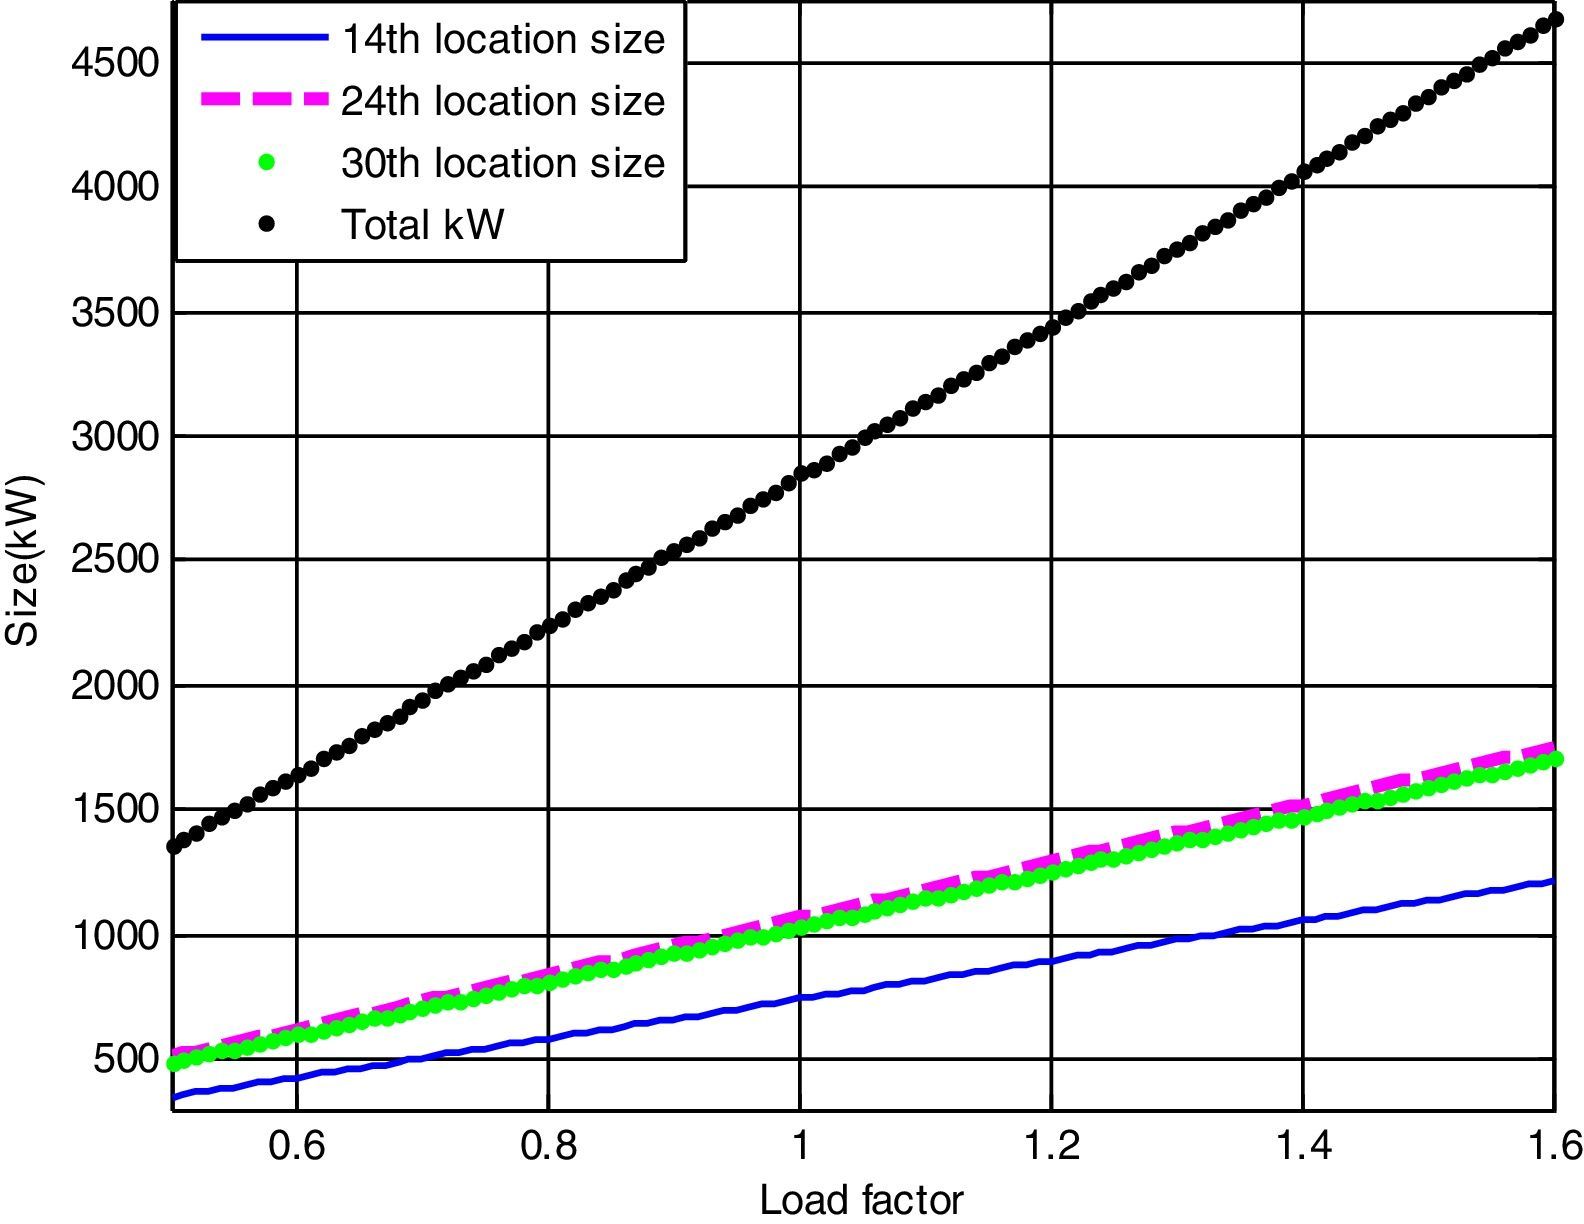
In this case, three DSTATCOMs have been optimally located and sized at 14th, 24th and 30th buses with utilization of LSA. The active power loss has been reduced to 138.35kW from 210.98kW after installing the DSTATCOMs in the system. The TVD is minimized to 0.7955p.u. and VSImin is maximized to 0.7423p.u. The optimal sizing with DSTATCOM under different load variations of 33-bus system are shown in Fig. 4.

Based on the curve fitting technique the total real power loss of the IEEE 33-bus system (with DSTATCOM) can be formulated as generalized equations and it is given by
Optimal size of the DSTATCOM for 14th, 24th and 30th locations with different load changes are given by


Case (iii): System with DG
In this case, the three DG units are placed to the buses 14th, 24th and 30th respectively. The optimal locations and sizes of the DG units have been determined by the use of LSA algorithm. The real power loss is reduced to 72.78kW. The TVD is almost zero; it shows the voltage profile improvement of the system. The minimum bus voltage is improved from 0.9037p.u. to 0.9669p.u. The optimal sizing with DGs under different load variations of the system are shown in Fig. 5.

The generalized equation of active power loss for any load level are attained through CFT of the 33-bus test system with multiple DGs as follows:
Optimal size of the DG for 14th, 24th and 30th locations with different load changes are given by


Case (iv): System with DG and DSTATCOM
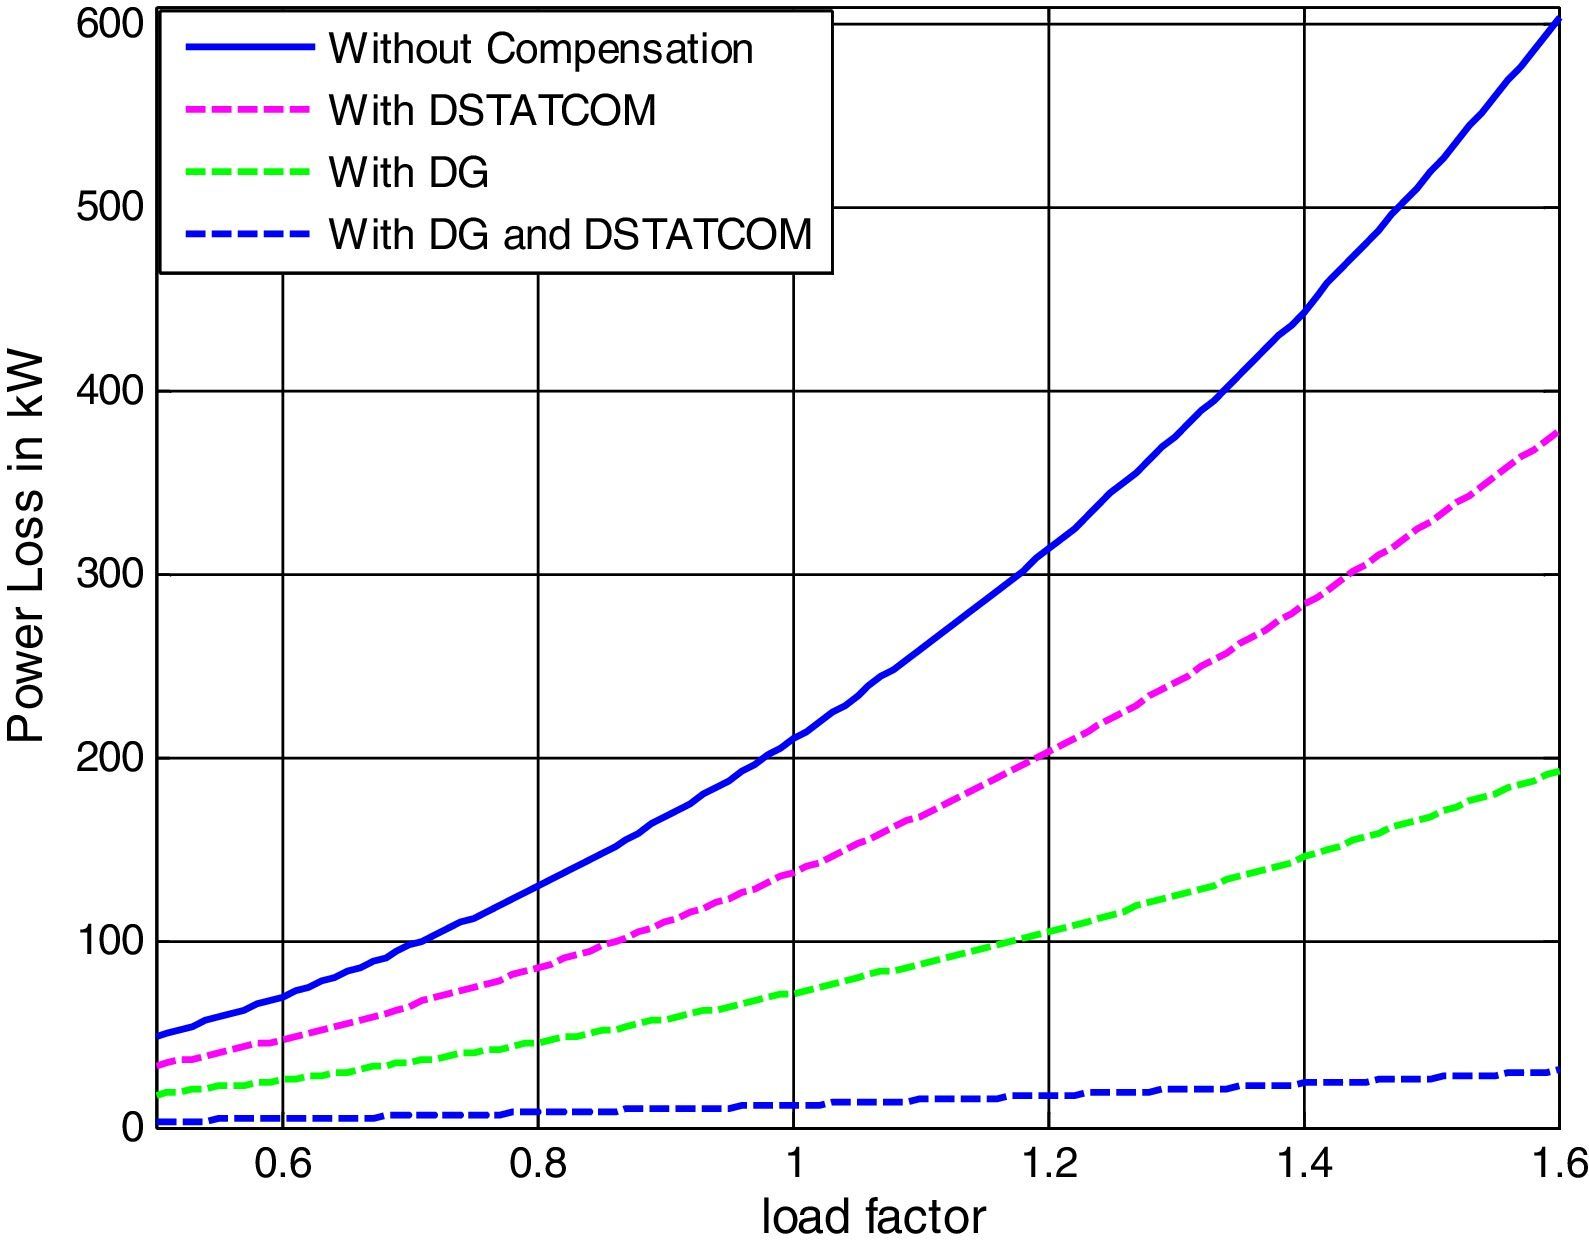
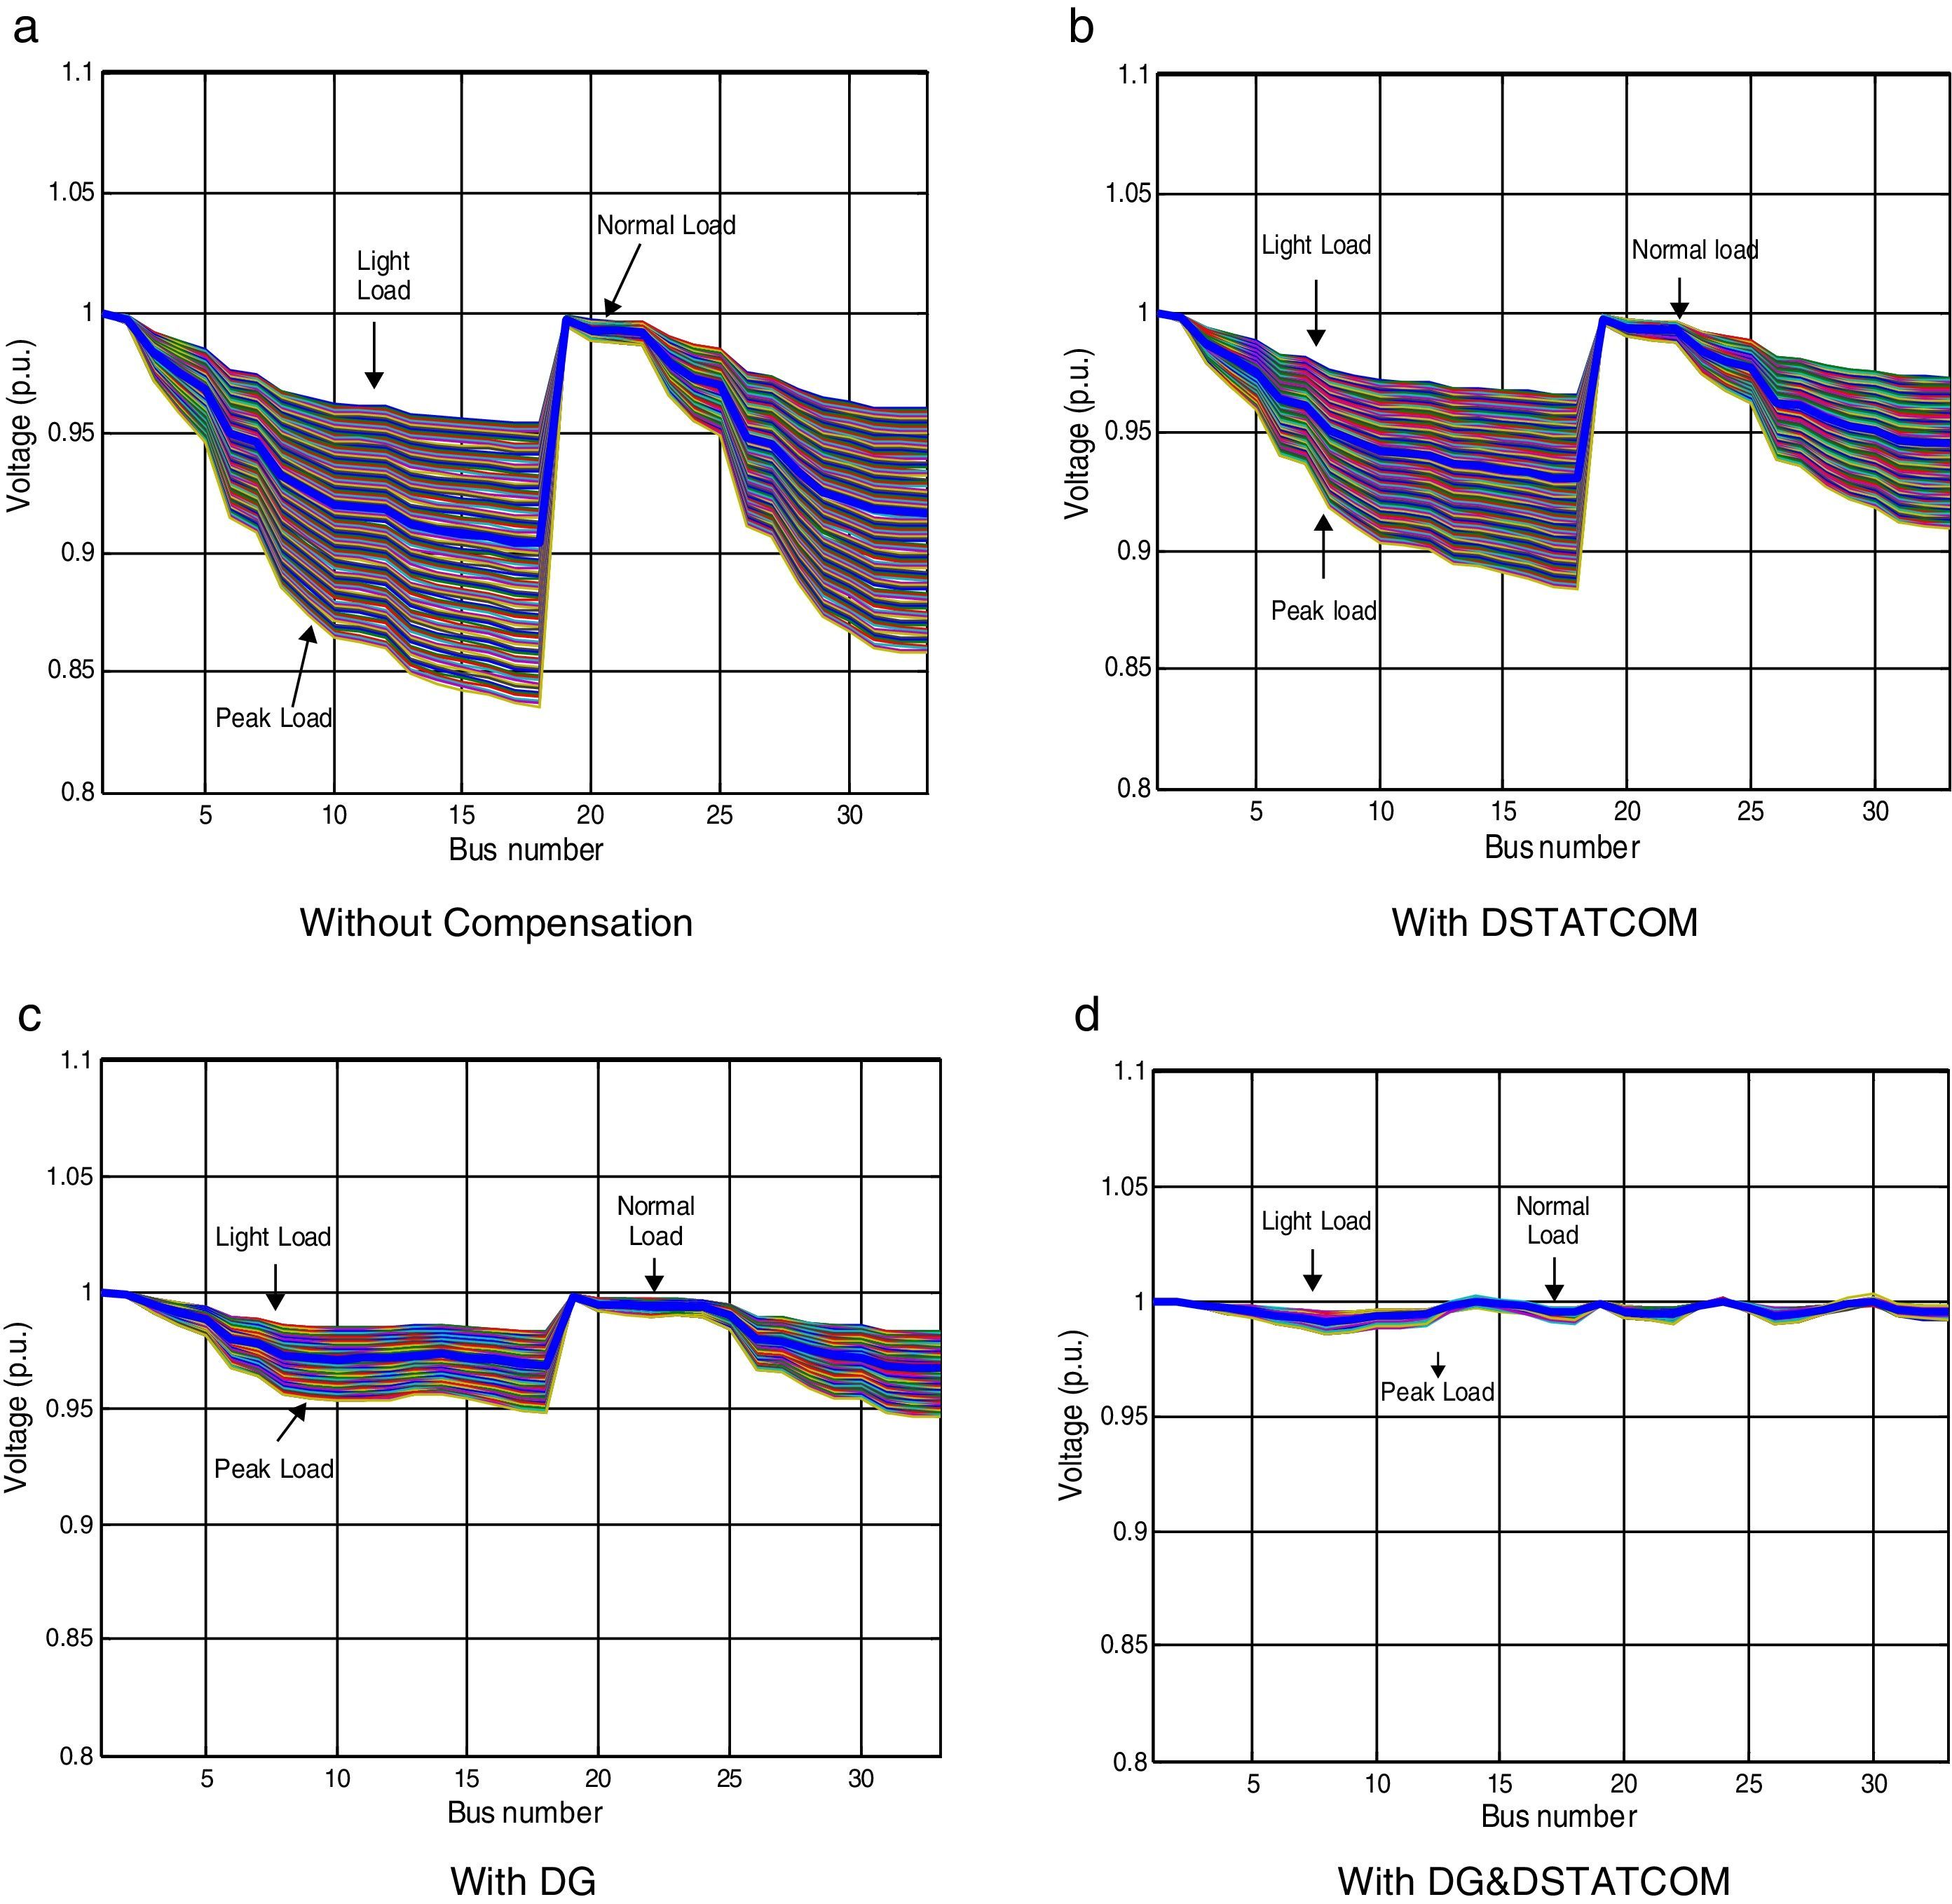
Employing DG units and DSTATCOMs at the same time in a radial distribution system increases system efficiency, reduces power losses, improves system voltage profile and distribution relief capacity for both utilities and the customers. In this case DGs and DSTATCOMs are simultaneously placed in the radial distribution networks. The optimal size of both DGs and DSTATCOMs at these candidate buses are obtained by LSA in less CPU time. Fig. 6 shows the power loss of different cases for 33 bus systems for the proposed algorithm under different load conditions. The real power loss has been reduced to 11.77kW. The percentage of loss reduction is 94.42% with minimum voltage of 0.9970p.u. when DG and DSTATCOM placement is done simultaneously. It can be observed that for all the four cases, the simultaneous placement of DGs and DSTATCOMs (Case-iv) gives the higher percentage loss reduction and voltage profile enhancement as compared with other cases. The voltage profile of the system with different cases under different load variations is depicted in Fig. 7. Compared to all case, the case 4 (System with DG and DSTATCOM) gives better voltage improvement in the RDS.

.")
By the utilization of CFT the total real power loss of the IEEE 33-bus system (with DG & DSTATCOM) can be expressed as generalized equations
4.1.1Comparative analysis of 33 bus system:
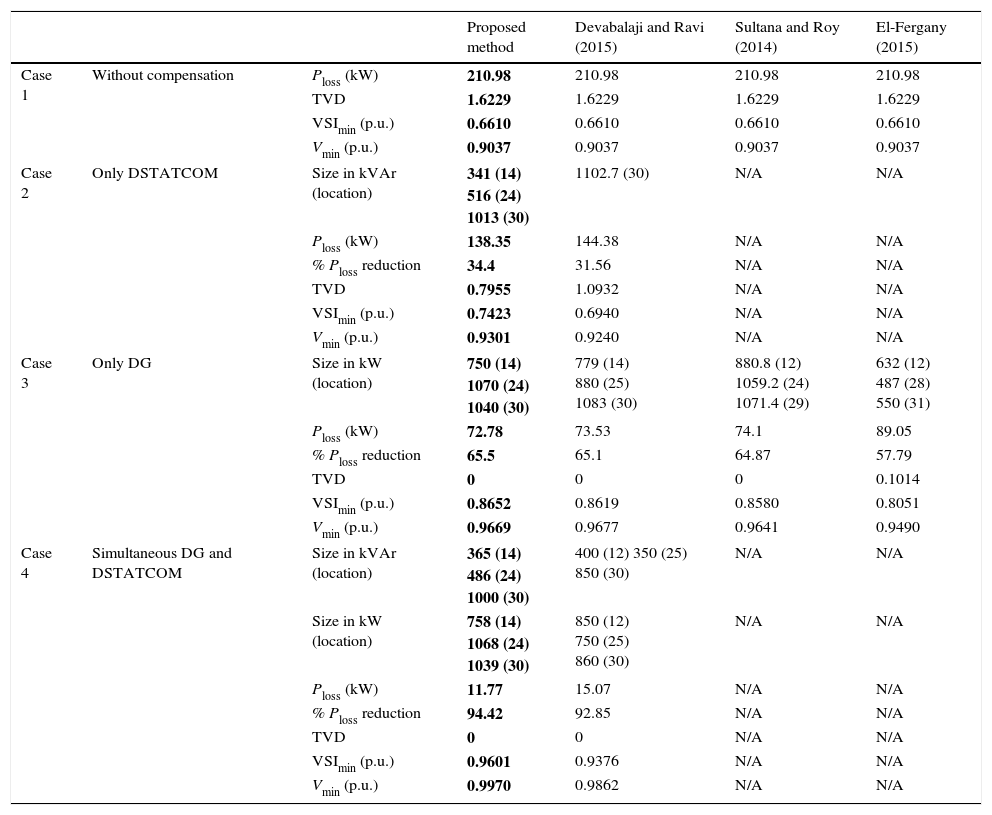
To observe the effectiveness of the proposed algorithm, its results are compared with the other techniques like BFOA (Devabalaji & Ravi, 2015), QOTLBO (Sultana & Roy, 2014) and BSA (El-Fergany, 2015). Table 1 shows the optimal locations and sizes of DGs & DSTATCOMs, active power loss, percentage of power loss reduction, minimum bus voltages, VSImin and TVD for proposed LSA and other methods for four different cases respectively. From Table 1 it is observed that the reduction of power loss and minimum bus voltage improvement in proposed method is more when compared to other methods in all cases.
Performance of 33-bus test system.
| Proposed method | Devabalaji and Ravi (2015) | Sultana and Roy (2014) | El-Fergany (2015) | |||
|---|---|---|---|---|---|---|
| Case 1 | Without compensation | Ploss (kW) | 210.98 | 210.98 | 210.98 | 210.98 |
| TVD | 1.6229 | 1.6229 | 1.6229 | 1.6229 | ||
| VSImin (p.u.) | 0.6610 | 0.6610 | 0.6610 | 0.6610 | ||
| Vmin (p.u.) | 0.9037 | 0.9037 | 0.9037 | 0.9037 | ||
| Case 2 | Only DSTATCOM | Size in kVAr (location) | 341 (14) 516 (24) 1013 (30) | 1102.7 (30) | N/A | N/A |
| Ploss (kW) | 138.35 | 144.38 | N/A | N/A | ||
| % Ploss reduction | 34.4 | 31.56 | N/A | N/A | ||
| TVD | 0.7955 | 1.0932 | N/A | N/A | ||
| VSImin (p.u.) | 0.7423 | 0.6940 | N/A | N/A | ||
| Vmin (p.u.) | 0.9301 | 0.9240 | N/A | N/A | ||
| Case 3 | Only DG | Size in kW (location) | 750 (14) 1070 (24) 1040 (30) | 779 (14) 880 (25) 1083 (30) | 880.8 (12) 1059.2 (24) 1071.4 (29) | 632 (12) 487 (28) 550 (31) |
| Ploss (kW) | 72.78 | 73.53 | 74.1 | 89.05 | ||
| % Ploss reduction | 65.5 | 65.1 | 64.87 | 57.79 | ||
| TVD | 0 | 0 | 0 | 0.1014 | ||
| VSImin (p.u.) | 0.8652 | 0.8619 | 0.8580 | 0.8051 | ||
| Vmin (p.u.) | 0.9669 | 0.9677 | 0.9641 | 0.9490 | ||
| Case 4 | Simultaneous DG and DSTATCOM | Size in kVAr (location) | 365 (14) 486 (24) 1000 (30) | 400 (12) 350 (25) 850 (30) | N/A | N/A |
| Size in kW (location) | 758 (14) 1068 (24) 1039 (30) | 850 (12) 750 (25) 860 (30) | N/A | N/A | ||
| Ploss (kW) | 11.77 | 15.07 | N/A | N/A | ||
| % Ploss reduction | 94.42 | 92.85 | N/A | N/A | ||
| TVD | 0 | 0 | N/A | N/A | ||
| VSImin (p.u.) | 0.9601 | 0.9376 | N/A | N/A | ||
| Vmin (p.u.) | 0.9970 | 0.9862 | N/A | N/A | ||
The TVD index is a good indicator for determination of voltage deviation from nominal values. Closer the index to zero means the better situation of the network. So, this index must be minimized to improve the voltage profile. The proposed method gives better voltage profile compared to other methods, which is confirmed by the TVD values (see Table 1).
Using the voltage stability index, one could measure the level of voltage stability of radial distribution networks and thus appropriate action can be taken if the index indicates a poor level of stability. After DG and DSTATCOM installation in the system, the proposed methods showed considerable improvement in voltage stability index than other methods available in the literature.
From the above discussion, it is observed that the LSA algorithm based optimization method shows better performance than other methods in terms of power loss reduction, voltage profile enhancement and VSI maximization in all the cases.
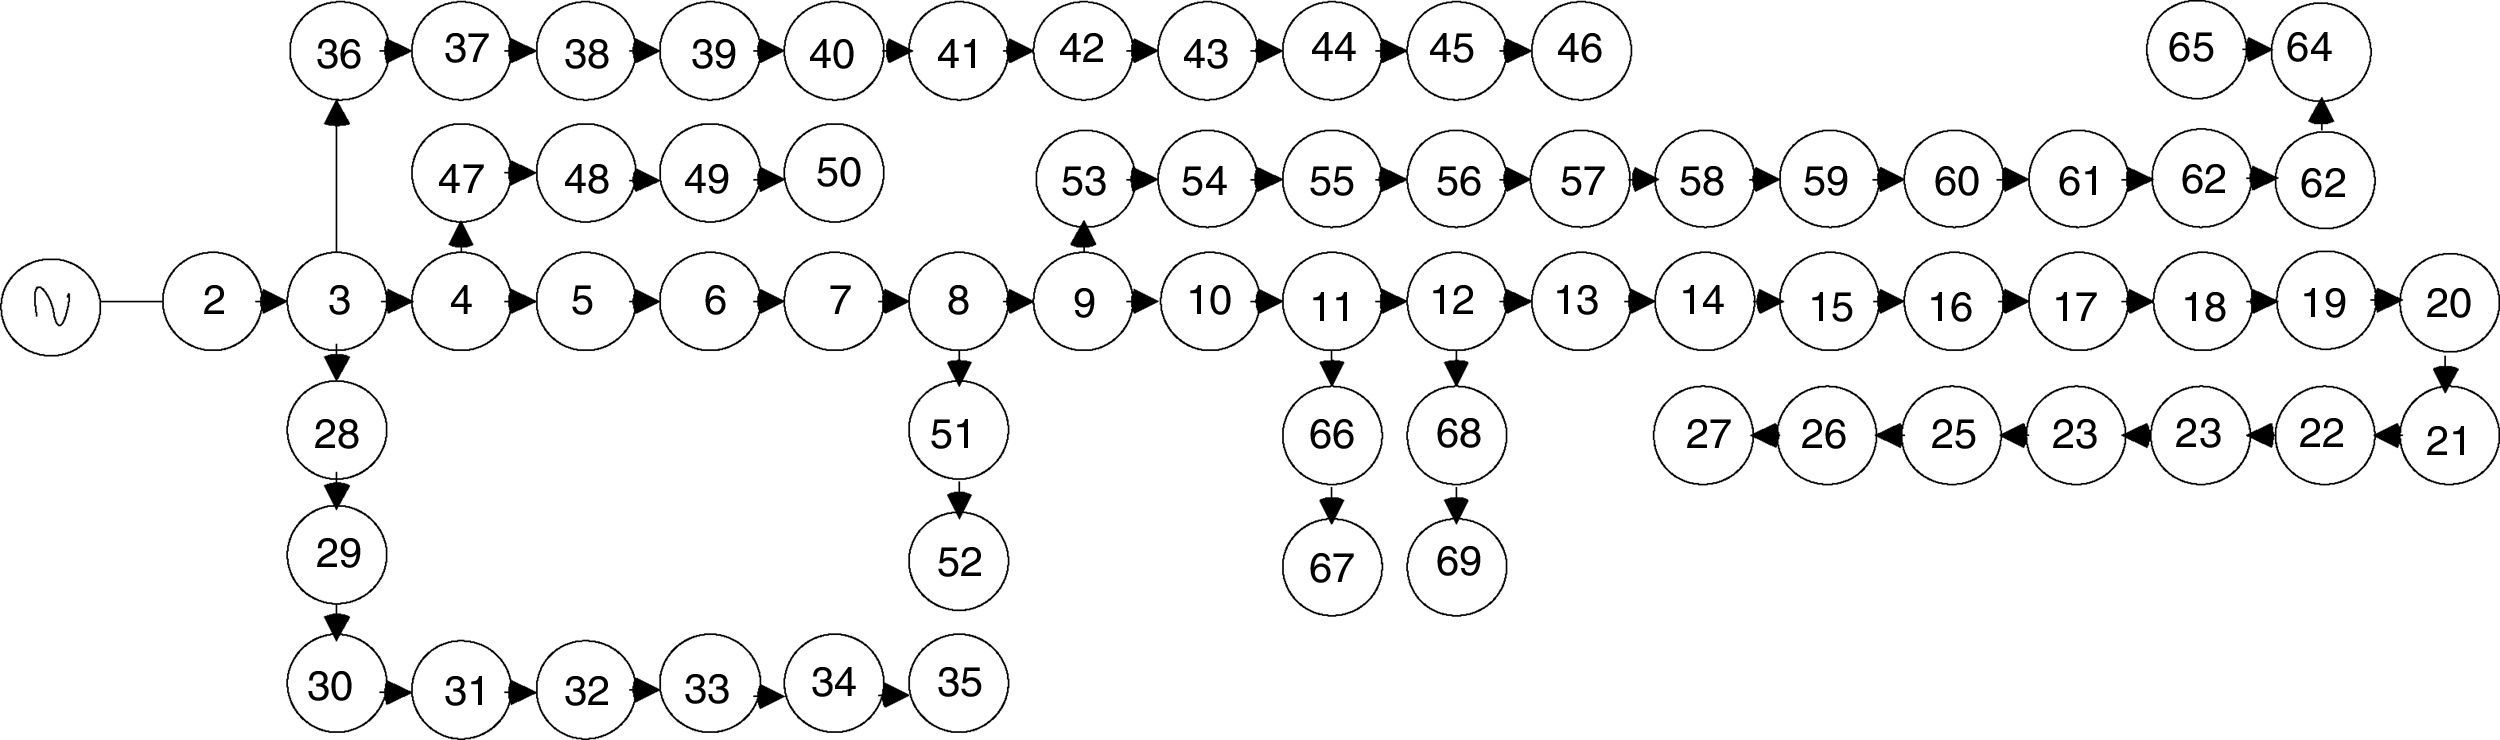
4.2IEEE 69-bus test systemIn this case study a large-scale 69-bus radial distribution system with the total load of 3.80MW, 2.69MVAR has been taken to show the performance of LSA. Fig. 8 shows the single line diagram of the test system and the line data and load data are taken from Sahoo and Prasad (2006).

In IEEE 69-bus test system also, four different cases have been considered to analyze the effectiveness of the proposed method.
Case (i): System without compensation
Case (ii): System with DSTATCOM
Case (iii): System with DG
Case (iv): System with DG & DSTATCOM
Case (i): System without compensation
Before installation of DG and DSTATCOM, the real and reactive power losses in the system are found to be 225kW and 102.13kVAr, when calculated using the Backward-Forward Sweep method of load flow. The values of minimum bus voltage, TVD and VSI minimum without any compensation are 0.9090p.u., 0.7327p.u. and 0.6822p.u. respectively.
Based on the CFT the total real power loss of the IEEE 69-bus system (without compensation) can be formulated as generalized equations and it is given by

Case (ii): System with DSTATCOM
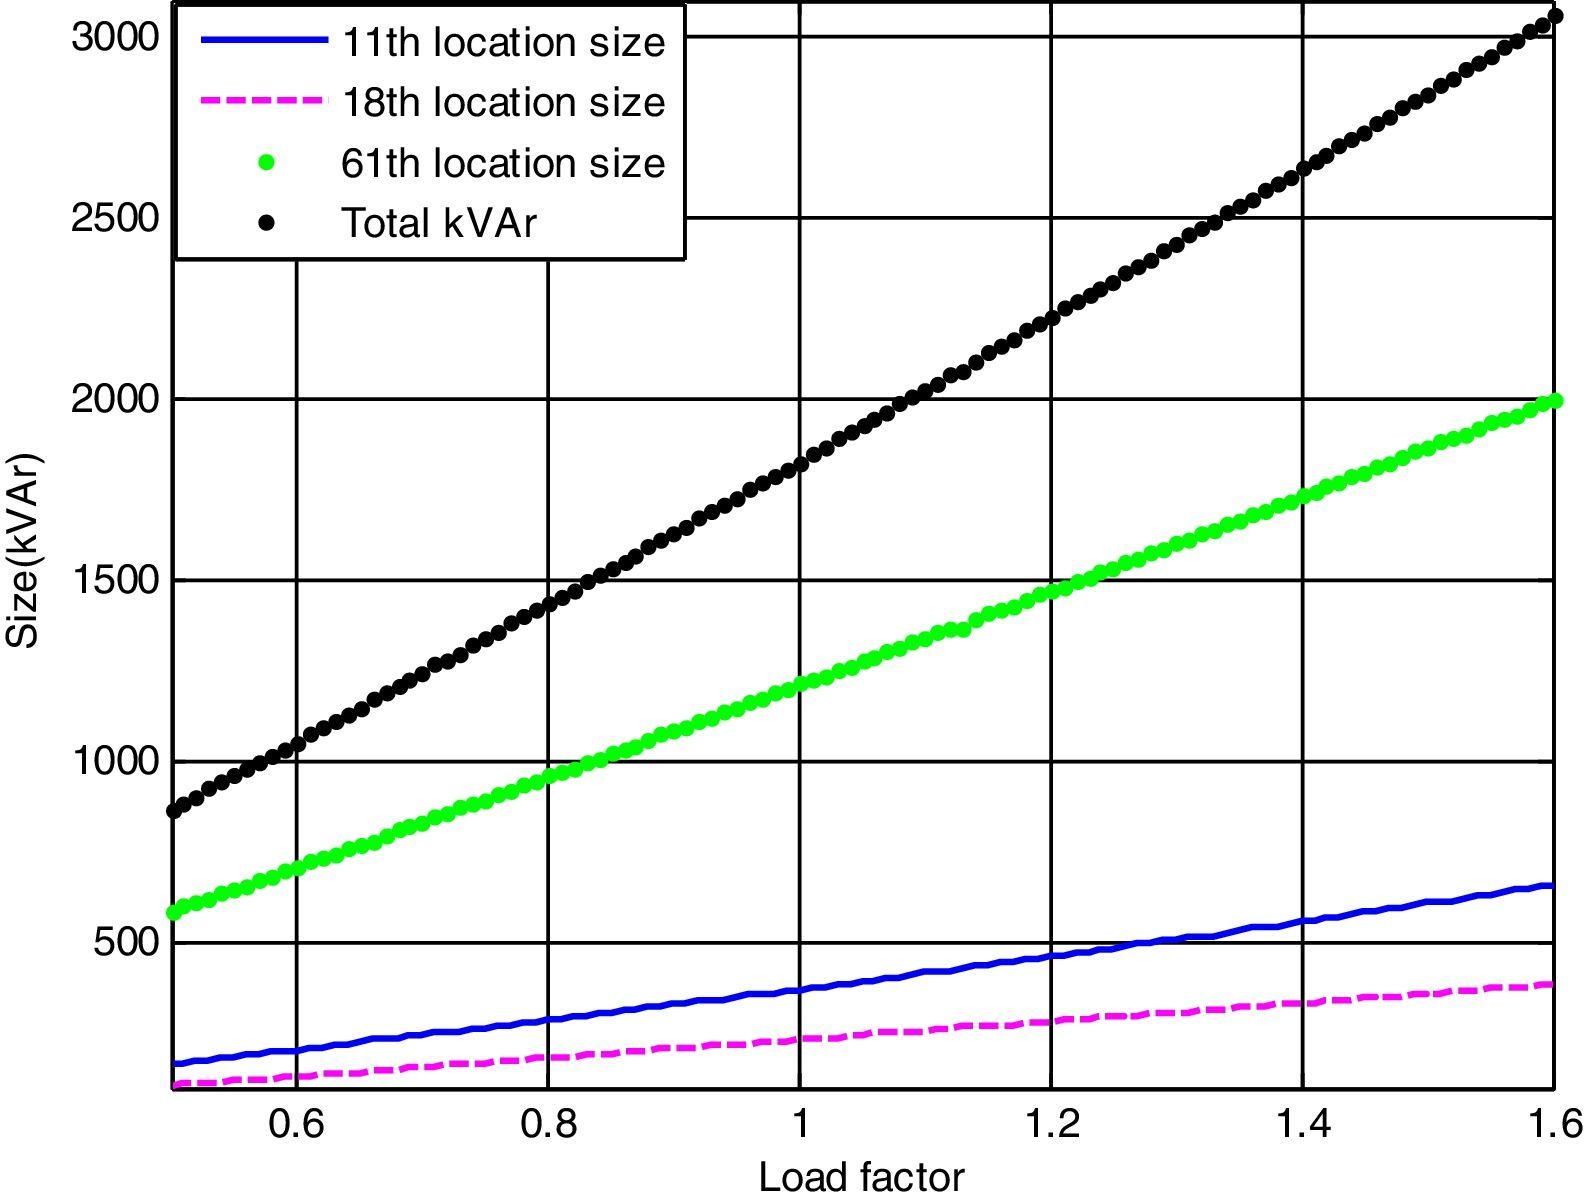
In this case, the optimal locations for the DSTATCOM placement (11th, 18th, 61st buses) and the optimal size of these locations can be determined using LSA. In the proposed method, the active power loss has been reduced to 145.16kW (i.e., percentage of reduction is 35.48%) after installing the DSTATCOM in the system. Fig. 9 shows the optimal size of the DSTATCOM with respect to load factor. The minimum bus voltage and minimum VSI have been improved to 0.9307p.u. and 0.7446p.u. respectively and the TVD has been reduced to 0.5092p.u.

Based on the curve fitting technique the total active power loss of the IEEE 69-bus system (with DSTATCOM) can be formulated as generalized equations and it is given by
In addition, the optimal size of the DSTATCOM for 11th, 18th and 61st locations with different load changes are given byThe above-generalized equations are useful for distribution network operators in power system generation planning.


Case (iii): System with DG
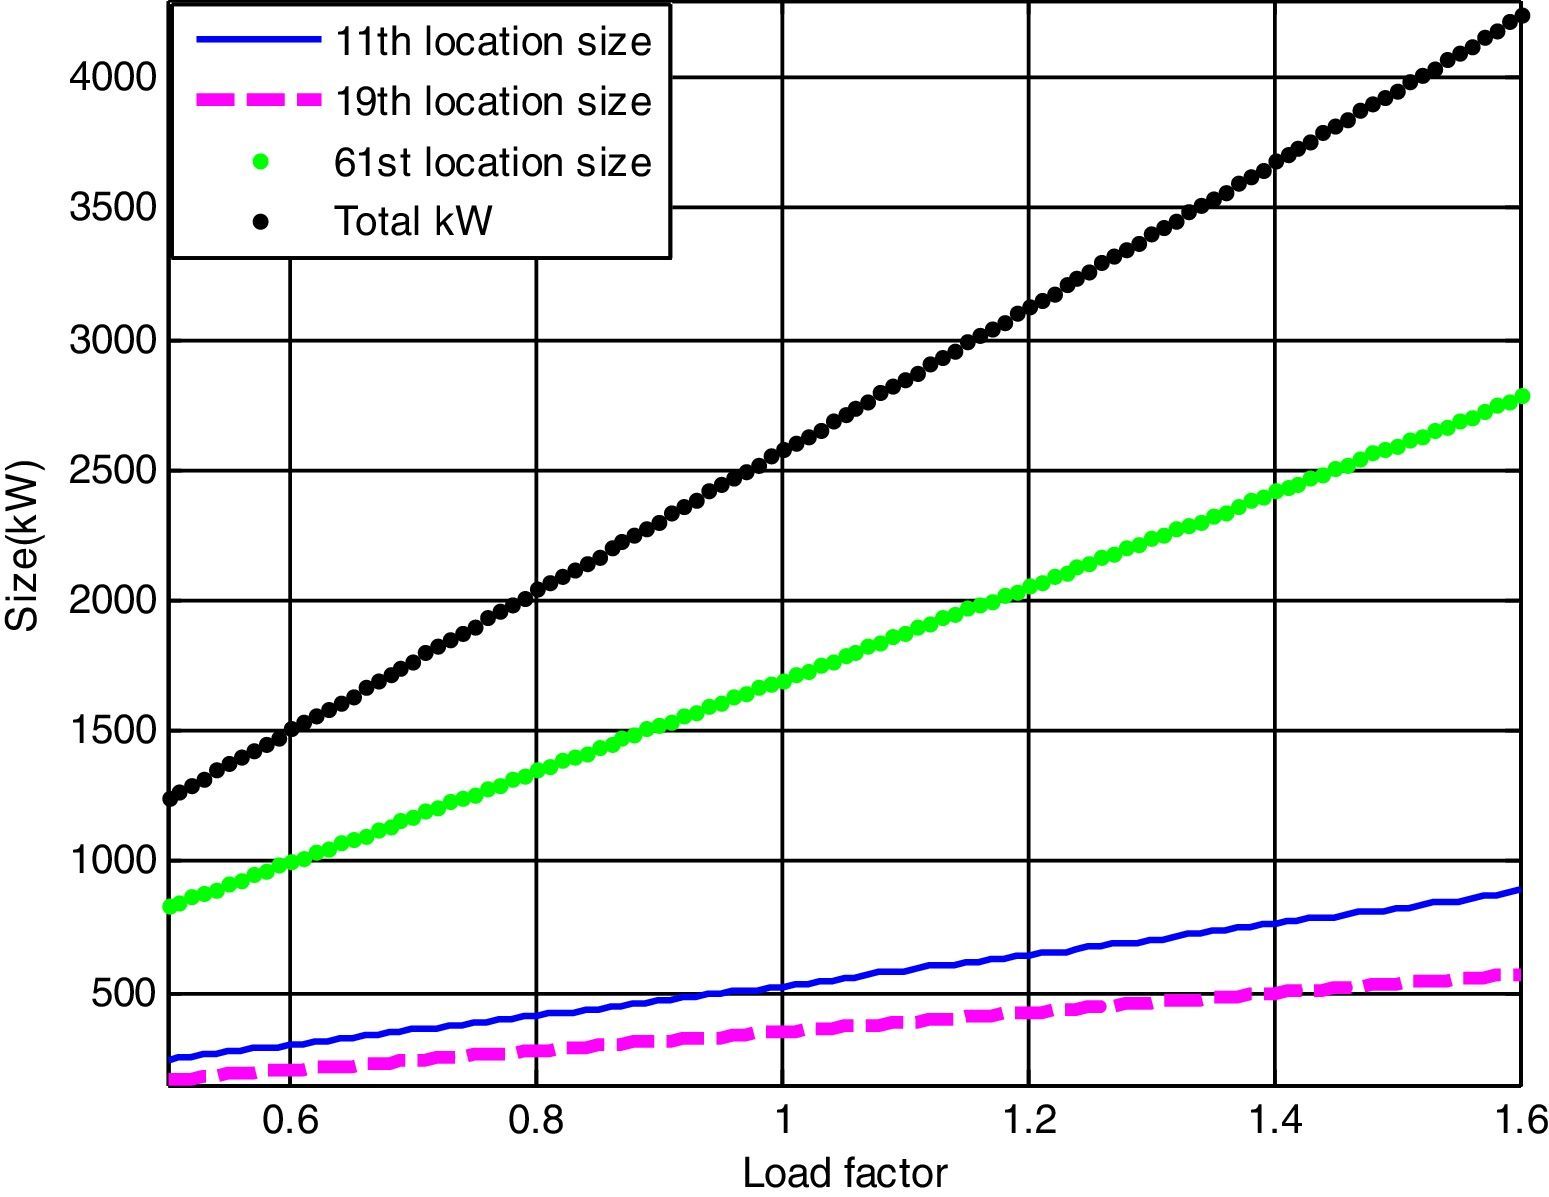
The candidate buses selected for DG placement for the present method are 11th, 19th, and 61st and the optimal size of DGs installed at these buses is determined by LSA. The minimum bus voltage achieved with the proposed LSA is 0.9772p.u. which is superior when compared to system without compensation. The optimal size of the DG with respect to load factor is depicted in Fig. 10.

By the use of CFT, total power loss of the IEEE 69-bus system (with DG) can be expressed as generalized equations and it is given by
Similarly, the optimal size of the DG for 11th, 19th and 61st locations with different load changes using CFT are given byThe above-mentioned equations are worthwhile for DNOs in system generation planning in both long-term and short-term horizons.


Case (iv): System with DG and DSTATCOM
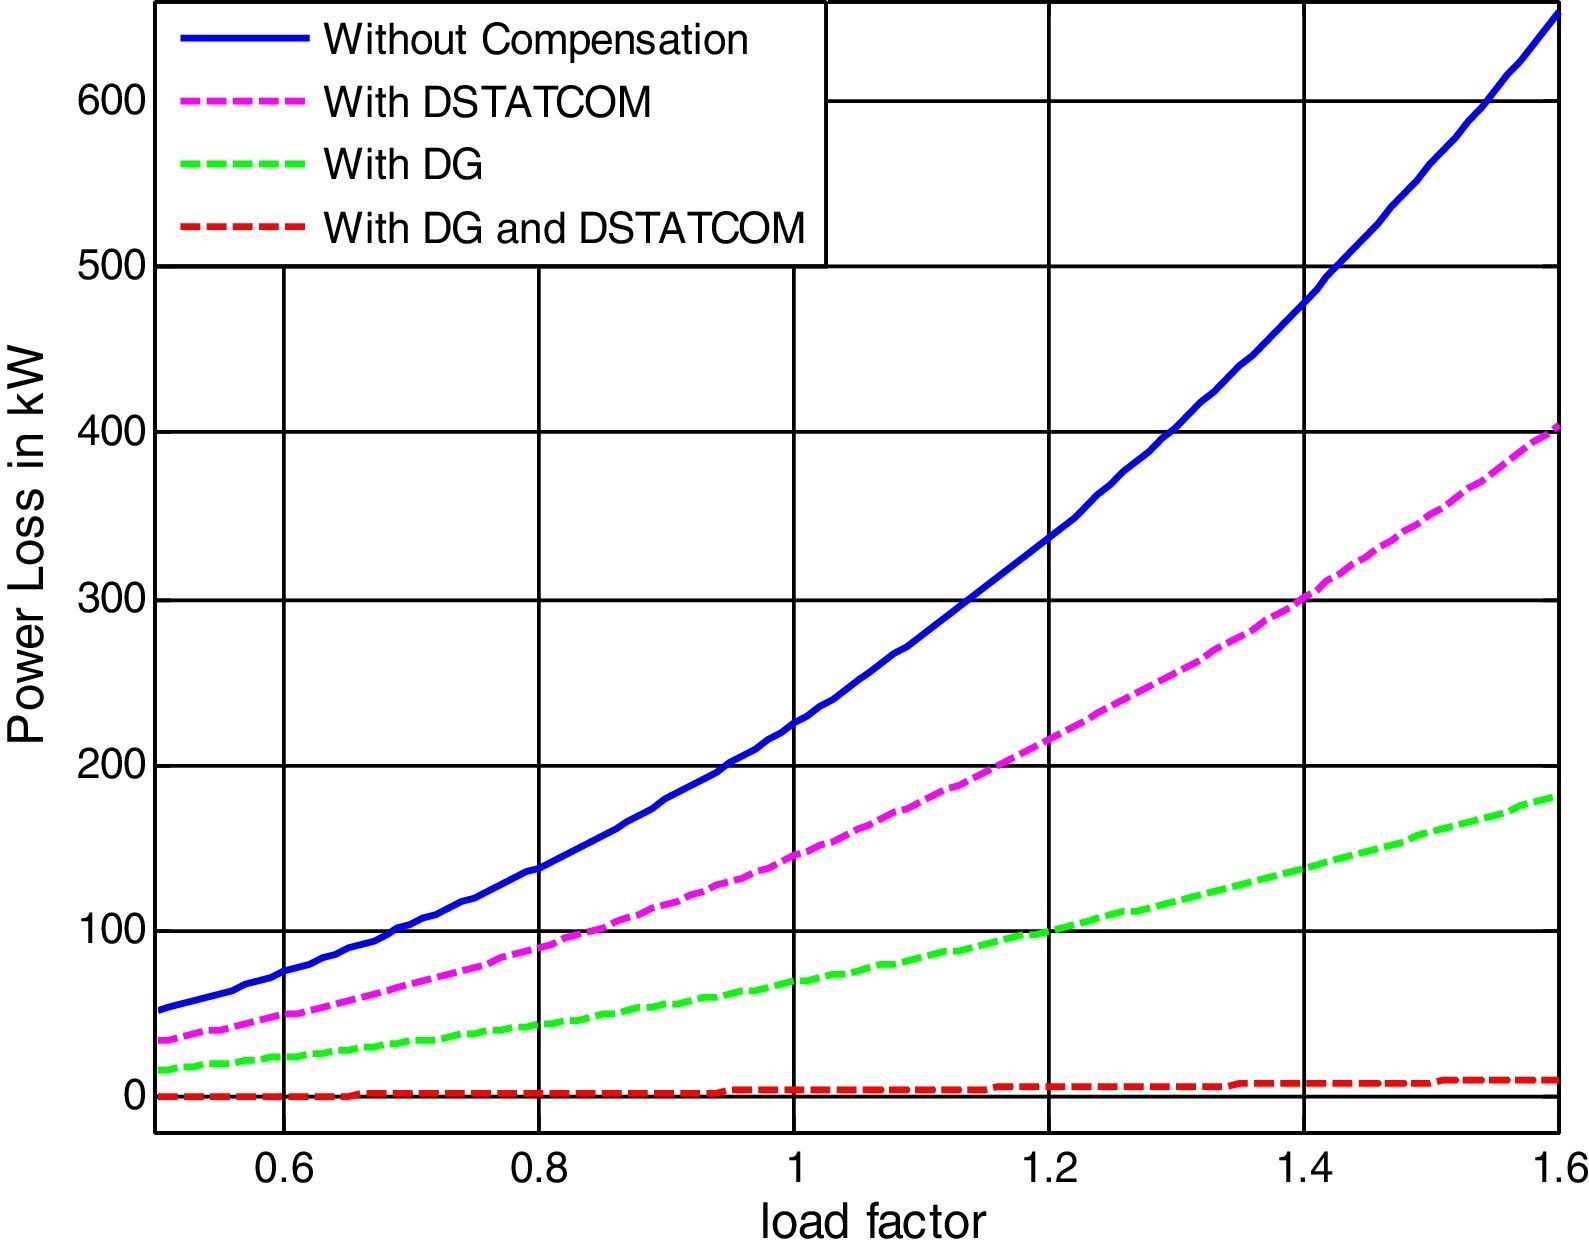
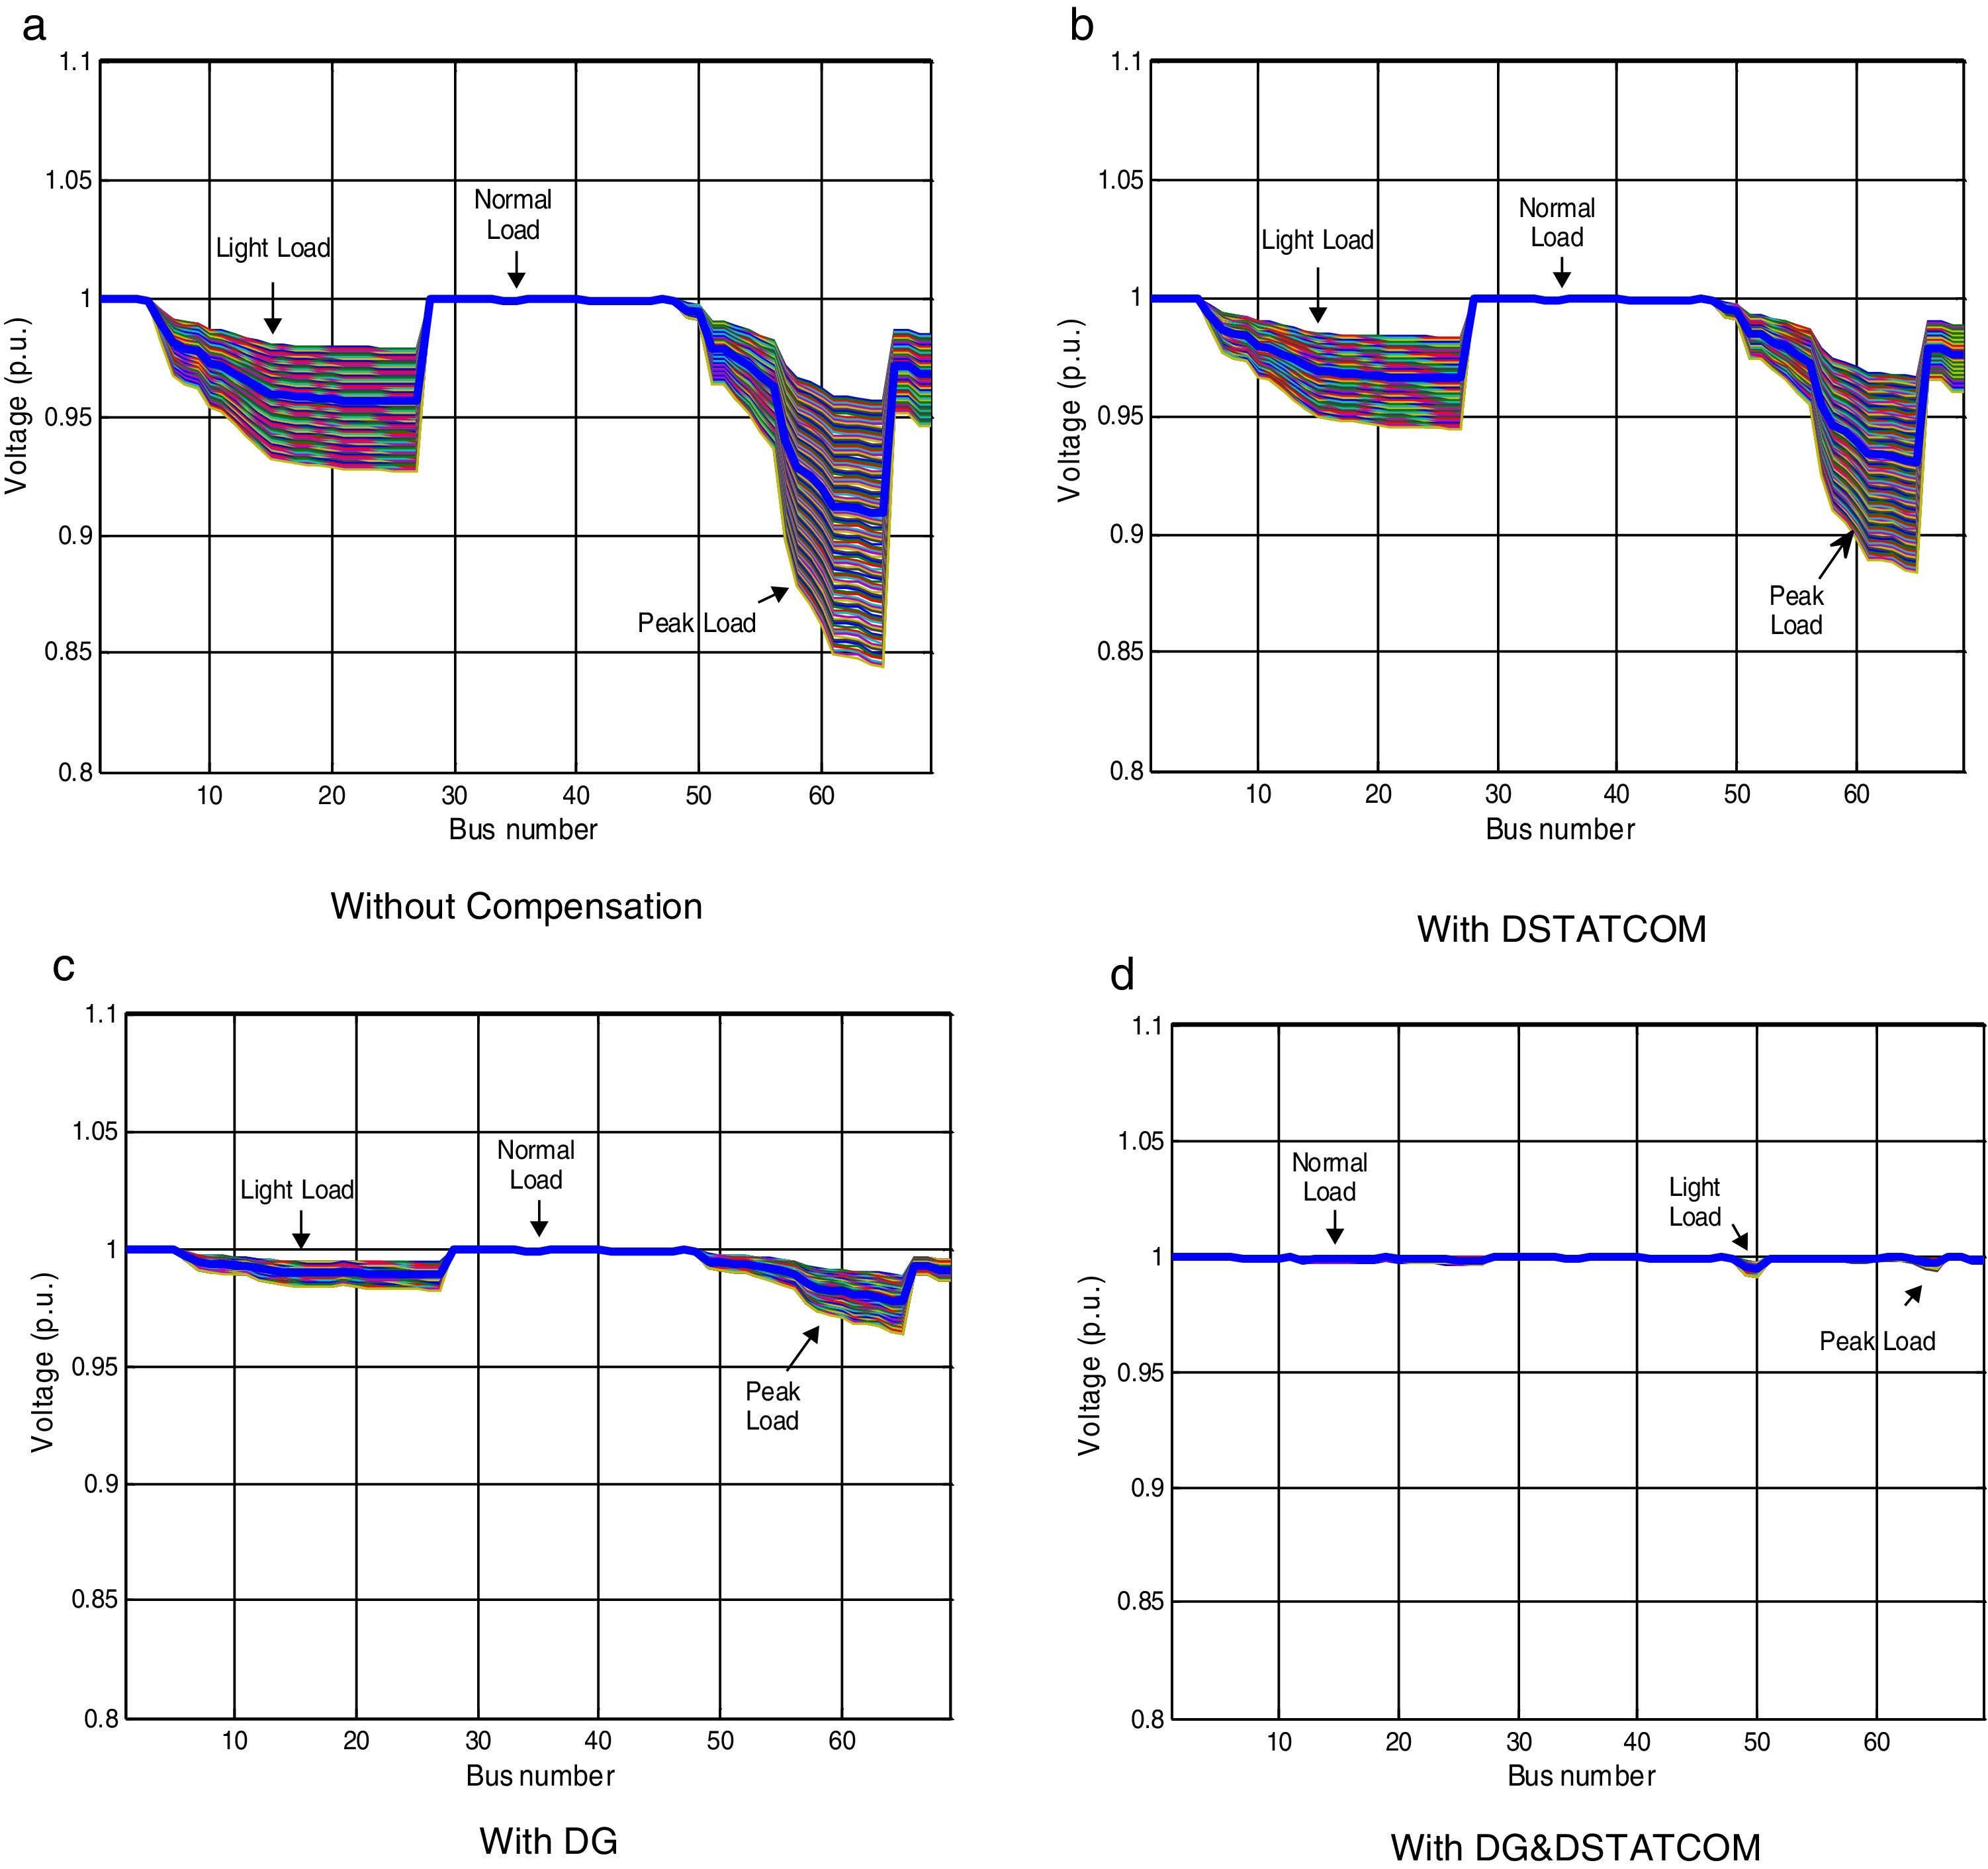
In this case, the DG and DSTATCOM are optimally placed and sized by proposed LSA method. Fig. 11 shows the comparison of active power loss for different cases under different load variations of 69-bus test system. Considering the simultaneouse allocation of DG and DSTATCOM in the distribution network, the objective functions of power losses, TVD, and VSImin are obtained as 4.32kW, 0p.u., and 0.9587p.u., respectively. Compared with the base case (case 1) values (225kW, 0.7327p.u., and 0.6822p.u.), these values represent an improvement of 98.08%, 100%, and 40.5%, respectively, for the mentioned objective functions. Also, in this case the minimum voltage of the system is improved from 0.9090p.u. to 0.9943p.u. The voltage profile of the 69-bus under different loading condition are shown in Fig. 12. By comparing the figures, it can be noted that implementation of DG and DSTATCOM simultaneously in the radial distribution system improves the bus voltages meritoriously.

.")
From the above discussion, it can be noted that the maximum improvement in objective functions is attained when the DG and DSTATCOM are simultaneously optimized (case 4). Optimal solutions obtained in case 4 for objective functions are the most optimal values of all cases.
By the utilization of CFT tool the total active power loss of the 69-bus test system with simultaneous allocation of DG and DSTATCOM in the networks can be framed as following generalized equations
4.2.1Comparative analysis of 69-bus system
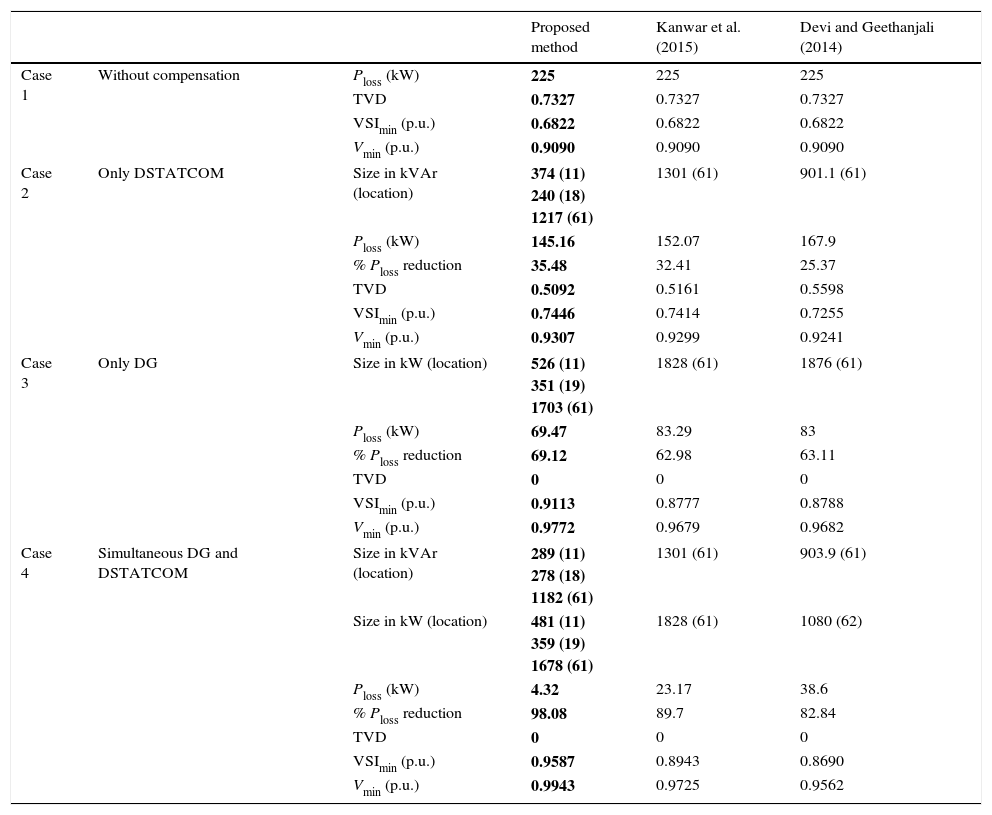
To validate the performance of the proposed LSA approach in 69-bus system, the simulation results are compared with the solutions obtained with the other approaches like ICSO (Kanwar et al., 2015) and PSO (Devi & Geethanjali, 2014) and it is given in Table 2. Table 2 shows a comparison of location and sizing of both DG and DSTATCOM, power loss, percentage of power loss reduction, minimum bus voltage, TVD, minimum VSI values attained by using proposed and other methods. It can be observed from the table that there is a noteworthy reduction of power losses, at all cases considered using proposed methods. The proposed LSA based optimization technique gives better voltage profile improvement compared to other methods which is proved by the values of TVD.
Performance of 69-bus test system.
| Proposed method | Kanwar et al. (2015) | Devi and Geethanjali (2014) | |||
|---|---|---|---|---|---|
| Case 1 | Without compensation | Ploss (kW) | 225 | 225 | 225 |
| TVD | 0.7327 | 0.7327 | 0.7327 | ||
| VSImin (p.u.) | 0.6822 | 0.6822 | 0.6822 | ||
| Vmin (p.u.) | 0.9090 | 0.9090 | 0.9090 | ||
| Case 2 | Only DSTATCOM | Size in kVAr (location) | 374 (11) 240 (18) 1217 (61) | 1301 (61) | 901.1 (61) |
| Ploss (kW) | 145.16 | 152.07 | 167.9 | ||
| % Ploss reduction | 35.48 | 32.41 | 25.37 | ||
| TVD | 0.5092 | 0.5161 | 0.5598 | ||
| VSImin (p.u.) | 0.7446 | 0.7414 | 0.7255 | ||
| Vmin (p.u.) | 0.9307 | 0.9299 | 0.9241 | ||
| Case 3 | Only DG | Size in kW (location) | 526 (11) 351 (19) 1703 (61) | 1828 (61) | 1876 (61) |
| Ploss (kW) | 69.47 | 83.29 | 83 | ||
| % Ploss reduction | 69.12 | 62.98 | 63.11 | ||
| TVD | 0 | 0 | 0 | ||
| VSImin (p.u.) | 0.9113 | 0.8777 | 0.8788 | ||
| Vmin (p.u.) | 0.9772 | 0.9679 | 0.9682 | ||
| Case 4 | Simultaneous DG and DSTATCOM | Size in kVAr (location) | 289 (11) 278 (18) 1182 (61) | 1301 (61) | 903.9 (61) |
| Size in kW (location) | 481 (11) 359 (19) 1678 (61) | 1828 (61) | 1080 (62) | ||
| Ploss (kW) | 4.32 | 23.17 | 38.6 | ||
| % Ploss reduction | 98.08 | 89.7 | 82.84 | ||
| TVD | 0 | 0 | 0 | ||
| VSImin (p.u.) | 0.9587 | 0.8943 | 0.8690 | ||
| Vmin (p.u.) | 0.9943 | 0.9725 | 0.9562 | ||
In addition to that the minimum VSI values have been improved in all cases compared to other methods. It points out that the LSA algorithm spins around the objective function more closely than the other methods. The solution accuracy reveals that the proposed LSA is proved to be one of the efficient nature inspired optimization techniques for solving complex optimization problems. The LSA may be recommended as a capable optimization algorithm tool to solve difficult engineering optimization problems for the upcoming researchers.
5ConclusionThis paper addressed a new methodology to attain the optimal allocation of DG unit and DSTATCOM, in order to reduce losses, enhance voltage profile and improve voltage stability of the distribution system considering load variations. In this concern, a novel nature inspired lightening search algorithm has been proposed and applied. In the proposed method the feeder loads are varied from 0.5 to 1.6 of base load with 0.01 step change. The initial simulation results demonstrate that the locations of the DG and DSTACOM units are always fixes throughout load variations. But, the optimal size of DG and DSTATCOM vary linearly with respect to load variations. A set of generalized equations have been framed to calculate the sizes of both DG and DSTATCOM for each step load variations using curve fitting technique. This equations are very much needed for the DNOs to select the optimal sizes of the DG and DSTATCOM for a particular load change. Two standard IEEE 33- and 69-bus test systems have taken to check the feasibility and effectiveness of the proposed LSA based optimization procedure. The simulation results exhibited that the main target of this work have been greatly achieved with help of LSA. The power loss reduction and voltage stability index have been significantly improved in all load variation scenarios. Further, the voltage profile (which is confirmed by the TVD values) between the buses have been enhanced by the simultaneous allocation of the DG and DSTATCOM in the radial distribution networks. This proposed long-term work can be used effectively in distribution network planning.
Conflict of interestThe authors have no conflicts of interest to declare.
Peer Review under the responsibility of Universidad Nacional Autónoma de México.