


In this study, we have proposed a three-dimensional (3D) model reconstruction system for breast tumors. The proposed system can establish an accurate 3D model of tumors, which will serve as a diagnostic reference for physicians and also address the shortcomings of the traditional breast needle localization method and other localization methods reported in previous studies. This developed system uses multispectral breast magnetic resonance images as input and detects the contour of the tumor in different sections using an active contour method — multispectral gradient vector flow snake (MGVFS) method. Thus, the system constructs a 3D model of only the tumor is contained in a breast surface model and excludes other tissues. Since the accuracy of the reconstructed 3D model depends on the accuracy of the tumor contour detection, for confirming the results obtained with the MGVFS method, we conducted experiments to evaluate its accuracy in contour detection, and compared the results with those traditional contour detection methods. Our results demonstrate that the MGVFS method has the highest accuracy in contour detection, with a correct contour detection rate as high as 99.79%.
In current clinical practice, the size and shape of a tumor is often an important diagnostic reference. Currently, however, the majority of medical imaging instruments only provide two-dimensional (2D) images, although a few expensive instruments can provide three-dimensional (3D) images by stacking the original 2D images, but these 3D images are unprocessed and often cause problems in segregating the target from a mix of complex tissues. In addition, when doctors diagnose breast tumors through screening and need to determine their positions for subsequent surgical treatment, they usually require the assistance of a program called breast needle localization (BNL) (Central Vermont Medical Center, 2015). BNL entails using a positioning wire to puncture the body surface and localizing the tumor in the breast through X-ray photography to guide the surgeon in the surgical operation. BNL is predominantly used clinically in patients, whose breast tumors can be clearly identified using breast X-rays and not through palpation diagnosis. This method of localizing the tumor is simply based on conjectures made using two X-ray images (craniocaudal and mediolateral oblique views), which rely heavily on the experience of the surgeon. Specifically, when there are two or more lesions in the same image, the depth of the surgeon's experience determines whether the localization process goes well. An incorrect guess may cause an increase in the number of punctures, as well as an increase in the number of X-ray images taken (each puncture requires two additional breast X-ray images to verify that the lesion has been pierced). A higher number of images taken implies increased medical costs, greater time spent by the surgeons, and relatively longer X-ray exposure time for the patients.
In our earlier studies, we have developed an automated 3D localization system for breast microcalcification to assist doctors in solving the problem of tumor localization (Chung & Yang, 2001). This system digitizes two X-ray images of the breast (craniocaudal and mediolateral oblique views) and directly imports them, finally generates a 3D localization report through system computations. Since both the craniocaudal and mediolateral oblique views of the images are taken of flattened breasts, minor errors are introduced in the results of this localization system owing to the fact that the breast is compressed. To reduce the errors in lesion localization caused by breast compression, we applied the constant volume principle and corrected the shift caused by compression, as reported in a subsequent article (Yang et al., 2005). This approach effectively reduced the errors in localization. However, since the localization method based on earlier studies only referred to the craniocaudal and mediolateral oblique views taken of compressed breasts, a certain degree of error was unavoidable in the final localization results. Subsequent studies (Montefusco, Lazzaro, Papi, & Guerrini, 2011; Zhang et al., 2013) incorporated magnetic resonance imaging (MRI) or computed tomography (CT) imaging to reconstruct 3D models. Though MRI or CT images are based on natural body posture, which eliminates errors caused by compression, these methods construct 3D models by stacking the original cross-sectional images. Thus, a mix of various internal tissues (e.g., vascular, breast, fat, muscle) is included in the images, creating problems in localizing the specific target- the tumor. In another study (Huang, Chung, Lee, Yang, & Lee, 2006), the augmentation technique was applied to construct 3D breast models from streaming video images. However, this technology can only generate 3D images of the physical contours of the human body, and not of the relative positions of the physical contours and lesions within it.
To create an accurate 3D model of tumors and to thereby provide surgeons with a diagnostic reference, as well as to address the shortcomings of the traditional BNL and other methods from earlier research, this article proposes a 3D model reconstruction approach for breast tumors. This approach primarily uses the proposed multispectral gradient vector flow snake (MGVFS) method to collect images from all sections of the breast MRI to obtain the outlines and to accordingly reconstruct a 3D image perspective of the tumor and breast. This is done through computer graphics technology, using the tumor sections and the breast contour. The breast contour is presented using graphical transparency, with only the tumor inside, excluding other tissues as background noise. Using the auxiliary coordinate system, the direction of the breast tumor and the distance between its center and the nipple can be viewed from different angles.
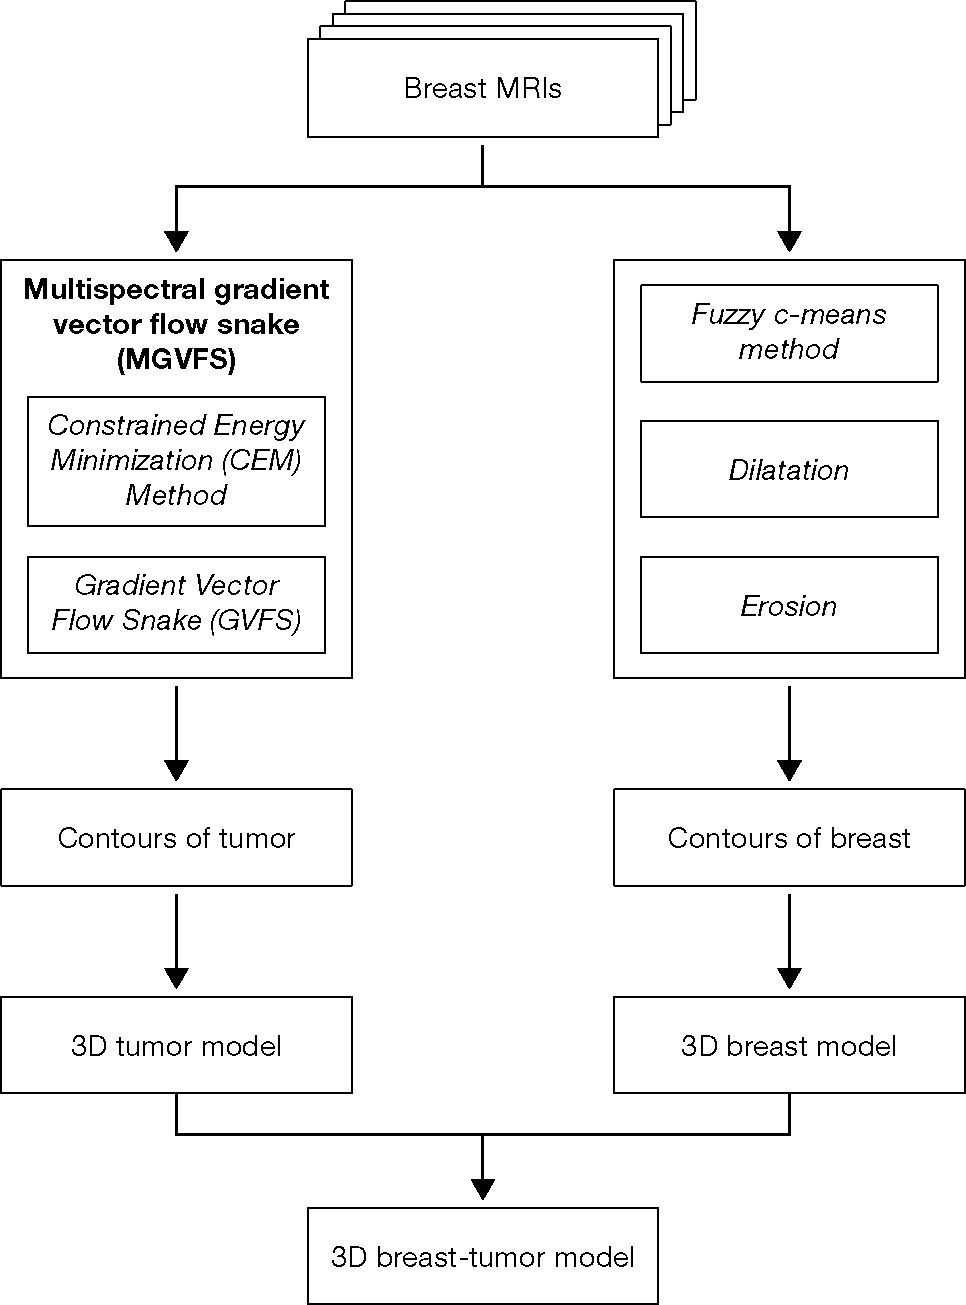
Currently, there are several related studies and methods being proposed regarding image segmentation or contour detection, such as region based segmentation (Haddon & Boyce, 1990), watershed (Beucher, 1991), level set method (LSM) (Jinda-apiraksa et al., 2009), snake (Kass, Witkin, & Terzopoulos, 1988). Some of these methods are based on image gradients, which are liable to lead to false conclusions if the images have imperceptible edges; some methods are based on image intensities, which are susceptible to low noise interference; other methods use only local features, which affect the accuracy of the segmentation or contour results. The MGVFS method proposed by us has two primary advantages: First, we use the multispectral signature detection technology based constrained energy minimization (CEM) to increase the contrast intensity of the breast tumor and to remove background noise and then detect the tumor contour based on the CEM processing results. Compared to single spectral techniques such as Wavelet (Elbaşı, 2012; Mamun, Al-Kadi, & Marufuzzaman, 2013) or Gradient Enhancement, CEM has superior performances and has been confirmed to perform satisfactorily for multispectral target detection and classification (Resmini, Kappus, Aldrich, Harsanyi, & Anderson, 1997; Wang et al., 2003). The second advantage is with respect to contour detection. Since the traditional snake uses a gradient as an external force, it limits the snake's capture range and its ability to converge on recesses in the target. To overcome this shortcoming, we used a gradient vector flow snake (GVFS) to replace the traditional gradient. GVFS acts as an external force to enhance the calculation ranges and to effectively converge on recesses. Compared to earlier methods, the MGVFS method proposed in this study combines these two advantages, and is able to present the contour of the tumor more accurately. The system architecture is shown in Figure 1.
2Methods2.1Constrained Energy Minimization (CEM) Method
We exploited MRI with multispectral features by using CEM algorithms to process the multispectral images, so as to generate images with high background contrast, which would facilitate the subsequent contour detection. The CEM algorithm was derived from the minimum variance distortionless response (MVDR) processed by the sensor array, and it required only the target's information (no background information needed) during its entire processing. The potential of CEM was better showcased when the target and a complex background were present in the same image. First, for the practical application of CEM, we stacked MR images from the same section on different spectrums to form a 3D cube. Then, the set of pixels at the same location on different spectral images could be regarded as a column vector. Hence, CEM used the correlation between the column vectors of each location and of the target for classification. This advantage was not available to other algorithms based on spatial analysis. The actual operations involved in applying CEM to MRI images were as follows.
First we defined L as the spectrum (band) number of the MRI, and therefore, the i-th pixels in each spectral image could be considered an L-dimensional pixel vector, represented by ri = (ri1, ri2,… riL)T, where rij represented the greyscale value of pixel i in band j. We assumed that {r1, r2,… rN} represented the pixels in a MRI image, where N represented the total number of pixels in the image. Let d represented a target feature, which, in fact, was the L-dimensional pixel vector of the target. Next, we designed a linear finite impulse response (FIR) filter, which could be represented as an L-dimensional weight vector, w = (w1, w2,… wL)T. Then, we limited the output of the weight vector w and the target vector d after calculation (e.g., limiting the result of dTw to 1). Next, we determined the optimal w by minimizing the output energy, which was defined as the sum of the outputs of and all pixels, after calculation. We used yi to represent the output of the pixel ri on the MRI image i, using our linear FIR filter. yi can be expressed as follows:
The average output energy of {r1, r2,… rN}, after processing through the FIR filter, is expressed as follows:
where RL×L =1N∑i=lNririT is the MRI sequence autocorrelation sample array. Therefore, the CEM filter is an approach that can be used to solve the following linear constrained optimization equation:

Equation (4), proposed in Farrand and Harsanyi (1997), can be used to solve Equation (3):

Substituting w in Equation (5) of the CEM filter, which is able to complete the detection, with the optimal value determined through Equation (4), a pixel vector, r, can be computed from the following:

As can be seen from Equation (5), when r = d and δCEM (d) = 1, the required constraints for Equation (3) are satisfied. Notably, the value δCEM (r) obtained from Equation (5) represented the abundance fraction of target feature d in pixel r. Therefore, unlike most of the space based classification algorithms that used label (class) assignment techniques, the CEM filter used Equation (5) to assess the content value to detect the desired target. In practice, we set the target as the tumor, and the abundance fraction after CEM operations resulted in high contrast tumor-background images. Next, we required a proper segmentation (snake) method to separate the target (tumor) from the high contrast image, which was executed by the GVFS algorithm.
2.2Gradient Vector Flow Snake (GVFS)The conventional snake is a curve defined in an image domain; its model comprises the sum of the energy of the external and internal forces. The internal force is the energy contained in the curve, and the external force is obtained by calculating the image gradients. Assuming that the snake is a curve, vs=xs,ys,s∈0,1, the energy function, Esnake, is defined as follows:
where the internal force function is defined as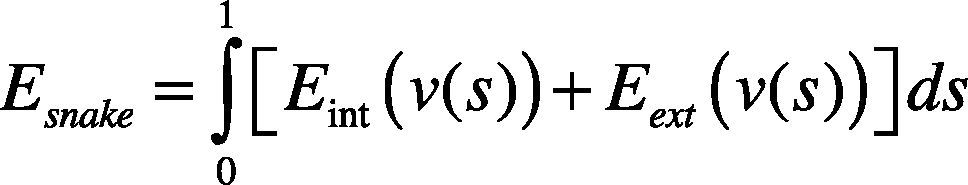

in here the internal force is used to calculate the continuity and smoothness of the curve v(s). The parameters α and β determine the tension and rigidity of the snake, respectively. Because they are used to obtain the elastic energy and bending energy, so they can be interpreted as a continuous force and bending force, respectively. When the α value is large, the snake curve is a straight line; and when the β value is large, the snake is a smooth curve.
In different cases, the external force can be set with different limits, so that the snake can be pushed to the edges or segments of the object. The external force function is defined as follows:
or

where ▿ is the gradient transporter, I(x,y) represents the image, and Gσ (x,y) is the 2D Gaussian filter function defined as follows:
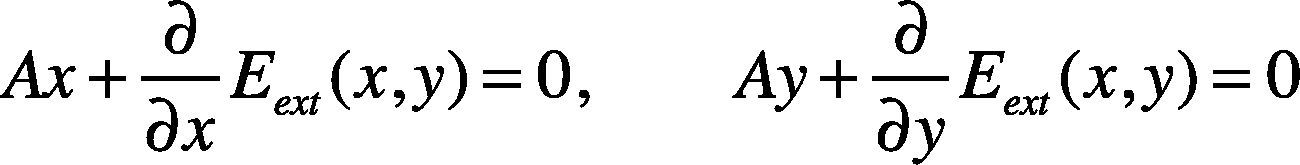
According to the principle of variation, the energy maximization in Equation (6) must satisfy the Euler equation:

The approximate solution of the Euler equation is obtained through the finite difference method. Next, we represent Equation (11) with vectors:
where vi = (xi, yi). When converted to matrix form, it can be represented as follows:
where x=x1,x2,⋯,xnT, y=y1,y2,⋯,ynT, A is a banded matrix of size (n is the number of vertices). Assuming the snake has five vertices, the matrix A can be represented as follows:

To solve the matrix system, we can set a stepping parameter γ on the right side of Equation (13) so that the equation becomes
where the subscript t represents the number of iterations. By obtaining the inverse matrix, Equation (14) becomes

where k is a weight parameter. When the right side of Equation (15) is equal to zero, it means that there are no changes in vertex positions.
The traditional snake has two shortcomings (Davatzikos & Prince, 1995; Xu & Prince, 1997). One is that the initial contour of the snake has to be very close to the target to facilitate its progress towards the target contour. The other is that the traditional snake cannot converge to the recesses on the target. These two shortcomings hinder the application of the traditional snake in several ways. These drawbacks exist primarily owing to the fact that the snake uses the image gradient as an external force. The GVFS proposed by Xu and Prince (1997) addressed the two shortcomings of the traditional snake. GVFS uses gradient vector flow as a new external force function, which allows for the tracking of the initial contour, starting from a location at a distance from the target. Even if the target has a concave shape, this method is still able to converge to the target contour.
In GVFS, a gradient vector flow is defined as Xx,y=ux,y,vx,y, and its minimum energy function is expressed as follows:
where f is the edge of the image,∇fx,y is the gradient of the edge, and μ is the weight parameter. When the value of ∇f is large, the energy value is determined from the second part of Equation (16). In this case, the minimum energy can be obtained by assigning X=∇f. When the value of ∇f is negligible, the energy value is determined from the first part of Equation (16), in which case, a smooth vector field that changes gradually can be generated. In addition, when there is a large amount of noise in the image, the value of μ needs to be increased slightly.
According to the variation principle, the minimization of energy in Equation (16) should satisfy Euler equation:

By substituting Eext in Equation (15) with X(x,y), Equation (15) can be rewritten as follows:

Since CEM produce high contrast breast tumor images, the initial tumor contour for GVFS could be manually set at the periphery of the tumors.
3Experimental results3.1Experimental dataThe experimental images used in this paper are the MRI images obtained from three patients with breast tumors admitted to the Women Healthcare Center at Tri-Service General Hospital. Four parameters were used: T1-FS, PD, T1, and T2. We captured 11 sections containing the tumor (each section had four images with different parameters) during the experiment. Figure 2 shows one section of breast MRI containing tumor with 4 different parameters.
3.2Comparison of single-spectral contour methods, PD (B), T1 (C), and T2 (D).")
First, we conducted contour detection using LSM, snake, and GVFS on the four images of breast MRI sections with different parameters. To evaluate the accuracy of the contour detection, we invited three professionals to sketch the outline of the tumor, and used the intersection area as the standard, as shown in Figure 4A. Table 1 lists the accuracy rate of each of the three methods in depicting the contour of the four single spectral image sections. Table 1 indicates that GVFS showed better accuracy in most sections.
Comparison of the correction rates (CR) of single-spectral MR image contour detection obtained through GVFS, Snake, and LSM methods.
| Section 1 | ||||
|---|---|---|---|---|
| Mathod\spectral | T1-FS | PD | T1 | T2 |
| LSM | 94.50% | 91.44% | 87.77% | 90.74% |
| Snake | 99.27% | 99.35% | 99.36% | 99.36% |
| GVFS | 99.80% | 99.63% | 99.82% | 99.58% |
| Section 2 | ||||
| Mathod\spectral | T1-FS | PD | T1 | T2 |
| LSM | 94.93% | 95.31% | 95.80% | 95.70% |
| Snake | 99.65% | 99.77% | 99.82% | 99.75% |
| GVFS | 99.84% | 99.92% | 99.94% | 99.86% |
| Averaged CRs of 11 sections | ||||
| Mathod\spectral | T1-FS | PD | T1 | T2 |
| LSM | 94.62% | 95.87% | 95.56% | 94.15% |
| Snake | 99.43% | 99.33% | 99.26% | 99.30% |
| GVFS | 99.42% | 99.62% | 99.51% | 99.52% |
In this section, we evaluate the performance of the multispectral contour method. First, we conducted a CEM operation on the four original images seen in Figures 2A-D and produced high contrast breast tumor images, as shown in Figure 3. Then we used the three different breast contour methods —LSM, Snake, and GVFS— to detect the contour of the high contrast breast tumor images generated through CEM (Fig. 3). Figures 4B-D show the results obtained for one of the sections, wherein Figure 4D shows the resulting contour obtained using the MGVFS method. It can be observed that the contour in Figure 4D closely resembles the contour drawn by the professionals. Table 2 lists the average accuracy rates of the three types of multispectral contour methods applied to the 11 sections. It can be observed from Table 2 that the proposed contour method, MGVFS, has a relatively high correction rate, which is higher than any of the single spectrum contour methods.

The high contrast breast tumor image generated through CEM operations using multispectral sections as shown in Figure 2.
. D: contour detection results using the MGVFS method.")
Comparison of the correction rates (CR) of multi-spectral MR image contour detection obtained through MGVFS, MSnake and MLSM methods.
| Section 1 | |
|---|---|
| Method | CR |
| MLSM | 95.46% |
| MSnake | 99.69% |
| MGVFS | 99.95% |
| Section 2 | |
| Method | CR |
| MLSM | 99.57% |
| MSnake | 99.64% |
| MGVFS | 99.95% |
| Averaged CRs of 11 sections | |
| Method | CR |
| MLSM | 98.32% |
| MSnake | 99.63% |
| MGVFS | 99.79% |
A 3D model of the tumor can be developed based on the contour detection results of the tumor sections in MR images using the proposed MGVFS method. Figure 5A shows the tumor contour detection results of partial tumor sections in case 1. Moreover, we show the same sections sketched by professionals as the standard in Figure 5B for comparison. Please note that we transformed tumor contours into binary images here, which would facilitate the subsequent 3D tumor model reconstruction.
 obtained by using MGVFS method (A) sketched by professionals (B).")
Since the area of the breast is distinct from the background, we obtained the breast area using a fuzzy c-means method (FCM) with dilation and erosion. Figure 6 shows the breast area detection results of partial sections in two cases. The combination of breast and tumor area will be used in the subsequent 3D breast-tumor model reconstruction.
4.23D breast-tumor model reconstruction for in two cases obtained by using fuzzy c-means method (FCM) with dilation and erosion.")
2D binary images can be stacked into 3D model via software program. The proposed approach in this paper was coded in MATLAB 2012a version programming languages and implemented on a PC with Intel i7-2600 CPU and 8 GB RAM. Before process, all 2D binary images of a case were saved to a mat file in the order and become a 3D matrix. An example of MATLAB program for constructing a 3D model with coordinates from 2D binary images was shown as follows:
%# get a sample data with 0 for empty, 1 for solid
load breat3D.mat
v = B3; %# 2D binary images saved in a 3D matrix B3 and assign to V
figure
%# visualize the volume
p = patch(isosurface(v,0)); %# create isosurface patch
isonormals(v, p) %# compute and set normals
set(p, ‘FaceColor’,’r’, ‘EdgeColor’,’none’) %# set surface props
daspect([1 2 3]) %# axes aspect ratio
view(3), axis vis3d tight, box on, grid on %# set axes props
camproj perspective %# use perspective projection
camlight, lighting phong, alpha(.5) %# enable light, set transparency
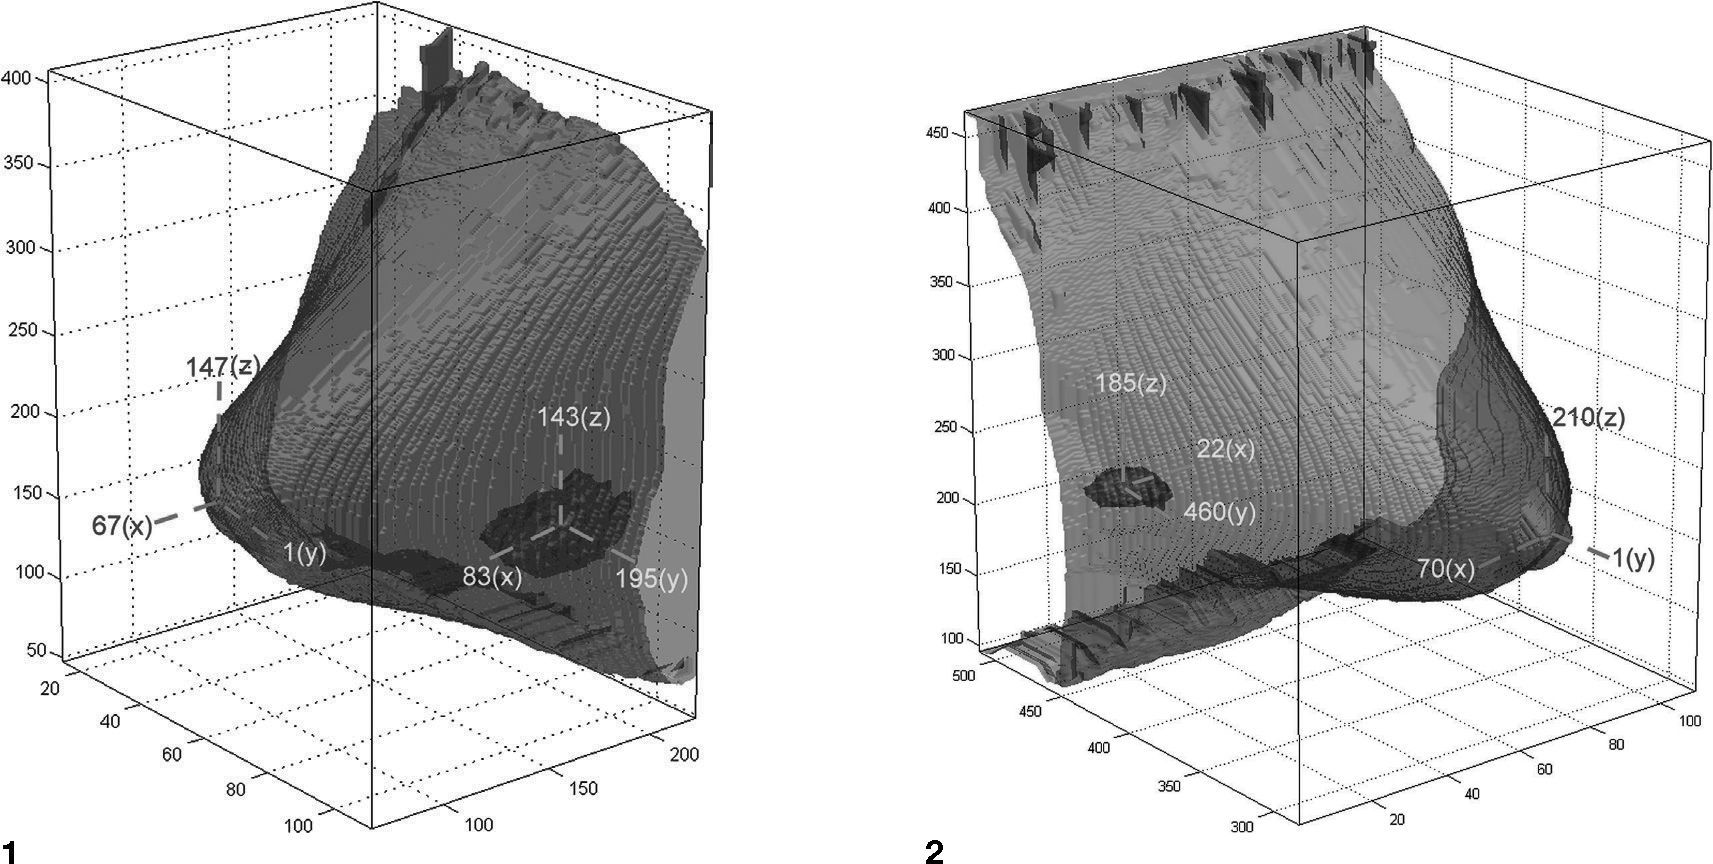
Figure 7 shows a 3D model of a tumor in two cases, and Figure 8 shows a 3D breast model for the same cases. We further integrated the breast contour and the 3D tumor model to created a 3D breast-tumor model, excluding other tissues, as shown in Figure 9. The location of the tumor inside the breast can be observed clearly, since the breast contour in the model is presented with a high degree of transparency. Furthermore, the relative direction and distance between tumor and nipple can be calculated using 3D coordinates, as shown in Figure 10.
5Conclusions


This article proposes a new contour detection method, the MGVFS method, to trace the outline of each section of a breast MRI and to accordingly create a 3D breast-tumor model that will assist doctors in the localization of tumors. This system uses multispectral breast MR images, obtained using a natural breast posture, as input. Next, the system incorporates CEM operations to obtain high contrast tumor background images. Finally, it applies the GVFS contour detection technology, which is based on an active contour model, to the CEM image to depict the tumor contour. Since the accuracy of tumor contour detection is related to the accuracy of the 3D model reconstruction, to confirm the effectiveness of the MGVFS method, we conducted experiments to compare the accuracy rates of the MGVFS method, LSM, and the traditional Snake. As can be observed from the results, MGVFS showed the greatest contour detection accuracy, with a CR as high as 99.79%.
The outcome of this article provides doctors with an accurate 3D breast tumor model, which excludes extraneous tissues. These results not only provide helpful information for diagnoses but also further assist doctors in localizing the tumor accurately and rapidly. It reduces the time required for tumor localization prior to surgery, relieves the pain suffered by patients caused by the traditional localization process using invasive needles, and therefore enhances treatment efficiency.
The work was supported by the National Science Council, Taiwan, under the Grant Nos. NSC101-2221-E-167-036 and NSC 102-2221-E-167-030. The Authors would like to thank Mr. Cheng-Yan Wang for providing his experiences in MATLAB programing of 3D model.