


Cerveceria Nacional’s current distribution network in the Historic Center of Quito is characterized and evaluated from an urban logistics perspective. As a result from the analysis a new distribution scheme was designed using a multi criteria decision making approach applying AHP and several operation research models. Graphs were used to represent the network designs through the modeling process. The proposed network fulfills the municipality restrictions, diminishes route distances and balances daily delivery times.
As urban settings will continue being the nerve center of economic development over the next decades, the associated increase in urban complexity will be a significant challenge to overcome for all city stakeholders. Estimates suggest that, for year 2050, more than 75 % of the population will be concentrated in cities [1]. This trend will imply more complex and intensive dynamics of goods and services across the cities, with associated impacts on traffic congestion, air pollution and business efficiency. Due to several characteristics, this phenomenon is and will be particularly challenging for large and mid-sized urban settings in emerging markets [2].
In Quito, Ecuador, mobility has been continuously reported as the main problem by its inhabitants over the past years. Municipal authorities have designed solutions for public transportation; however, initiatives to improve the urban flow of goods remain scarce. Consequently, goods distribution operations face increasing logistics challenges to reach its retail channel, thousands of small stores spread all over the city.
In this context, this study proposes a redesign of the current distribution scheme for Cerveceria Nacional (CN), one of the largest consumer packaged goods companies in Ecuador. The study will be delimited to CN’s operations in the Historic Center of Quito, as this urban region, due to its commercial and touristic relevance, presents one of the most logistically challenging scenarios for the company.
The study has been structured as follows. First, the urban area of interest is delimited and several commercial, demographic and logistics characteristics are identified, as a basis to define main logistical challenges. Next, three general distribution schemes are developed based upon reviewed case studies. Then, Analytic Hierarchy Process, combined with a non-linear programming model is used to select the most convenient distribution scheme. Based on the selected scheme, the distribution network is reconfigured, at both tactical and operational levels, using linear and non-linear programming models. Finally, a discussion is provided on the limitations of the study and further lines of work.
2Literature Review2.1Transferability MethodologiesMost of the research efforts in urban logistics have been developed by European-based collaborative initiatives such as CIVITAS, TURBLOG, BESTUFS, NICHES and SUGAR. These projects have also developed several transferability methodologies to facilitate transferring urban logistics best practices to other cities. These methodologies are extensively discussed in TURBLOG’s fourth deliverable [3].
CIVITAS [4] developed a 10 step approach that begins with an initial diagnostic of the logistics problems followed by a characterization of the city. Then, the methodology suggests looking around for similar contexts and identifying measures with potential of transferability. Finally, the need of adjustment of the proposed package is analyzed. A different approach is proposed by BESTUFS where knowledge is transferred through the specialized Guide of Good Practices in Urban Logistics. NICHES uses a similar approach, transferring knowledge through a set of twelve innovative concepts [3].
In spite of the several structured approaches described before, to characterize the logistics structure of cities, these schemes have been generally tailor made with scarce potential of applying them on a global basis [7], which consequently limits the possibility to compare different cities and benchmark urban logistics solutions.
2.2City CharacterizationMacario developed a framework to find homogeneous logistic zones within a city based on three aspects: City Characterization, Agents needs and Product characteristics. Each aspect is defined by several criteria with specific possible values [8]. A logistic profile is then obtained in terms of the values assigned to each criterion [8]. A simpler approach is proposed by CIVITAS were cities are differenced using only two criteria, traffic density and transportation modality [4].
A more holistic framework is used by Wang and Shang in a Case Study in the Metropolitan Region of Beijing. Authors use performance variables to evaluate the progress toward success of city municipal measures [5]. The city current status is analyzed under two perspectives, urban development and transportation network performance. The former relates to topics such as life quality, economic growth and social development whereas the latter analyzes the reliability, efficiency, safety and operation of the transport network [5]. A set of indicators are used to describe each of the perspectives. Al the end, an indicator matrix is obtained and the current situation of the city could be thus characterized.
Transport analysis suggests a more complex modeling approach to characterize a city. This classic modeling work was applied in the City of Mexico in order to analyze its urban rail transport network [6]. Based on several important economic and demographic indicators, patterns of trips were used to model the city’s demand and supply of transport [6]. An OD network was thus obtained. These networks allow one to identify the demographic growing zones, the need of transportation and the resources needed to improve the network as a whole. The scope and validity of the analysis require exhaustive amounts of data though.
Finally, an urban transport study in India suggested a different methodology to characterize cities. This methodology considers 6 factors: shape and size of the city, public transportation availability, congestion, city economic level and geographic location [9].
2.3Relevant Urban Logistics Best PracticesCase Studies concerning distribution in restricted areas with touristic importance are revised. BESTUFS proposes a set of four objectives and its corresponding solutions to improve the access of vehicles to Urban Areas. The solution based on proximity delivery areas (defined as a space on street destined to the load and unload of goods on adjacent commercial sites) is of particular interest as the investment required for its implementation is relatively low compared with other infrastructure related solutions [10].
Urban consolidation centers constitute one of the solutions with higher impact in the urban logistics problematic. Aside from the benefits in transportation efficiency and improved delivery operations, Urban Consolidation Centers give companies the opportunity of adding value in the last mile delivery [10]. Nevertheless, the investment required is high and collaboration between private and public parties is generally needed.
TURBLOG presents several case studies in Urban Logistics too. Through a pilot Night Delivery program in New York, transit reduction in regular transit hours was achieved as well as significant improvement in delivery times and costs. In Paris, Chronopost built an underground logistic facility in the Center of Paris that worked as a hub. Total delivery distance was reduced in 75% with the use of the mentioned hub [11].
In the Historic Center of Lucca, an European Commission funded project designed a distribution scheme with the purpose of improving distribution operations and reducing carbon emissions in this landmark. The scheme was composed by a virtual distribution center coordinating with several warehouses and deposits around the area and delivering through electric vehicles [12]. The operations were all coordinated from the virtual DC.
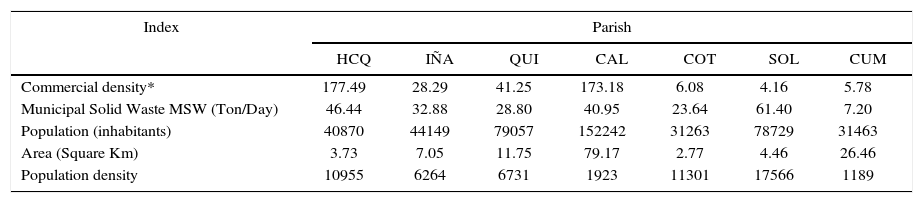
3City context, scope definition and problem description3.1Logistic Characterization of the Historic Center of QuitoCommercial importance. The HCQ is one of the biggest colonial centers in Latin America and has played a critical role in the city’s economic development since its foundation in 1534. A characterization study based on 2010 Ecuadorian Census Bureau’s figures [13] places the HCQ as one of the parishes with highest population density in the Metropolitan District of Quito (MDQ), as shown in Table 1.
Characterization for the seven most important parishes in de MDQ.
| Index | Parish | ||||||
|---|---|---|---|---|---|---|---|
| HCQ | IÑA | QUI | CAL | COT | SOL | CUM | |
| Commercial density* | 177.49 | 28.29 | 41.25 | 173.18 | 6.08 | 4.16 | 5.78 |
| Municipal Solid Waste MSW (Ton/Day) | 46.44 | 32.88 | 28.80 | 40.95 | 23.64 | 61.40 | 7.20 |
| Population (inhabitants) | 40870 | 44149 | 79057 | 152242 | 31263 | 78729 | 31463 |
| Area (Square Km) | 3.73 | 7.05 | 11.75 | 79.17 | 2.77 | 4.46 | 26.46 |
| Population density | 10955 | 6264 | 6731 | 1923 | 11301 | 17566 | 1189 |
Moreover, the HCQ’s commercial dynamic is high; there are at least 10 important logistic nodes within the area including 8 Malls, and 2 wholesale/ retail markets. HCQ’s commercial density of 178 establishments per square kilometer is the highest in the MDQ. This significant commercial activity is also reflected in the MSW daily average, the third largest in Quito.
Vehicle circulation. In 2010, approximately 3300 cars per hour circulated in HCQ with average speeds of 10Km/h during peak hours and 30Km/h during non-rush hours. Due to car population increments over the years, these figures have probably worsened.
3.2Logistics InfrastructureThere are only six designated loading/unloading zones in the HCQ, which most of the time are being used for other purposes. No other useful logistics infrastructure is available.
3.3Public PolicyOrdinance No. 147, established in 2005, imposes circulation restrictions during day hours for medium load vehicles and total restriction for heavy load vehicles. There is strong control in the area due to its touristic importance.
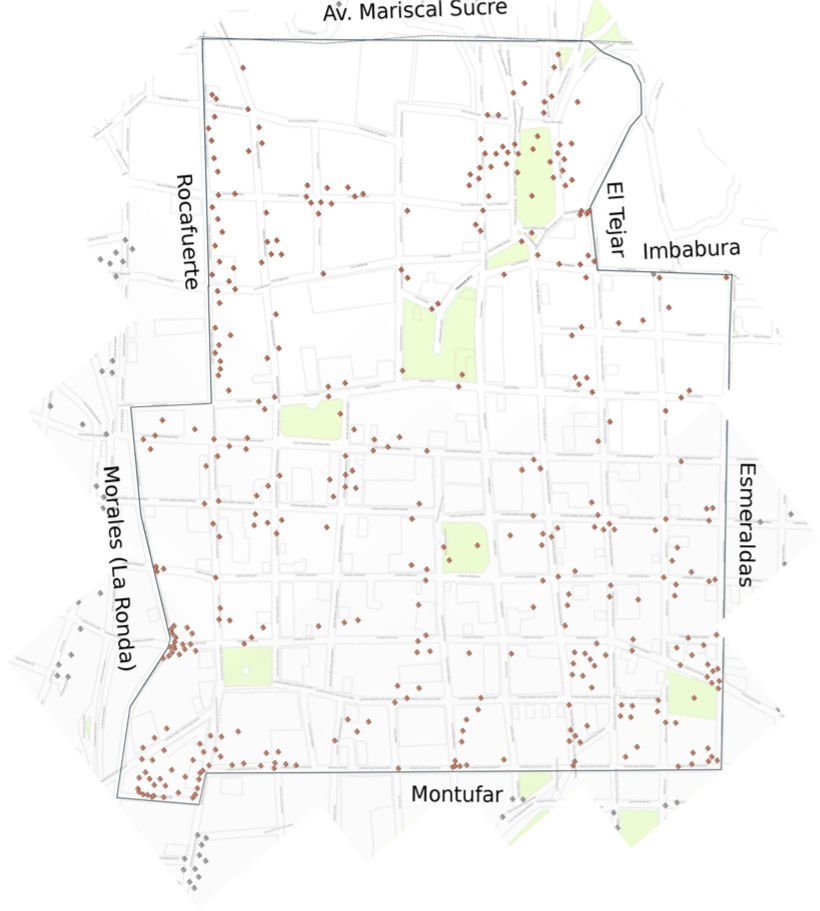
3.4HCQ’s area definition for the studyFour criteria were established in order to define the specific area of study within the HCQ: (1) Conflictive zones in terms of transit, maneuver difficulty, lack of parking places and presence of control agents. (2) Limits defined by the 147 ordinance, (3) Impact on city’s touristic heritage and (4) CN’s clients location. The defined perimeter is depicted in Figure 1. The region has a total area of 1.69Km2 which covers 45% of the total HCQ area.
3.5Brief descripion of Dinadec’s logistics operation at the HCQ
CN customer network in the HCQ perimeter defined in the section above, is composed by 376 customers or delivery points, all of them served by the DC located in Cumbayá, 25Km away from the HCQ. According to CN’s 2012 sales data, 76.3% of those customers have a Drop Size lower or equal to 8 boxes per week; nevertheless, orders can be greater than 20 boxes per week. A truck in a typical route visits from 65 to 150 clients per day and multiple clients may be served at the same stop. Finally, 8 to 10 TON trucks are currently being used.
In 2012, 70% of the rejected orders had two main causes: Store closed during visit time (43%) and customers without cash at time of visit (27%).
3.6Problem DefinitionDue to all the logistics challenges that HCQ presents for distribution operations, including traffic congestion, circulation restrictions, difficult maneuverability and unavailable parking zones, CN is interested in redesigning its current distribution operation for achieving higher levels of efficiency and effectiveness and reducing its impact on other HCQ stakeholders.
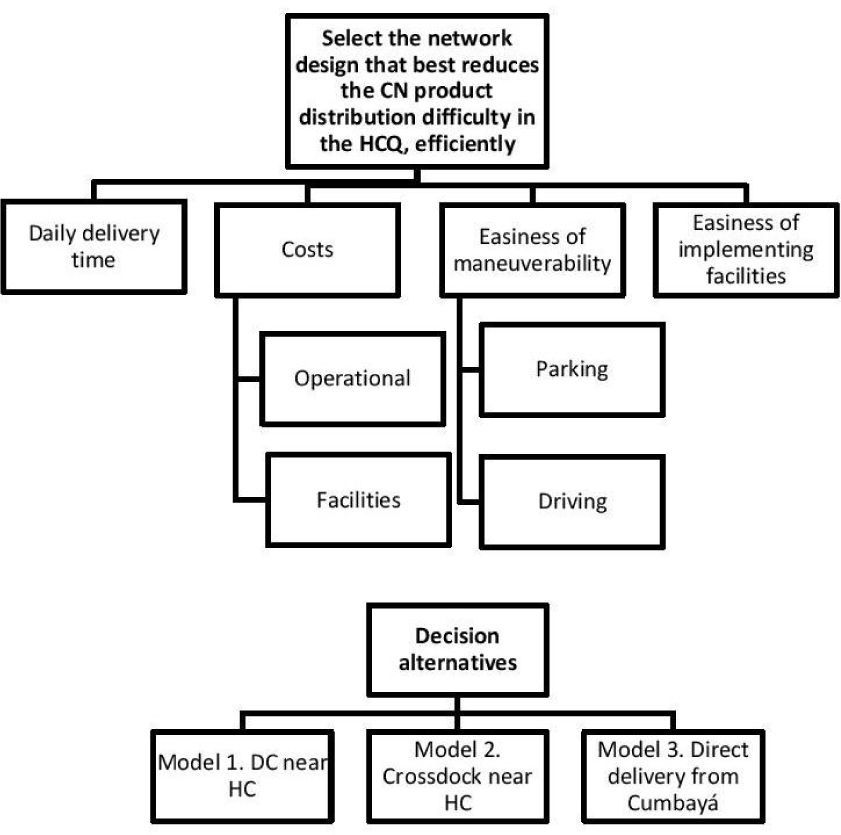
4Modeling approach and results4.1Distribution Network DefinitionNetwork alternatives. Three new network designs were developed based on the current HCQ distribution scheme, current distribution practices in the HCQ and reviewed case studies. The designs included (1) a Distribution Center near the HCQ combined with lower capacity vehicles; (2) crossdock operations near the HCQ with restricted replenishment and (3) the current direct delivery network with lower capacity (6 TON) vehicles.
Analysis. Several conflictive criteria needed to be taken into account in order to choose the best network design. Using AHP, a decision hierarchy was outlined in order to consider all the conflictive criteria. The hierarchy is shown in Figure 2.

Several pairwise comparison matrixes were computed in order to determine the level of priority of each criteria and subcriteria. Then, each alternative needed to be compared according to each criteria and subcriteria.
It is important to note that time delivery and cost criteria were required to be measured quantitatively. Therefore, a non-linear programming model was proposed to select the fleet size that minimized the total operational cost considering the “worst case” for each network design. The model considered replenishment costs, delivery costs/Km and crew wages. For the remaining criteria (easiness of maneuverability and easiness of implementing facilities) pairwise comparisons were used to describe the qualitative differences for each model.
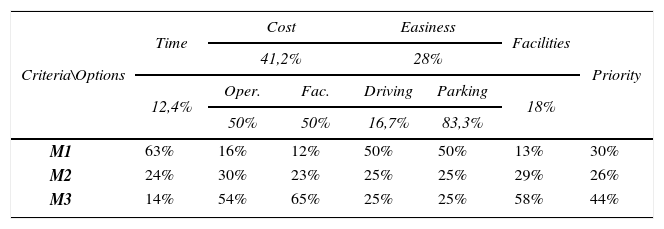
Results. The model showed that the current network design with a single 6 TON truck delivering in the HCQ was twice cost effective than any of the other 2 proposed designs but required a delivery time twice as large. The final decision matrix resuming all the comparisons is shown in Table II. Thus, the current direct network using 6 TON was kept as the best network design alternative.
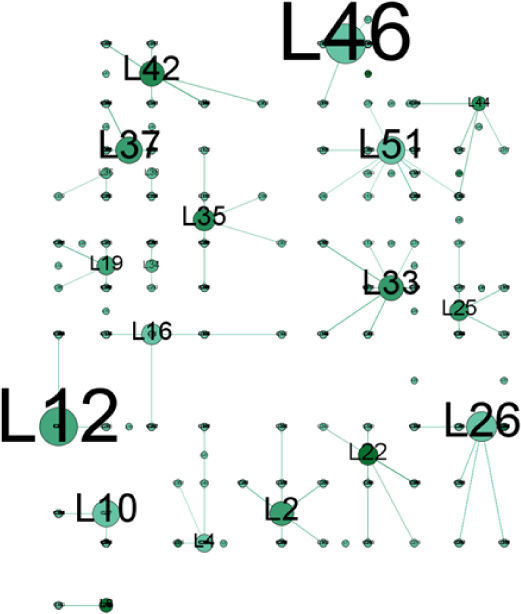
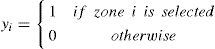
4.2Structural Redesign: Improvement Based on Loading / Unloading ZonesA reconfiguration plan based on loading-unloading zones was then proposed for the current network. A set of 56 candidate zones in the HCQ were identified. Candidate zones were defined as sidewalks were trucks have enough space to park (i.e. width larger than 1.5m). It is important to know that under current circumstances, CN’s trucks use to park either over the sidewalk or on a street lane, affecting both pedestrian and vehicle circulation, so establishing load and unload zones could be suitable in the current conditions. From those 56 candidates, only 20 would be chosen due to financial constraints.
To select the most convenient 20 loading/unloading zones that minimize the distance between the zone and the set of customers to be served, an LP model with 21112 variables was proposed. The variables were organized in this way: 56 of them were decision variables on whether choosing a candidate zone or not, and the remaining 21056 variables decided if the customer is assigned to a specific zone.
Provided with the fact that the street structure of the HCQ is a gridline, it was more accurate to use the taxicab geometry in order to get a more realistic estimation of the displacements. Therefore, Manhattan (Taxican) distances between clients and zones were computed, resulting in a From-To Distance matrix. The proposed model was defined as follows:
Let: i=1,2,3,…,I be the candidate load / unload zones; j=1,2,3,…,J the customers or delivery points. We define:
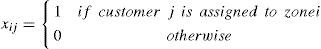
For i=1,2,…,I; j=1,2,…J
For i=1,2,…,I; j=1,2,…J
Let: N ne the number of routes to be created; M a large positive number, and dij the distance between zones j and i.
The model intends to:
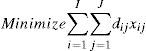
Subject to:


The resulting network with the 20 candidate zones chosen is shown in Figure 3.
4.3Tactical Redesign: Route Planning
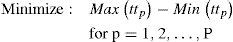
A nonlinear model was suggested to assign each of the 20 selected zones to a specific route. The goal was to balance the expected daily delivery time, restricted to capacity and geometrical constraints. The geometrical constraints imposed that each route had to cover unique territories. Visually this was imposed by creating the smallest polygon that covered all the nodes assigned to a route. Routes for completing delivery in 5 and 6 days were built. The model was defined as follows:
Let:
p=1,2,…,P be the delivery routes to be created.
q=1,2,…,Q the load and unload zones to be assigned to delivery routes
tq the total delivery time to customers in the load/unload zone q
vq the volume assigned to zone k
ttp the total delivery time of route p.

Vp the total volume assigned to route p
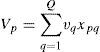
VMAX is the maximum volume capacity of the delivery vehicles (trucks)
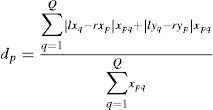
dp Average distance between nodes assigned to route p and the geometrical center of that route. Let rxp y be ryp the coordinates of the geometrical center of the route p and lxq and lyq the coordinates of the load and unload zone q then:
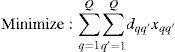
The model intends to:
Subject to:
Capacity constraint

Overlap constraint. Let βp be the smallest Polygon that covers all the deliver zones (nodes) assigned to route p under the taxicab geometry. The constraint imposes that

Maximum distance between nodes constraint.

The route assignment model described above was solved using a graphical heuristic method. The heuristic required is described as follows:
- 1.
Build an initial solution relaxing the capacity constraint. To do so, 5 and 6 sets of zones are configured (depending on the number of delivery days available). A pivot zone is selected in each group. An assignment model is solved in order to minimize the total distance between each of the other nodes and the pivot. Each set of zones is a delivery route. An LP assignation model is used:
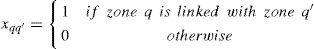
Let: q=1,2,3,…,Q be the load and unload zones to be assigned to routes. Also, q’=1,2,3,…,Q are the same load and unload zones to be assigned to routes. We define:
for q=1,2,…,Q; q’=1,2,…,Q;
for q=1,2,…,Q
Let: N be the number of routes to be created, M a large positive number, and dqq’the distance between zones q and q’.
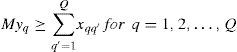
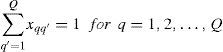
The model intends to:
Subject to the following constraints:
This model links nodes in N branches. Each of them will constitute the initial routes satisfying the overlap constraint. It is important to note that this assignation model is the same model used to select the 20 best load/unload zones defined before.
- 2.
If the initial solution doesn’t satisfy the capacity constraint, move nodes from the zone with overcapacity to adjacent zones.
- 3.
Then, define hp = ttp − ttmin p=1,2,…,P. Where ttmin = min{tt1, tt2, ..., ttP} and let R* be the route with highest hp and make h* = max{h1, h2,...,hP}
- 4.
Choose a node q in R* that satisfies tq ≤ h*. If none of the nodes satisfies this relationship go to step 5, else, select node q and continue. Choose a route adjacent to R* and add node q to the route. Verify that all the constraints are still satisfied after the node is added to this route. If any of the constraints aren’t satisfied, remove the node, choose another one and verify constraints. If none of the nodes could satisfy constraints, go to step 5. If the chosen node satisfied all constraints go to step 5.
- 5.
Let R* be the next route with higher hp. If h*=0 then the best solution had already been found, otherwise, select R* and go to step 4.


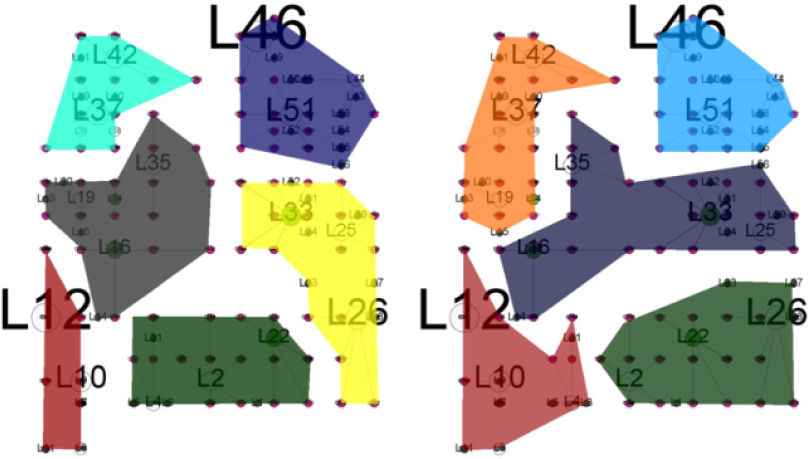
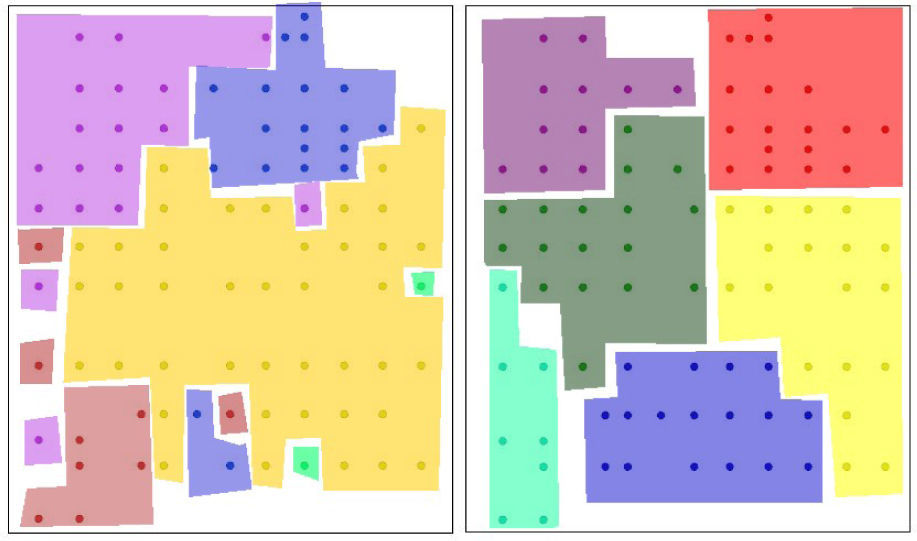
The procedure described above derived five and six days master route that satisfied all the mentioned constraints. These master routes didn’t include a specific delivery sequence, but defined the set of zones needed to be served in each route. Figure 4 shows the final routes and the territories they occupy.
4.4Operational Redesign:Delivery Procedures
Once routes were created, they were assigned specific week days for delivery. The assignment was made minimizing the number of clients that needed to change their current delivery day.
To minimize the expected daily route time, three measures were proposed. First, an additional operator would work in the operation; his task would be pre-confirming the order deliver with the customer, assuring the place was open, and the customer has cash to complete the order payment. The second measure considered using mobile technology to enable communication between the delivery team. Finally, 10 boxes hand trolleys are proposed to be used for delivery efficiency reminding that the current average drop size of CN in the HCQ is 8 boxes.
4.5Additional ConsiderationsThe proposed solution is sensible to the location and drop size of customers. This means that data needs to be revised and updated in order to maintain the solution effectiveness. The solution proposal considers a private public agreements for developing the load/unload zones, that will certainly benefit other logistics operators in HCQ.
The new five and six delivery routes designed under the selected distribution scheme are equally distributed in the HCQ area. The resulting territories are independent. Moreover territories are smaller than current ones so the daily delivery distance is expected to decrease significantly. The comparison between current and proposed routes is shown in Figure 5.
5Conclusions and further work5.1Main Findings and proposed (right) master routes compared. Each node represent a delivery point (several customers might be located at the same node).")
A preliminary logistic description of the HCQ was provided in terms of its demographic, infrastructure, legal and commercial characteristics. Furthermore, the study could precisely delimit the geographical area of study to be considered within the HCQ based on municipal definitions, touristic locations and street configuration. The defined polygon constitutes a comprehensive representation of the major challenges faced by distribution operators in Quito.
AHP was fundamental in the selection of the structural basis on which the whole solution was built. The final decision was robust and reliable given that all of the conflictive criteria were used. Furthermore, several optimization mathematical models were used to feed up the decision matrices.
The taxicab geometry was used as the measurement method for network and route design. Two major benefits were derived from the use of this geometry, first, delivery points and load/unload locations could be accurately found. Second, taxicab geometry took advantage of the grid structure of the HCQ so the displacement estimation between nodes estimated by the taxicab distance was close to reality.
5.2Study Limitations and Further WorkEven though the study intends to reduce the CN distribution problems in the defined polygon, it doesn’t analyze the impact of the plan in the neighboring routes. It would be important to consider those routes in order to implement the plan effectively. One of the benefits of the proposed plan is the significant reduction of the carbon dioxide emissions compared with the actual scheme, due do travel distance reduction. Nevertheless, this value has not been quantified. Quantifying the carbon footprint could be an important argument to export this scheme as a good practice in urban logistics.
The master route determination is sensitive to the average delivery volume. Therefore it is recommended to track the customers drop size periodically in order to update the routes when significant changes are detected. This decision needs to be revised annually given that several implications in superior and inferior instances of the supply chain are derived from the master routes.
The study selected 20 out of 56 zones, based upon the arbitrary premise that it would be feasible for the DMQ municipality to establish only 20 of those zones; however, the optimal quantity should be further explored. In this context, further information from other relevant consumer products distributors will be required. Additionally, the study could be also expanded to include constraints such as time windows and street directionality.
The study scope was defined to complete two of the four subsystem steps that constitute the whole management process [15]. Planning, which let us understand the problem itself and stating a desired future scenario; and Decision Making which included the whole set of models to select a set of optimal strategic, tactical and operational actions to accomplish that desired scenario. However there are two subsystem steps that need to be taken in order to finish the project, these are Execution and Information Support [15]. These steps could be considered in further research and case studies.
This project was executed under the generous sponsorship of Universidad San Francisco de Quito’s Chancellor Grants program. The authors greatly acknowledge the contributions of Santiago Torres, Distribution Manager at CN and his team, special thanks given to Paola Calvache, member of the CN support team for the project.