


This paper reports the stability of Ti-5Al-5Mo-5V-3Cr and similar Mo equivalent alloys using first principles calculations. The lattice constant and modulus values are calculated using X-ray diffraction and ultrasonic techniques, respectively. All the four alloys display negative values of formation energy per atom and the alloy Ti-5Al-5Mo-5V-3Cr is most stable among these. The lattice constant, modulus and hardness values of these alloys lie in low (Ti-5Al-5Mo-5V-3Cr, Ti-5Al-5Mo-8.6V-1.5Cr) and high (Ti-5Al-3.5Mo-7.2V-3Cr, Ti-5Al-3.5Mo-5V-3.94Cr) regimes. All the alloys display ductile behavior based on shear and bulk modulus ratios.
The development of β titanium alloys have been focussed in aerospace industries during last two decades due to their attractive properties such as high strength, fracture toughness, fatigue properties, deep hardenability and reasonable ductility (Boyer & Briggs, 2005; Fanning, Nyakana, Patterson, & McDaniel, 2007; Ghosh, Sivaprasad, Bhattacharjee, & Kar, 2013; Jones, Dashwood, Jackson, & Dye, 2009b; Shekhar, Sarkar, Kar, & Bhattacharjee, 2015). These alloys can be classified as metastable and stable β alloys. The α phase can be retained in former alloys in different heat treated conditions. As a result, a variety of microstructures can be produced with different combinations of solution treatment and aging. These are in turn useful to tailor the mechanical properties. For example, fine distribution of α precipitates particularly in metastable β titanium alloys provides high strength due to large number of α/β phase boundaries. These boundaries act as dislocation barriers (Collings, 1984; Dehghan-Manshadi & Dippenaar, 2011; Duerig & Williams, 1983; Jones, Dashwood, Jackson, & Dye, 2009a).
The metastable β titanium Ti-5Al-5Mo-5V-3Cr (Ti-5553) (wt.%) alloy has been developed recently to replace the alloy Ti-10V-2Fe-3Al (Ti-1023) in some of the structural components of the aircraft. The microstructure, texture and mechanical properties of the alloy Ti-5553 and similar Mo equivalent (8.15) (Weiss & Semiatin, 1998) have been investigated in detail in hot rolled condition (Manda, Chakkingal, & Singh, 2014; Manda, Ghosal, Chakkingal, & Singh, 2015; Manda, Chakkingal, & Singh, 2016). The Mo equivalent is defined as the sum of the weighted averages of the elements (wt.%) present in alloy (Weiss & Semiatin, 1998). This is given as

Present work is mainly focussed on the relative stability of β phase in these alloys using first principles calculations. The equilibrium lattice constant values have been compared with the lattice constant values calculated from X-ray diffraction (XRD) data. The elastic constants of these alloys are also evaluated using conventional ultrasonic method.
2Experimental detailsThe details of the melting procedure of four experimental alloys with nominal compositions Ti-5Al-5Mo-5V-3Cr, Ti-5Al-3.5Mo-7.2V-3Cr, Ti-5Al-5Mo-8.6V-1.5Cr and Ti-5Al-3.5Mo-5V-3.94Cr designated as A1, A2, A3 and A4, respectively are given elsewhere (Manda et al., 2015). The chemical composition of alloy A1 is same as the Ti-5553, while the other three alloys (A2, A3 and A4) were selected by keeping Mo equivalent constant (8.15) with different combinations of Mo, V and Cr. The analyzed chemical compositions of all four alloys are given in Table 1. The as-cast alloys were solution treated in β phase field and subsequently water quenched (β WQ). The densities of all the alloys have been measured using Archimedes principle. The β WQ samples for microscopy were prepared following standard metallographic techniques used for titanium and its alloys and etched with modified Kroll's reagent [94ml H2O, 4ml HNO3 and 2ml HF]. The microstructures of β WQ samples were examined using optical and scanning electron microscopes (OM and SEM). The corresponding XRD patterns were recorded using a Philips PW3020 diffractometer equipped with a graphite monochrometer operated at 40kV and 25mA. Transmission electron microscopy (TEM) samples were prepared using standard techniques and TEM was performed using a FEI TECNAI G2 microscope. The elastic constants were measured by using ultrasonic longitudinal and transverse wave velocities. Ultrasonic velocities were measured using a 200MHz pulser receiver (Olympus NDT Panametrics PR 5900) with a 10MHz transducer for longitudinal and 5MHz transducer for the transverse wave velocities. The signal was digitized at 1Gs/s rate using an analog to digital converter card. Five measurements were made for each sample and average values are reported. Vicker's hardness number (VHN) values were measured using the AFFRI hardness tester (model: VRSD 270).
Chemical composition of the experimental alloys.
| Alloy designation | Nominal composition (wt.%) | Analyzed composition (wt.%) | Interstitial elements (wt.%) | |||||||||
|---|---|---|---|---|---|---|---|---|---|---|---|---|
| Al | Mo | V | Cr | Al | Mo | V | Cr | C | O | N | H | |
| A1 | 5.0 | 5.0 | 5.0 | 3.0 | 5.17 | 4.96 | 4.85 | 2.98 | 0.021 | 0.10 | 0.007 | 0.016 |
| A2 | 5.0 | 3.5 | 7.2 | 3.0 | 5.10 | 3.30 | 7.30 | 3.20 | 0.075 | 0.04 | 0.017 | 0.012 |
| A3 | 5.0 | 5.0 | 8.6 | 1.5 | 5.25 | 4.52 | 8.75 | 1.50 | 0.025 | 0.12 | 0.005 | 0.005 |
| A4 | 5.0 | 3.5 | 5.0 | 3.9 | 5.41 | 3.18 | 5.25 | 4.16 | 0.035 | 0.13 | 0.005 | 0.005 |
In present study, the ABINIT software having first principles norm conserving pseudo potential method in the frame work of the density functional theory (DFT) has been utilized (Gonze et al., 2002, 2009; Hohenberg & Kohn, 1964; Kohn & Sham, 1965). Exchange-correlation effects have been treated within generalized gradient approximation (GGA) using Perdew–Burke–Ernzerhof formulation (Perdew, Burke, & Ernzerhof, 1996). For all the alloys, convergence with respect to the plane wave cut-off energy has been verified and accordingly plane wave cut-off energy of 40Ry has been used. Subsequently, conversions of wave functions between real and reciprocal lattices have been carried out using fast Fourier transform algorithm (Goedecker, 1997). Accordingly, conjugate gradient algorithm (Gonze, 1996; Payne, Teter, Allan, Arias, & Joannopoulos, 1992) has been employed within the frame work of self-consistency. The integration over the Brillouin zone (BZ) has been done with the Monkhorst–Pack scheme (Monkhorst & Pack, 1976). The convergence with respect to k-points has been checked for all the alloys and the optimum value used for the present calculations is 6×6×6. The periodic boundary conditions (PBCs) have been considered along 〈100〉, 〈010〉 and 〈001〉 crystallographic directions. The structural optimizations of all the three phases for obtaining the minimum energies have been performed by relaxing the lattice constants. Convergence in present calculation has been obtained when the differences between energies and forces in two consecutive steps are less than 1.36×10⁻⁴meV and 0.36eV/Å, respectively.
The number of atoms considered for β phase of the alloy Ti-5553 (A1) in present calculation is 128. Both the formation energy per atom and the lattice constants have been computed and given in Table 2. The formation energy per atom has been defined as
where ETi-5553 is the total system energy of Ti-5553 alloy having u Ti, v Al, x Mo, y V and z Cr atoms, ETig, EAlg, EMog, EVg and ECrg are the total energy per atom in their ground states for Ti, Al, Mo, V and Cr atoms, respectively and (u+v+x+y+z) denotes the total number of atoms considered in the unit cell. Eq. (2) is written for the alloy A1 and can be suitably modified for other three alloys (A2, A3 and A4) depending upon their chemical compositions.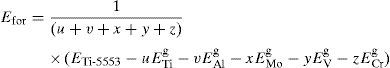
Equilibrium lattice constants and formation energy per atom for all the four alloys A1, A2, A3 and A4.
| Alloy designation | Density (g/cc) | Lattice constants (Å) | Formation energy per atom (eV) | |
|---|---|---|---|---|
| Experimental | First principles calculation | |||
| A1 | 4.635 | 3.2357 | 3.1949 | −0.0018 |
| A2 | 4.645 | 3.2493 | 3.1973 | −0.0016 |
| A3 | 4.659 | 3.2366 | 3.1966 | −0.0017 |
| A4 | 4.587 | 3.2445 | 3.1967 | −0.0015 |
The densities of all the four alloys measured by Archimedes principle are given in Table 2. These are highest and lowest for the alloys A3 and A4, respectively. The highest value of the density for alloy A3 can be attributed to presence of 5wt.% Mo and 8.6wt.% Cr. It is to be noted that the densities of Mo and Cr are 10.2 and 7.2g/cc, respectively. The lowest value of density of the alloy A4 on the other hand can be attributed to low wt.% of Mo (3.5) along with Cr (3.94).
The optical microstructures of all the four alloys in βWQ condition are shown in Figure 1. This clearly exhibits the presence of single phase. This has been confirmed by back scattered electron (BSE) image of these alloys. A representative BSE microstructure of the alloy A1 along with the selected area electron diffraction (SAED) obtained by TEM is given in Figure 2. The SAED patterns of all four alloys exhibit the presence of single β phase. The XRD patterns (Fig. 3) of these alloys also confirm the presence of single β phase in βWQ condition. The crystallographic details of the β phase are given in Table 3. The lattice constant ‘a’ of these alloys has been calculated from corresponding XRD patterns using Celn method and given in Table 2.
 A1, (b) A2, (c) A3 and (d) A4.")
![β WQ specimen of the alloy A1: (a) BSE-SEM and (b) SAED pattern showing [110]β zone axis.](https://static.elsevier.es/multimedia/16656423/0000001500000001/v2_201704300035/S1665642317300020/v2_201704300035/en/main.assets/gr2.jpeg?xkr=ue/ImdikoIMrsJoerZ+w997EogCnBdOOD93cPFbanNcX6PcOHo8VDqRKrp6xHZ/NlPxKUvo805ICrHlplwxcm7hYIESfjCCTNDlVokL+8rMJQ+n8OvUOy6XvC/jSR1CxOYDNBMtxjUsT6ODxgfiAx9kbLSHDdKfCDXw9guSGAHULL7cEqXTk/1ibQv+LY343BDgwHU9z3l4FlCHhqU85Rm8fjMmS4pBpH/kYYwZ7yijipxgQckJMgjcXdKqitRlOqlhf7loz/7820ZRdvz3xabu5vaGgj6s+Kkt3EqQiYq3ZPk4gcsvybqBF89IkjpLVmbwGn4ncEvv/GRnXOs7aiA== "β WQ specimen of the alloy A1: (a) BSE-SEM and (b) SAED pattern showing [110]β zone axis.")
 A1, (b) A2, (c) A3 and (d) A4 in β WQ condition.")
Crystallographic data for present experimental alloys.
| Disordered: cubic | |||||
| Im3¯m or Oh9;2 atoms per unit cell | |||||
| cI2 | |||||
| Atomic positions: | |||||
| Atoms | Wyckoff notation | Symmetry | x | y | z |
| Ti/Al/Mo/V/Cr | 2(a) | m3¯m | 0 | 0 | 0 |
| The sum of the addition of probabilities of the Ti (PTi), Al (PAl), Mo (PMo), V (PV) and Cr (PCr) atoms on 2(a) sites is 1. | |||||
The lattice constant ‘a’ values of all the alloys are smaller than the distinctive β titanium (3.283Å, from JCPDS: 89-4913) (Levinger, 1953). The lattice constant values of alloys A1 and A2 are comparatively lower than those of the A2 and A4. This can be ascribed to the presence of alloying elements of these alloys having smaller atomic radii compared to pure titanium (1.47Å). The atomic radii of the other alloying elements are Al (1.43Å), Mo (1.39Å), V (1.34Å) and Cr (1.28Å) (Takeuchi & Inoue, 2005). The wt.% of alloying elements and corresponding sizes of the atoms also explain the variation in lattice constant values.
The SAED patterns of all the four alloys show streaks. A representative SAED pattern of the alloy A1 is shown in Figure 2b. These points toward the instability of microstructures in βWQ condition due to presence of a very fine distribution of athermal ω phase. It is to be noted that this phase cannot be detected by XRD and SEM due to small volume fraction and very small size (2–5nm). This is quite common in βWQ metastable β titanium alloys and fine precipitation of ω phase occurs irrespective of the cooling rate from the corresponding β phase field (Nag, 2008).
The formation energy per atom values of all the alloys obtained by first principles calculation and corresponding lattice constants are given in Table 2. These values lie in the similar range to those reported for β titanium alloys (Dai, Wu, Song, & Yang, 2012). All the alloys display low negative values of formation energy per atom and the increasing order is A1, A3, A2 and A4. This clearly indicates that all the alloys are energetically stable and the alloy A1 is most stable among all the alloys. The order of formation energy per atom values observed in present study is not surprising since alloys A1 and A3 contain maximum Mo content. It is important to mention here that the Mo is the strong β stabilizer among all the β stabilizing elements.
The equilibrium lattice constant values of all the four alloys are obtained from formation energy per atom vs a curves (Table 2). These values are lower than those obtained by XRD patterns of the βWQ samples. This can be attributed to the state of βWQ samples which have been water quenched from 900°C to room temperature. Therefore, these values represent the lattice parameter values at 900°C while equilibrium lattice constant values obtained by first principles calculations at 0K (−273°C).
These alloys contain five elements which require very large unit cell to compute modulus values. This also needs a large computation time. Consequently, the modulus and Poisson's ratio values of these alloys were computed using ultrasonic longitudinal and transverse wave velocities using the following equations.
where E, ρ, VT, VL and ν are Young's modulus, density, transverse ultrasonic wave velocity, longitudinal ultrasonic wave velocity and Poisson's ratio, respectively. Eqs. (3) and (4) have been used to calculate Young's modulus and Poisson's ratio and given in Table 4. The values of Poisson's ratio obtained in present study are close to other metastable β titanium alloys (Gerday, 2009).

Young's modulus (E), Poisson's ratio, bulk modulus (B), shear modulus (G), G/B and Vickers hardness number (VHN) at 10kg load for all the four alloys A1, A2, A3 and A4.
| Alloy designation | E (GPa) | υ | B (GPa) | G (GPa) | G/B | Vickers hardness number (VHN) at 10kg load |
|---|---|---|---|---|---|---|
| A1 | 110±5 | 0.285 | 85 | 43 | 0.506 | 298±2.5 |
| A2 | 126±5 | 0.270 | 91 | 50 | 0.516 | 317±2.0 |
| A3 | 115±5 | 0.280 | 87 | 45 | 0.517 | 293±4.0 |
| A4 | 125±5 | 0.275 | 93 | 49 | 0.516 | 304±2.5 |
It appears that the modulus values lie in two regimes, i.e. lower (A1, A3) and higher (A2, A4). The Poisson's ratios on the other hand display opposite trend to those of modulus values. The ratio of shear and bulk modulus values can be utilized to predict the brittle and ductile behavior of materials (Pugh, 1954). The ratio G/B (shear/bulk modulus)>0.57 is associated with brittle otherwise related with ductile behavior. The G/B ratios of the present alloys are less than 0.57 and indicate that these alloys are ductile. Premkumar et al. have recently investigated the mechanical behavior of these alloys in hot rolled condition and observed that these alloys display reasonable ductility (Manda et al., 2016). These results are in good agreement with the calculated G/B ratios in the present study. On the other hand, the values of Poisson's ratios obtained in present study are less than 0.33 which reflect that these alloys are brittle (Frantsevich, Voronov, Bokuta, & Frantsevich, 1983). The values of Poisson's ratio of these alloys lie in the range of metallic materials. Therefore, the nature of bonding force between atoms is metallic. The opposite trend obtained by G/B and Poisson's ratios can therefore be attributed to metastable condition of the alloys.
The VHN values surprisingly also follows similar trend to those of modulus values and lies in lower and higher regimes. The hardness values of alloys A2 and A4 (measured at 10kg load) are higher than those of A1 and A3. It is to be noted that the lattice constants of these alloys also lies in two regimes i.e. lower (A1, A3) and higher (A2, A4 regimes). The high hardness of alloy A2 can be attributed to solid solution effect of alloying elements (Mo, V and Cr) on the single β phase. The solid solution effect is more predominant in A2 exhibiting both higher lattice constants and the higher VHN values. The variation in bulk modulus values of the present alloys is small due to small variation in lattice constants. In addition, the measurement of bulk modulus has been carried out in β WQ condition which is in metastable condition. Therefore, a correlation among lattice constants, hardness and bulk modulus values is rather inappropriate. However, it appears that the presence of solute atoms has same effect on modulus, VHN and lattice constant values.
5Conclusions- 1.
All the four alloys (Ti-5Al-5Mo-5V-3Cr, Ti-5Al-3.5Mo-7.2V-3Cr, Ti-5Al-5Mo-8.6V-1.5Cr and Ti-5Al-3.5Mo-5V-3.94Cr) display negative values of formation energy per atom and the alloy Ti-5Al-5Mo-5V-3Cr is most stable among these.
- 2.
The lattice constant, modulus and hardness values of these alloys lie in lower (Ti-5Al-5Mo-5V-3Cr, Ti-5Al-5Mo-8.6V-1.5Cr) and higher (Ti-5Al-3.5Mo-7.2V-3Cr, Ti-5Al-3.5Mo-5V-3.94Cr) regimes.
- 3.
All the alloys display ductile behavior based on shear and bulk modulus ratios.
The authors have no conflicts of interest to declare.
The authors wish to acknowledge Defence Research and Development Organization for financial support. We are grateful to Dr. Samir V. Kamat, Director, Defence Metallurgical Research Laboratory for his kind encouragement. Director ANURAG, Hyderabad and Shri A. Mondal are gratefully acknowledged for the provision of computational facilities and Dr. R. Sankarasubramanian for his kind support. Authors also thank Electron Microscopy, Titanium Alloy Groups of DMRL.
Peer Review under the responsibility of Universidad Nacional Autónoma de México.