


Edited by: Abbas Mardari
More infoIn recent decades, digital technologies have seriously changed socioeconomic systems on a global scale. Unfortunately, consequential issues have remained mostly uninvestigated. The literature lacks research into the risks that may arise in the procedure of developing digital capabilities that have considerable impacts on firms’ innovative growth. In addition, inadequate research has been conducted on challenges that may arise when a business is being developed in the context of the digital economy. Moreover, the advent of new risks specific to the digital economy has not been addressed in the overall system of modern economic relations. As a result, the current study aims to investigate the major areas of relevance to transforming companies into the digital economy, considering the impacts of new risks encountered during such transitions. Along this line, this paper develops a decision support model for evaluating risks in the digital economy transformation of the manufacturing industry. This approach is applied to compute the weights and the study ranks the most important risks for digital economy transformation in the manufacturing industry. In addition, the proposed method model is implemented to find industries’ priorities of different risks for the digital economy transformation of the manufacturing industry. Finally, a case study is carried out to assess the most important risk for the digital transformation of the manufacturing industry. The results show that lack of top management involvement (f7), with a weight of 0.0563, an unstable market environment in terms of the uncertainty industry, and market volatility, with a weight of 0.0542, are the most considerable risks for the digital economy transformation (DET) of the manufacturing industry. Additionally, comparison and sensitivity analyses are made to illustrate the advantage of the presented approach.
Recently, the digital economy has been a focal point for the academic community, particularly owing to the given estimates of double-digit annual growth worldwide, especially in countries belonging to the Global South (Ma et al., 2022; Pan et al., 2022). The key factors driving such emergence are mainly political and economic; however, they are also rooted in technological innovations (Ding et al., 2022; Höflinger et al., 2018). First, the internet emerged in the 1990s and then became a foundation for economic changes that, in turn, led to the digital economy. Then, in two decades, from 2000 to 2020, a series of innovative information and communication technologies (ICTs) derived economic change (Kijek & Kijek, 2019). During these years, connected sensors were embedded into an increasing number of objects, novel digital and end-user devices emerged, data usage grew due to the rapid spread of data analytics, big data, and algorithmic decision-making, and novel automation technologies appeared on a global scale (Bukht & Heeks, 2017).
The global growth of the internet and ICT has caused the manufacturing industry to be infused with digital information technology (Skare & Riberio Soriano, 2021). Digitalization has seriously affected the market, corporate communications, and manufacturing conditions and has forced firms to constantly change to survive the tense competition in the market (Schiffer et al., 2018). Therefore, the manufacturing industry worldwide is undertaking a phase of strategic digital changes. “Since the late 1950s, digital technologies (DTLs) have been used to facilitate strategic and operational changes across different sectors around the world” (Li, 2020). Consequently, companies are being increasingly engaged in an unstable digital economy because of the nonstop growth of technology, the exhaustive utilization of the internet and mobile communications, and the rapid advent of novel DTs, e.g., the Internet of Things (IoT), 5G, artificial intelligence (AI), big data, distributed ledger technologies, and the multicloud environment (Li, 2020). Within such a context, digital transformation (DT) is defined as “the modern-day fight to survive the existential threat of digital disruption” (Li, 2020). As a result, to remain competitive within a context immersed in a volatile digital economy, companies require a certain degree of DT. Thus, companies are attempting to incorporate ICT with novel operational technologies, and DT means the constant implementation and integration of information, communication, and operational technologies for regularly updating, building, and incorporating digital capabilities supporting strategic and operational transformation to create novel competitive advantages within a digital economy setting (Romero et al., 2019)
The DT has encouraged further research on transhumanism; this way, it has affected some relevant fields, e.g., cybersecurity and sustainability. One of the transhumanism theories (Bostrom, 2003; Huxley, 1968) maintains that robotics and digital technologies are pushing humankind towards the advanced level of hybrid coexistence with technology and “singularity” (Kurzweil, 2005). In addition, these technologies are closely related to the metaverse or cyberspace as a type of digital universe. It still seems to be a distant future; however, some novel innovations, e.g., neurotechnologies, show that some changes have already occurred, which could result in a “global mindset change” (Benedikter et al., 2010). From a critical viewpoint, it can be said that the features of the transhumanist movement direct us towards an overall belief in the improvement of biomedical and technology and the existence of enthusiasm for future progress with the support of technological inventions (McNamee & Edwards, 2006). A new area of interest in the academic community is whether such phenomena have resulted only from technological change or also from cultural/social transformation (Petrie & Wessely, 2002), which has led to some conceptual developments representing an integrative or inclusive approach (Dominici, 2018). Briefly, DTLs applications have grown without integrating the challenges, such as the social vulnerability of these technologies; therefore, there is still a need to integrate the current risk and disaster conceptual procedures with theoretical developments of DT.
DT is the process of transforming business activities to completely use the opportunities induced by DTLs (Demirkan et al., 2016). In this process, novel DTLs are utilized to improve core business processes, for instance, improving customers’ experience, increasing the efficiency of the operation using automation, or creating new business prospects (Horlacher et al., 2016). Several DTLs, for example, robots, smart equipment, sophisticated software, and embedded devices, are increasingly playing more dominant and transformative roles for companies (Brynjolfsson & McAfee, 2014). The progress of the digital revolution of cyber-physical systems has created many new opportunities for both large companies and entrepreneurs. According to Accenture and Oxford Economics, novel digital technologies could add US$1.36 trillion to the global economic output by 2020 (Demirkan et al., 2016).
Recently, the global economy has been developing in a DT, dubbed Industry 4.0, during which the trends of the widespread introduction of information technologies are planned and implemented (Bril et al., 2017). DT helps companies regulate their operations so that they can completely capitalize on the benefits of digital changes. In recent years, a large number of international companies and even governments have attempted to develop strategic foresight research into the influences of DT (Ebert & Duarte, 2018). For example, companies have progressively comprehended the significance of data, and business analytics applications are becoming regular business practices (Baykasoğlu & Gölcük, 2019). Companies establish their long-run policies by taking into consideration the DTs expected to make a revolution in their industries.
The rapid development of information technologies leads to serious structural changes in established business processes in various industries (Kozlov et al., 2017), which requires the development of DT technologies for risk management (RM) in the industrial area. There are several past scholars who describe the development results of digital transformation technologies for risk management (Ballestar et al., 2021; Masuda et al., 2017; Menzefricke et al., 2021; Romero et al., 2019; Skare & Riberio Soriano, 2021). However, risks exist pervasively in the real world, and their probability is particularly high when there are rapid changes to markets and technologies. Because of using and updating the new generation of ICTs as well as collecting and organizing users’ big data, the risks in the DT context will grow (Liu, 2022). In addition, in spite of the recent high eagerness of enterprises for the adoption of DT, they have been reported to be successful in this process in less than 30% of cases (Silberg & Manyika, 2019). Therefore, it can be said that DT in the manufacturing sector is not easily adopted; rather, it is a process loaded with different risks. The DT-related risks and security research are closely related to developments in other domains such as mobile devices, the internet, Industry 4.0, artificial intelligence, IoT, and robotics (de Bem Machado et al., 2022; Ogie et al., 2018). DT in healthcare systems is investigated by considering how the patient-doctor interactions might change because of online meetings or health parameters monitoring by wearable devices (Aşuroğlu et al., 2018; Fernández-Caramés & Fraga-Lamas, 2018).
The literature still lacks enough research into how human beings or social groups’ behavior will appear to the technical and organizational prospects and definite ethical queries, which have been analyzed enough. For example, many studies have been carried out on novel applications of brain implants to find how to restore eyesight or mobility after paralysis; nevertheless, this body of research has little connection with the issues of human and social vulnerability issues key issue in relation to disaster risks. Digitalization supported by progressive technology comprises many risks. The more serious problem is that the manufacturing sector has adapted to the production-oriented model of development and, on the other hand, lacks adequate experience in DT. This has made this sector bound to meet any new problems and risks in this new industrial transformation. A few studies have addressed the risks induced by DT, but few have discussed the risks brought by DT to the manufacturing industry. Therefore, this study conducted a comprehensive survey using the current literature review to identify the most important risk for DT in the manufacturing industry.
This study introduces a novel decision support model and uses it to take the efficiency and flexibility of Pythagorean fuzzy sets (PFSs). Accordingly, a novel decision support model was designed to evaluate digital economy transformation in the manufacturing industry. In this way, the novel decision support model is implemented to find the weight of different risks for digital economy transformation in the manufacturing industry. Then this approach is an elegant approach to handling multi-criteria decision-making (MCDM) problems. Further, the presented model is implemented to evaluate the most important risks for digital economy transformation in the manufacturing industry. The key contributions of the presented work are discussed as
- ■
To conduct a survey method with current literature review and expert interviews to recognize the most important risk for digital economy transformation in the manufacturing industry.
- ■
To develop a comprehensive framework using a survey approach to investigate the most important risks for digital economy transformation in the manufacturing industry.
- ■
To introduce an integrated decision-making model, the developed framework to evaluate the most important risks for digital economy transformation in the manufacturing industry.
- ■
To propose the novel decision support model to rank the industries and analyze and assess the most important risk for digital economy transformation in the manufacturing industry.
- ■
The novel decision support model evaluates and ranks the most important risks for digital transformation in the manufacturing industry. To present the sensitivity and comparison analyses for the validation of the integrated decision support approach.
The rest of the paper is provided based on the following sections. Section 2 presents the literature review and related works on the most important risk for digital economy transformation in the manufacturing industry with applications. Next, section 3 provides the presented decision support model. Then, Section 4 presents the results obtained from the case study, sensitivity analysis, and comparative study. Finally, Section 5 concludes the whole study.
Literature reviewDigital economy transformationOnly advanced technology can drive the efficient progress of commodity markets from the perspective of the digital economy (Litvinenko, 2020). The creation of a procedure of technological development on the basis of the doctrines of cognition could be an effective approach. The IoT paradigm is susceptible and adaptable to novel principles and architectures in different science and technology regions (Liu et al., 2017). For the movement from a physical to a digital economy, different types of physical goods and services are required to be replaced by electronic information. All tangible assets need to be changed to digital data that could be regarded as key assets for private firms. The case of Uber reveals that possessing proprietary algorithms and information on a large number of users could be more beneficial than possessing the physical capital needed to offer a specific service (Beaumier et al., 2020). The employment of DTLs decreases the transaction costs, which ultimately support the ‘servicification’ of the economy (Lanz & Maurer, 2015), through which goods are more and more consumed as services. Many hope that ‘big data’ has the potential to direct us toward the achievement of considerable efficiency and productivity gains (Mayer-Schönberger & Cukier, 2013).
In modern times, digital economy formation is one of the most controverting propensities (Popkova & Sergi, 2020). Automatization, on the one hand, helps to enhance the effectiveness in the process of producing complex goods, which ensures high degrees of meticulousness when spending the available resources and minimizes the volume of waste attributed to production and consumption. Moreover, executing routine processes by machines makes the stage ready for the creative activities of a modern human, which widely range from managing the production processes to designing innovative technologies, systems, and processes. On the other hand, a new type of thinking, i.e., digital, is formed. In the decision-making process, the sociocultural factors (which have lost a great deal of their significance due to the impacts of globalization) would remain in the background. As a result, the digital economy causes several challenges to the idea of humanism and makes human society return to “natural selection” whose consequence is the distorted treatment of social justice as the victory of the strong over the weak.
The progress of the new economy has made digitalization a trend. DT refers to the utilization of new digital technologies to improve a business (Fitzgerald et al., 2014). It applies digital technology to operations, business model innovation, or digital strategies in a way to add more value to a company (Singh et al., 2021; Verhoef et al., 2021). The Annual Report on the Development of Global Digital Economy Competitiveness reports that the United States, China, and Singapore are the top three countries in economy-wide digitalization. Companies are naturally attracted to DT; on the other hand, it cannot be confidently said that DT would bring tangible benefits to companies and increase their values. According to the findings of a survey carried out by Wipro Digital in 2017 in the context of the United States, half of the senior executive respondents indicated their respective companies had experienced failure in their DT process. Fitzgerald et al. (2014) reported a paradox in the case of digital technologies: managers have confidence in the benefits of adopting DT; however, they are unsatisfied with the progress of DT in their companies. Practically, DT adoption has its own complexities due to the huge costs, learning curves, and adjustments involved. Accordingly, a key research question is whether a company's DT adoption enhances its performance quality.
Nowadays, the use of digital data brings much value, which has caused new regulatory concerns to arise, from privacy to taxation and workforce transition. In such a situation, public regulators expect digital technologies to support economic development on a global scale. At this phase, there is a need for a cautionary note. The development of digital technologies development should be observed as neither neutral nor completely independent of the regulations formed to govern them. According to the Science and Technology Studies (STS) (Prasad, 2021; Silvast & Virtanen, 2021), novel technologies, as well as their regulatory regimes, are affected by the specific political/social contexts from where they have emerged (Cozzens, 1989). Accordingly, public regulators can impact the utilization of specific technologies at different points in time by adopting new regulations. When it comes to digital technologies, such capacities of public regulators could be confined by a number of digital technology characteristics.
A body of literature defines DT (Chen & Tian, 2022; Kraus et al., 2022; Yang et al., 2021; Zhou et al., 2021). Agarwal et al. (2010) define DT as applications of information technology (IT) with measurement and quantification of IT and its benefits and impact, including beyond the traditional realm of IT. The definition of DT by Fitzgerald et al. (2014) is well-received. They state digital transformation as “the use of new DTLs (social media, mobile, analytics or embedded devices) to enable major business improvements (such as enhancing customer experience, streamlining operations or creating new business models).” (p.4). Interestingly, Piccinini et al. (2015) and Majchrzak et al. (2016) share similar definitions of digital transformation (Fitzgerald et al., 2014). Digitization has developed a transformational potential that is deeply modifying human beings, societies, and the Earth. Similar to any key societal transformation, digitization offers major opportunities for development and, at the same time, major risks with destructive consequences for societies.
However, the literature is loaded with many studies conducted on the digital economy and also on the measurement and management of its global competitiveness (Horoshko et al., 2021; Li et al., 2021). These studies have adopted an approach to investigating the digital economy as a prestige element of the economic system. This is the treatment of the digital economy, which slows down the way it is formed and developed. People and businesses (that are two interested parties) do not see the practical benefits of the digital economy formation and indicate their objection against the redistribution of national resources to the damage of social projects and projects for supporting business in favor of the projects in the sphere of the digital economy. The review of the existing literature showed that the interrelationship between the digital economy and the quality of growth of modern economic systems had not been clarified yet.
Risk assessment of the digital economy transformationTo perform DT projects, companies have to reorganize their business processes, which causes some challenges to arise. Many steps have already been taken toward DT projects, though numerous companies are experiencing some obstacles even in starting new projects (Young & Rogers, 2019). Gale and Aarons (2018) believe that holding an interview with company managers regarding their standing from the perspective of being digitally transformed companies shows that their limitless optimism has vanished in the past four years, and only 30% of them may believe that they could do the DT procedures in the next three years. Although digital transformation into a platform may be appealing as it enables external value creation through third-party developers, transformation is also a source of multiple risks such as business risks, strategic risks, security risks, and investments risks (Nguyen Duc & Chirumamilla, 2019; Ren et al., 2012)
Alternatively, the literature lacks tools capable of analyzing the risks associated the DT projects. These projects are risky and challenging; as a result, it is necessary to propose structured decision procedures for the purpose of guiding policymakers when attempting to manage the risks. Different conflicting factors are typically involved in the process of assessing the risks of DT projects; therefore, evaluating these factors could be recognized as a MCDM problem. Although new methods are appearing increasingly in the relevant literature, several characteristics play important roles in a prosperous risk assessment application in real-life cases.
It is worth mentioning that the concept of DT is still in its infancy stage. Bruskin et al. (2017) presented some realistic instances of developing support methods for digital corporate management and also defined the prospects. Masuda et al. (2017) discussed DT-related risks that may arise in the enterprise architecture domains and also presented some strategies for risk mitigation through developing novel integrated system architecture. Yoo and Kim (2018) made an analysis of the most important factors for the adoption of a cloud computing system with the help of the analytic hierarchy process (AHP). Jayakrishnan et al. (2018) examined the digitalization methods that are generally adopted in the transportation industry in Malaysia. Casey et al. (2018) made a discussion on the importance of decentralization and big data capacities in the accomplishment of DT projects in the field of forensics. Elezaj et al. (2018) examined the big data initiatives in regard to e-government in various countries. Fritzsche et al. (2018) found the differences between the statements of intergovernmental groups and the relevant literature to show the connection between DT and climate change. Bienhaus and Haddud (2018) investigated the digitization of procurement and supply chains and examined their effects on the companies’ performance quality. Filatova et al. (2018) studied the conceivable risks associated with the DT process in the Eurasian Economic Union.
A system assessment method was developed by Ramos et al. (2020) by integrating AHP and preference ranking organization method for enrichment evaluation (PROMETHEE) in order to assess the requirements for industry 4.0. Young and Rogers (2019) reviewed the DT foundational components focusing on the mining industry. Ricciardi et al. (2019) discussed the role of DT in health services with a focus on the role of key factors, e.g., governance. Jones (2019) investigated the impact of DT on process safety in companies. Battisti et al. (2020) examined the interrelationships between risk management and big data, focusing on the domain of corporate real estate. Eckhart et al. (2019) presented a discussion on the problems that may arise in the process of quantitative security risk assessments conducted on industrial control systems. Through an exploratory study, Beller et al. (2019) attempted to determine the criteria for selecting projects in the digital era.
Mitra and O'Regan (2020) examined the impacts of creative leadership on the performance quality of the cyber asset market. In a study conducted by Scholz et al. (2020), an innovative approach was developed as a problem structuring and decision support for managing organizational susceptibility and resilience. They validated their proposed multi-actor analysis on 18 companies of various types and sizes. Moreover, the literature comprises several prominent instances of intelligent manufacturing, e.g., smart manufacturing (Wang et al., 2016), predictive maintenance (Wang et al., 2017), industry 4.0 (Liao et al., 2017, Osterrieder et al., 2019), and cyber-physical systems (Wang et al., 2015). The current paper proposes a new 3-step MCDM model through the hybridization of perceptual reasoning and interval type-2 fuzzy (IT2F)- best-worst method (BWM). This model could be applied to the assessment of the risks associated with a DT project in a real-life case study. Therefore, the predictive maintenance project has the lowest risk magnitude with the linguistic label “Minor”, whereas the augmented reality (AR)-enhanced stock management shows the highest risk magnitude with “Major risk”.
As a result, in comparison to traditional firms, digital transformation diverts resources to riskier investments than product value-enhancing investments as the scope of product value is broadened. This may be due to low digital literacy among managers and employees (Engler, 2020), which may diminish the real value of investments. This handicaps the firm's ability to communicate its value proposition to the market, while its traditional rivals are better able to do so due to their experience and can be more aggressive in their investments.
Apart from the usually increased risk, this suggests that firms contemplating risky digital transformation must also anticipate the response of their rivals (Deepa et al., 2021; Prabadevi et al., 2022; Karhu & Ritala, 2021; da Cunha et al., 2022; Markides & Sosa, 2013) and its impact on their profitability. Therefore, digital transformation is a complex organizational change where firms must carefully balance increased market opportunities with the associated with different risks. However, few studies have addressed the risks of digital economy transformation. For example, Yucel (2018) evaluate the risks, drawbacks, and mitigation plans based on the different dynamic model to forecasting digital economy transformation strategy under several scenarios and conditions. Guryanova et al. (2020) discussed and suggested a new method to evaluate the risks and challenges of socio-ethical problems in digital economy transformation. Gaponenko et al. (2021) considered the main features of risk management in the area of digital economy transformation using an analysis of the current literature review. Dokuchaev (2020) examined and classified the main risks related to digital transformation in the service of information and communications technology and telecommunication firms. Liu (2022) proposed a new risk prediction method to analyze the digital transformation of the supply chain in the manufacturing sector using two machine learning methods, including backpropagation neural network (BPNN) and principal component analysis (PCA). Nguyen Duc and Chirumamilla (2019) identified the main security risks linked with digital transformation from the engineering management perspective using the literature review and focused groups method. Ali and Govindan (2021) evaluate the operational risks for digital transformation in 302 Australian agri-food supply chain companies. Tian et al. (2022) examined the impact of the risks for digital transformation in Chinese listed companies using panel data. Gölcük (2020) proposed a new decision-making approach to assess the digital transformation risks using perceptual reasoning and interval type-2 fuzzy best-worst method (IT2F-BWM) in real-life digital transformation projects.
This study has conducted a survey study to identify the main risks associated with digital economy transformation. The results of this survey approach identified 21 risk factors that are: Risk of transformation caused in terms of information lag or information distortion (f1); Trust risk between partners (f2); Inability to identify risks (f3); Inflexible system architecture (f4); Inconsistent collaboration and digital resource matching risks among industry partners (f5); Ineffective knowledge acquisition (f6); Lack of top management involvement (f7); Risk of exposing data to the public (f8); Irrational decisions on risk management (f9); Inflexible system architecture (f10); The bleak prospect of industrial development (f11); Expensive on-cloud data auditing (f12); Low robustness for the cooperation stability (f13); Limited control over the third-party services (f14); Inadequate consultancy and vendor support (f15); Poor digital technology for integrating industry resources (f16); The unstable market environment in terms of the uncertainty industry and market volatility (f17); Risk of switching database modals (f18); Ineffective risk prevention (f19); Lack of demand services and high-quality digital industry (f20); Lack of expertise and human resources (f21).
Proposed decision support modelThe doctrine of intuitionistic fuzzy sets (IFSs) is described by the belongingness degree (BD) and non-belongingness degree (ND) with the constraint that the sum of the BD and ND is ≤1 (Mishra et al., 2022). Though, the challenge is that a certain condition may arise in the multi-criteria decision-making (MCDM) problem where decision experts (DEs) allocate the BD of 0.8 when an option holds the attribute and the degree of 0.4 when an option displeases the attribute. In this situation, 0.8+0.4>1, which cannot be effectively addressed by IFS (Yager, 2014; Rani et al., 2021). To bridge this gap, Yager (2014) developed the Pythagorean fuzzy sets (PFSs) that are able to meet the condition where the squares sum of BD and ND is ≤1. As a result, PFSs are recognized more effective than IFSs in the description of their ambiguous nature (Zhang & Xu, 2014; Rani et al., 2021; Mishra et al., 2022a). In recent years, an MCDM approach was developed by Rani et al. (2019) with information measures for the problem of selecting optimal renewable energy sources in the Indian context. After that, Rani et al. (2020a) introduced the technique for order of preference by similarity to ideal solution (TOPSIS) model method applicable to selecting a sustainable recycling partner (SRP) in the PFSs setting. A weighted aggregated sum and product assessment (WASPAS) model was proposed by Rani et al. (2020b) to be used in the multi-criteria physician selection problem where there was uncertain information. With the use of the additive ratio assessment (ARAS) and step-wise weight assessment ratio analysis (SWARA) models, Rani et al. (2022b) attempted to evaluate and select healthcare waste (HCW) treatment options. Liu et al. (2021) made evaluation and prioritization the medical-waste treatment methods (MWTMs) by means of the combined compromise solution (CoCoSo) tool on PFSs.
Regarding the MCDM tools, DEs typically provide high significance to the weights of the attributes normally described in the literature as objective and subjective weights (Kersuliene et al., 2010). The subjective weights reflect DEs’ thoughts, which take into account the attributes’ relative significance (Rani et al. 2020c). The SWARA tool was suggested by Kersuliene et al. (2010) in order to compute the subjective weights. Compared to different models, such as the analytic hierarchy process (AHP), the computational procedures in SWARA are simpler; it offers a high degree of consistency and does not require many pairwise comparisons. Additionally, in comparison with BWM (best worst method), the SWARA does not require the solution of complex linear objective functions, has less complex computational operations, and could be easily understood. In a recent study, Mishra et al. (2020) gave the SWARA with complex proportional assessment (COPRAS) for the evaluation of the bioenergy production procedures with IFSs. The intricate challenges of the present world have directed researchers toward developing many MCDM approaches. For instance, Wu and Liao (2019) introduced the gained and lost dominance score (GLDS) method for the solution of the MCDM problems. The GLDS can be employed to choose the alternative(s) of the highest desirability by computing the dominance flow between any two options considering the criteria. The best alternative is obtained with a higher gained dominance score and a lower lost dominance score. In the study of Liao et al. (2019), a life satisfaction evaluation model was developed by means of the PL-GLDS integrated method to be applied to an earthquake-hit area. Therefore, GLDS has been proved effective in solving real-world MCDM problems.
In another study, Keshavarz-Ghorabaee et al. (2021) proposed a novel objective weighting model, called the method with the removal effects of criteria (MEREC), in order to evaluate the criteria weights. The MEREC uses each attribute's removal effect upon the alternatives’ evaluation to attain the attributes’ weights. Considering the deviations, evaluating an option based on the removal attribute is a novel concept in identifying the attribute weights. Rani et al. (2022a) discussed the MEREC-based ARAS method to treat the food waste treatment method assessment on Fermatean fuzzy sets (FFSs). Hezam et al. (2022b) introduced a hybrid MCDM methodology by combining the MEREC-rank sum (RS) and double normalization-based multiple aggregation (DNMA) approaches with IFSs and applied them to evaluate the alternative fuel vehicles problem. In the case of the subjective weighting model, SWARA is employed to aid decision-makers in assigning their ranking values to the selected criteria. This is the first study that develops an integrated MEREC-SWARA weighting and GLDS-based method under the PFSs setting to assess the critical risks that may be induced by the digital economy transformation (DET) in the manufacturing industry.
Here, first, we discuss the notion of the PFSs as follows:
Definition 1
(Yager, 2014). Let V be a fixed set. A PFS F on V is described as the BD bF and the ND nF, satisfying a constraint 0≤(bF(xi))2+(nF(xi))2≤1 Mathematically, it can be defined as f{〈xi,(bF(xi)nF(xi))〉|xi∈V} where bF:V→[0,1]andnF:V→[0,1]. For each xi∈V,F=πF(xi)=1−bF2(xi)−nF2(xi) is called the indeterminacy degree. Additionally, a “Pythagorean fuzzy number (PFN)” is denoted by ℘=(b℘n℘) wherein b℘,n℘∈[0,1]and0
Definition 2
(Zhang & Xu, 2014). Let ℘=(b℘n℘) be a PFN. Then score and accuracy values of ℘ are defined as


Next, this section develops a PF-MEREC-SWARA-GLDS method under the PFSs setting for treating the MCDM applications. The procedure of the presented approach is given by
Step 1: Make the linguistic decision matrix (LDM).
A set of ℓ DEs A={A1,A2,...,Aℓ} determine the sets of m optionsM={M1,M2,...,Mm} and n criteria F={f1,f2,...,fn}. Considering the imprecision of human opinions and lack of information related to the options; the DEs assign linguistic values (LVs) to assess his/her judgment on option Mi over attribute fj. Let Z(k)=(ξij(k))m×n,i=1,2,...,m,j=1,2,...,n be the LDM by DEs, where ξij(k) shows the of an option Mi over attribute fj given by kth expert.
Step 2: Find the weight of DEs.
To obtain the DEs’ weight, the assessment of DEs are offered in term of LVs and then defined in PFNs. To find the kth DE weight, let Ak=(bk,nk) be the PFN; the expression is given by

Here, ϖk≥0 and ∑k=1ℓϖk=1.
Step 3: Create the aggregated PF-decision matrix (A-PF-DM).
The A-PF-DM is created using the PF-weighted averaging (PFWA) operator and get Z=(ξij)m×n, where

Step 4: Proposed PF-subjective and objective weighting approach
Let w=(w1,w2,...,wn)T be the weight of the attribute set with ∑j=1nwj=1 and wj∈[0,1]. Then, the process for determining the attribute weight is discussed as
Case I: Determination of objective weights by the method of PF-MEREC
To find the criteria weights, the MEREC (Rani et al., 2021; Mishra et al., 2022) is applied to PFSs. In the following, the procedure of the PF-MEREC is presented by
Step 4a: Normalize the A-PF-DM.
In this step, a simple linear normalization is used to scale the elements of the A-PF-DM Z=(ξij)m×n and generate the normalized A-PF-DM R¯=(y¯ij)m×n. If fb shows the benefit-type criteria set and fn represents the cost-type criteria set, then we utilize the following equation for normalization:

Step 4b: Find the score matrix.
With the use of the following formula (Rani et al., 2020c), the score matrix Ω=(ηij)m×n of each PFN ςij is calculated:

Step 4c: Compute the alternatives’ overall performance.
This step involves the use of a logarithmic measure with equal criteria weights for the computation of the overall performance of the alternatives (Keshavarz-Ghorabaee et al., 2021). Based on the normalized values achieved in step 4b, the smaller values of ηij could be ensured to obtain greater performance values. To compute these values, Eq. (7) is employed:

Step 4d: Compute the alternatives’ performance through the removal of each criterion.
This step makes use of the logarithmic measure in a way similar to the preceding step. The difference with step 4c is that the alternatives’ performance is computed based on the removal of each criterion separately. As a result, there will be n sets of performance accompanied with n criteria. Let Si′ stand for the ith alternative’ overall performance in regard to removing the jth criterion. To calculate the values required for this step, Eq. (8) is employed:

Step 4e: Calculate the summation of absolute deviations.
Let Vj stands the summation of absolute deviations for the effect of the jth criterion removal. Then, Vj can be computed by Eq. (9):

Step 4f: Find the objective weight of the attribute.
In this step, the objective weight (wjo) of the attribute is obtained using the removal effects (Vj) of step 4e as follows:

Case II: Determine the subjective weights by the PF-SWARA method
Step 4g: Make an estimation of the score values. The score value S(ξkj) of PFNs is calculated using Eq. (1). After that; we prioritize the attributes in accordance with the score values provided by DEs from the largest to smallest ratings.
Step 4h: Evaluate the average value's comparative significance. The importance degree is estimated with the second-placed attribute, and the following comparative importance is utilized in making a comparison between attributes fj and fj−1.
Step 4i: Find the comparative significance κj using Eq. (11):

Step 4j: Estimate the attribute weight. The expression of determining the weight (ρj) as follows:
Step 4k: Obtain the subjective. The weight (wjs) of attribute are determined as
Case III: Computation of combined weight using the PF-MEREC-SWARA model.


The DE wants to employ the subjective and objective assessment of attribute weights. To do so, the expression for integrating weight is discussed as
where γ∈[0,1] is a strategic parameter.
Step 5: Construct the dominance flows
Let y¯ij=(b¯ij,n¯ij) and y¯vj=(b¯vj,n¯vj) be two PFNs for two alternatives Mi and Mv under the criterion fj, respectively.
The dominance flow of the alternative Mi and Mv with respect to the criterion fj is defined as
where S(yij) is the score value for PFNs.
The normalized dominance flow is obtained using vector normalization as

Step 6: Create the gained dominance score of each option
The unicriterion gained dominance score (UGDS) of alternative Mi outranking all the other alternatives Mv(v=1,2,...,mandv≠i) over attribute fj is calculated by

The overall gained dominance score (OGDS) of alternative Mi is computed as

Then, a subordinate rank set ρ1={r1(M1),r1(M2),...,r1(Mm)} is obtained in descending order of the values of OGDSj(Mi)(i=1,2,...,m).
Step 7: Construct the lost dominance score of each option
To depict the feature that alternative Mi does not always dominate Mv, the uni-criterion lost dominance score (ULDS) of option Mi is adopted using the maximizing operator as

Similarly, the overall lost dominance score (OLDS) of option Mi is determined by

Then, another subordinate rank set ρ2={r2(M1),r2(M2),...,r2(Mm)} is obtained in ascending order of the values of OLDSj(Mi)(i=1,2,...,m).
Step 8: Compute the collective score
Normalizing the OGDS and OLDS of each option, we obtain OGDSN(Mi), and OLDSN(Mi). The l rank ρ={r(M1),r(M2),...,r(Mm)} is derived in descending order of CSi, where CSi indicates the collective score of alternative Mi:
Results and discussionCase study
In the digital economy, the Chinese manufacturing sector has developed many best practices that have been applied worldwide. In this study, we have conducted a survey using the current literature review and experts’ opinions to evaluate the most important risks for digital economy transformation in the manufacturing industry. To do so, a comprehensive search has been done in the literature review to find the important risks to send the related experts. To evaluate these risks, we have invited 15 experts from academia in the area of digital technologies, digital economy, manufacturing, and digital transformation. In total, 21 risks are selected by experts on risks for digital economy transformation in the manufacturing industry. In the next stage, we designed these risks in a questionnaire format to send to eight experts in the industry and academia sectors. After the research framework was constructed, eight experts with the digital economy and digital transformation experiences in the manufacturing industry were chosen to participate in the study to evaluate the selected risks. These eight experts were selected from manufacturing industries located in the industrial park. All the selected industries have >200 employees, and the eight experts have >10 years of experience making decisions on digital transformation. Among these experts’ answers, five questionnaires contained inconsistent answers. These questionnaires were returned to the respondents to be filled out again, whereupon one expert refused to revise and correct their responses due to their busy schedules. Consequently, this one expert answer was excluded from the analysis. Therefore, the result of this study is based on the responses of four experts.
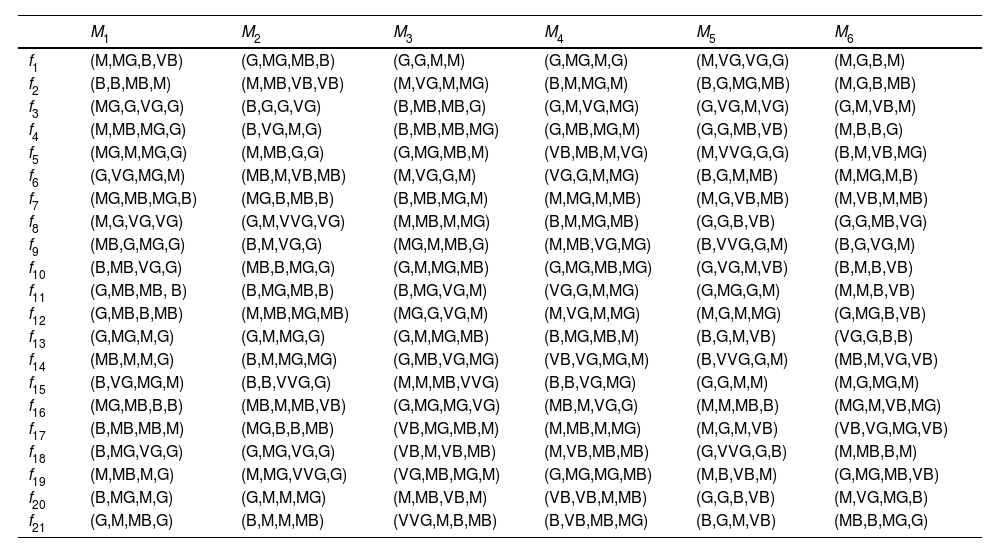
To analyze the results of the questionnaires, an integrated PF-MEREC-SWARA-GLDS approach is presented in this study. In this approach, the PF-MEREC-SWARA is applied to compute the weight of risks for DET in the manufacturing industry, and the PF-GLDS model is implemented to find the prioritization of industries over different risks for DET in the manufacturing industry. The implementation of the PF-MEREC-SWARA-GLDS method is discussed as follows: Steps 1–3:Table 1 portrays the LVs for assessing the ratings of the DEs and risks and then converted into PFNs. Table 2 shows the DE's weight using Table 1 and Eq. (3). Table 3 presents the LDM to evaluate the industries over different risks for DET in the manufacturing industry.
Performance ratings of option over criteria and DEs regarding the LVs.
| LVs | PFNs |
|---|---|
| Absolutely good (AG) | (0.95, 0.20, 0.240) |
| Very very good (VVG) | (0.85, 0.30, 0.433) |
| Very good (VG) | (0.80, 0.35, 0.487) |
| Good (G) | (0.70, 0.45, 0.554) |
| Moderate good (MG) | (0.60, 0.55, 0.581) |
| Moderate (M) | (0.50, 0.60, 0.624) |
| Moderate bad (MB) | (0.40, 0.70, 0.592) |
| Bad (B) | (0.30, 0.75, 0.589) |
| Very low (VB) | (0.20, 0.85, 0.487) |
| Absolutely bad (AB) | (0.10, 0.95, 0.296) |
The LDM by DEs to the risk for DET in the manufacturing industry.
| M1 | M2 | M3 | M4 | M5 | M6 | |
|---|---|---|---|---|---|---|
| f1 | (M,MG,B,VB) | (G,MG,MB,B) | (G,G,M,M) | (G,MG,M,G) | (M,VG,VG,G) | (M,G,B,M) |
| f2 | (B,B,MB,M) | (M,MB,VB,VB) | (M,VG,M,MG) | (B,M,MG,M) | (B,G,MG,MB) | (M,G,B,MB) |
| f3 | (MG,G,VG,G) | (B,G,G,VG) | (B,MB,MB,G) | (G,M,VG,MG) | (G,VG,M,VG) | (G,M,VB,M) |
| f4 | (M,MB,MG,G) | (B,VG,M,G) | (B,MB,MB,MG) | (G,MB,MG,M) | (G,G,MB,VB) | (M,B,B,G) |
| f5 | (MG,M,MG,G) | (M,MB,G,G) | (G,MG,MB,M) | (VB,MB,M,VG) | (M,VVG,G,G) | (B,M,VB,MG) |
| f6 | (G,VG,MG,M) | (MB,M,VB,MB) | (M,VG,G,M) | (VG,G,M,MG) | (B,G,M,MB) | (M,MG,M,B) |
| f7 | (MG,MB,MG,B) | (MG,B,MB,B) | (B,MB,MG,M) | (M,MG,M,MB) | (M,G,VB,MB) | (M,VB,M,MB) |
| f8 | (M,G,VG,VG) | (G,M,VVG,VG) | (M,MB,M,MG) | (B,M,MG,MB) | (G,G,B,VB) | (G,G,MB,VG) |
| f9 | (MB,G,MG,G) | (B,M,VG,G) | (MG,M,MB,G) | (M,MB,VG,MG) | (B,VVG,G,M) | (B,G,VG,M) |
| f10 | (B,MB,VG,G) | (MB,B,MG,G) | (G,M,MG,MB) | (G,MG,MB,MG) | (G,VG,M,VB) | (B,M,B,VB) |
| f11 | (G,MB,MB, B) | (B,MG,MB,B) | (B,MG,VG,M) | (VG,G,M,MG) | (G,MG,G,M) | (M,M,B,VB) |
| f12 | (G,MB,B,MB) | (M,MB,MG,MB) | (MG,G,VG,M) | (M,VG,M,MG) | (M,G,M,MG) | (G,MG,B,VB) |
| f13 | (G,MG,M,G) | (G,M,MG,G) | (G,M,MG,MB) | (B,MG,MB,M) | (B,G,M,VB) | (VG,G,B,B) |
| f14 | (MB,M,M,G) | (B,M,MG,MG) | (G,MB,VG,MG) | (VB,VG,MG,M) | (B,VVG,G,M) | (MB,M,VG,VB) |
| f15 | (B,VG,MG,M) | (B,B,VVG,G) | (M,M,MB,VVG) | (B,B,VG,MG) | (G,G,M,M) | (M,G,MG,M) |
| f16 | (MG,MB,B,B) | (MB,M,MB,VB) | (G,MG,MG,VG) | (MB,M,VG,G) | (M,M,MB,B) | (MG,M,VB,MG) |
| f17 | (B,MB,MB,M) | (MG,B,B,MB) | (VB,MG,MB,M) | (M,MB,M,MG) | (M,G,M,VB) | (VB,VG,MG,VB) |
| f18 | (B,MG,VG,G) | (G,MG,VG,G) | (VB,M,VB,MB) | (M,VB,MB,MB) | (G,VVG,G,B) | (M,MB,B,M) |
| f19 | (M,MB,M,G) | (M,MG,VVG,G) | (VG,MB,MG,M) | (G,MG,MG,MB) | (M,B,VB,M) | (G,MG,MB,VB) |
| f20 | (B,MG,M,G) | (G,M,M,MG) | (M,MB,VB,M) | (VB,VB,M,MB) | (G,G,B,VB) | (M,VG,MG,B) |
| f21 | (G,M,MB,G) | (B,M,M,MB) | (VVG,M,B,MB) | (B,VB,MB,MG) | (B,G,M,VB) | (MB,B,MG,G) |
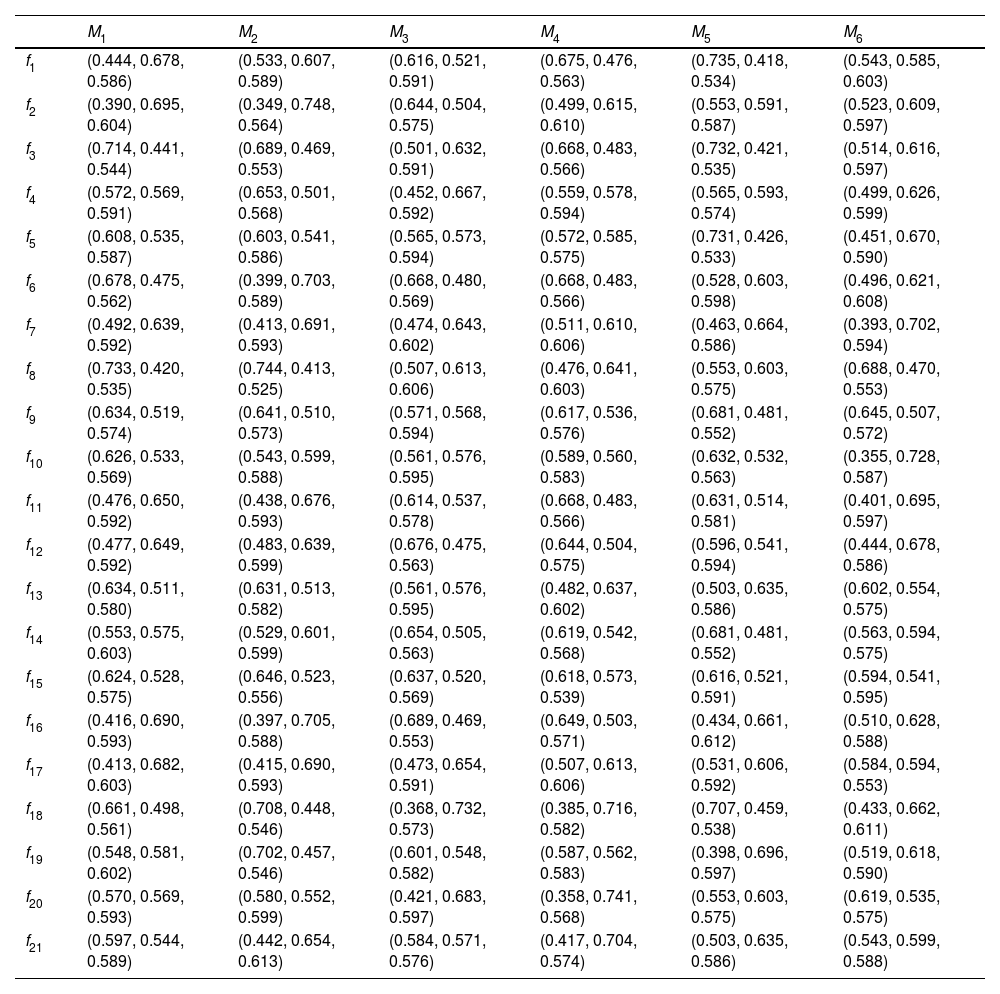
From Eq. (4) and Table 3, A-PF-DM Z=(ξij)m×nis created and is given in Table 4.
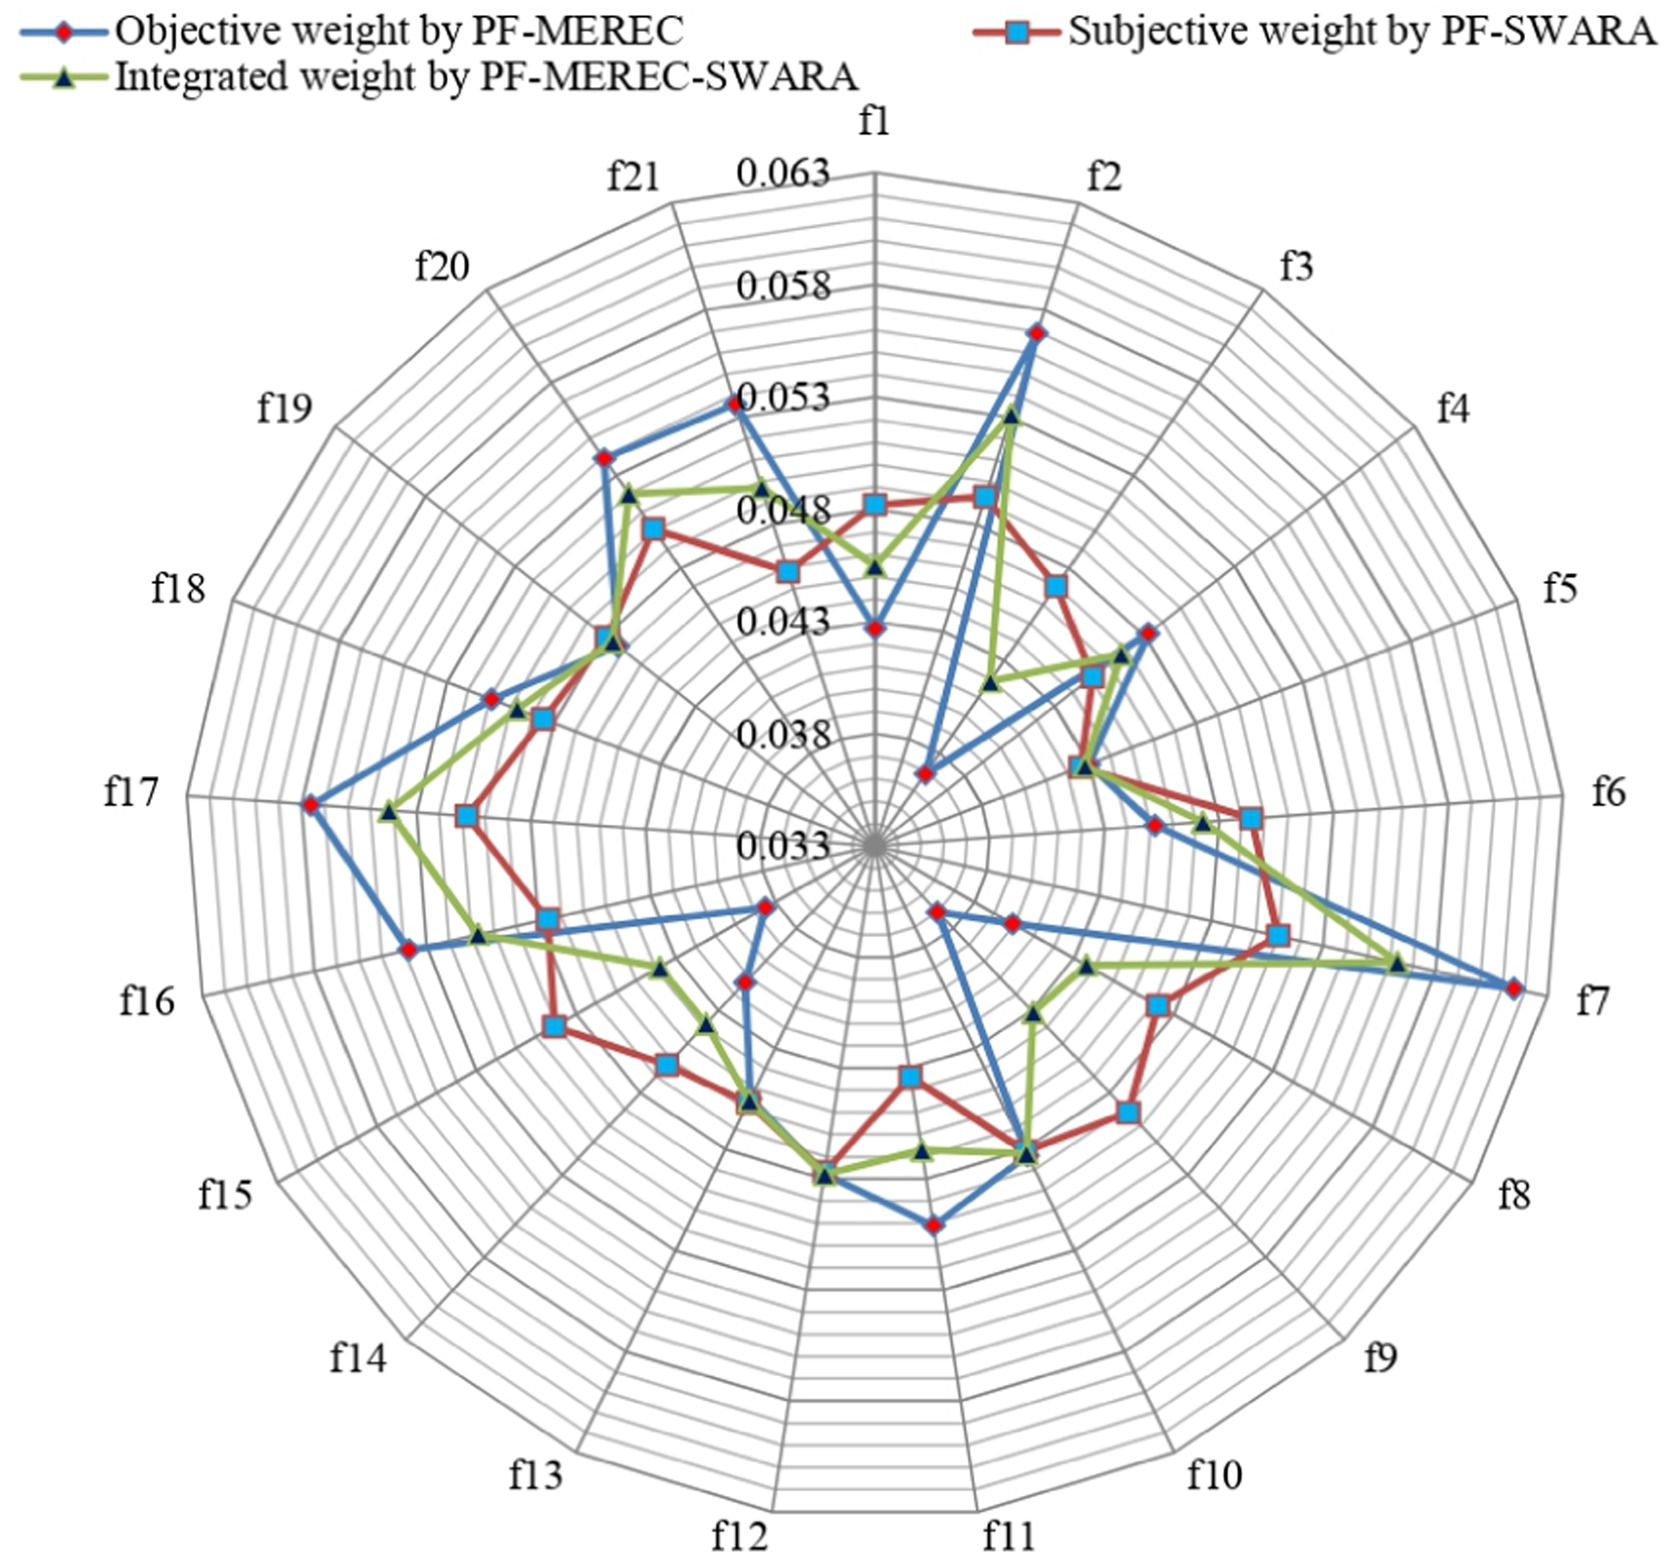
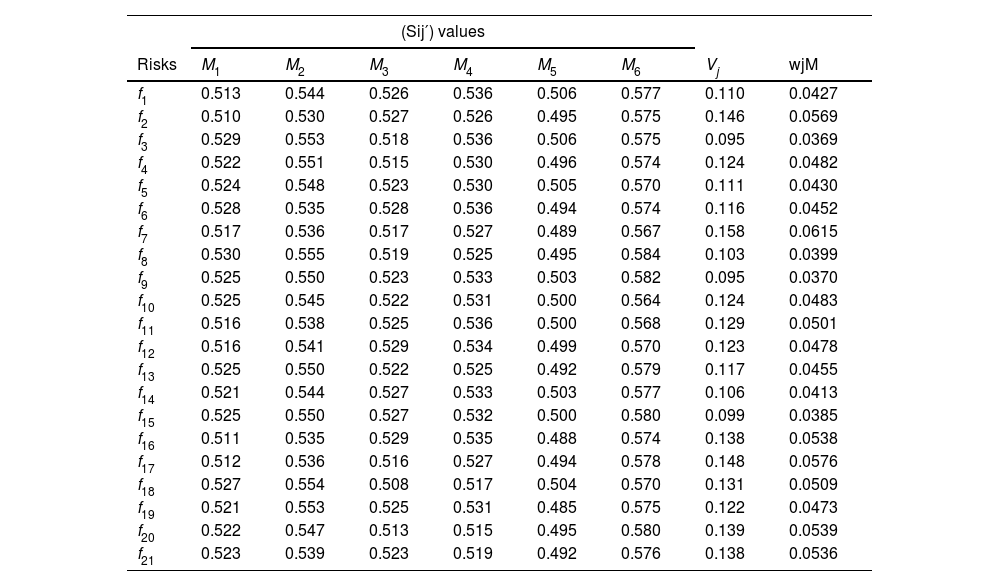
Step 4. Since all the criteria are of the same type, the normalization of the A-PF-DM presented in Table 4 is not required. For determining the weights of risks using PF-MEREC, the alternatives’ overall performance values are computed using Eq. (6), and presented as S1 = 0.541, S2 = 0.565, S3 = 0.542, S4 = 0.549, S5 = 0.517, and S6 = 0.596. Using Eq. (7), the alternatives’ overall performances(Sij′) is determined by removing each risk, which is presented in Table 5. Afterward, the removal effect of each risk upon the alternatives’ overall performance is calculated on the basis of the deviation-based formula of Eq. (8). The weight of each risk is obtained using Eq. (9), considering the impact of their removal on the performance Vj of the alternatives. By means of Eq. (10) and the Vj values, the weights of the risks for DET in the manufacturing industry are calculated, which are presented in Table 5 and Fig. 1.
Table 5.The implementation of the MEREC weighting approach for computing the criteria weights.
(Sij′) values Risks M1 M2 M3 M4 M5 M6 Vj wjM f1 0.513 0.544 0.526 0.536 0.506 0.577 0.110 0.0427 f2 0.510 0.530 0.527 0.526 0.495 0.575 0.146 0.0569 f3 0.529 0.553 0.518 0.536 0.506 0.575 0.095 0.0369 f4 0.522 0.551 0.515 0.530 0.496 0.574 0.124 0.0482 f5 0.524 0.548 0.523 0.530 0.505 0.570 0.111 0.0430 f6 0.528 0.535 0.528 0.536 0.494 0.574 0.116 0.0452 f7 0.517 0.536 0.517 0.527 0.489 0.567 0.158 0.0615 f8 0.530 0.555 0.519 0.525 0.495 0.584 0.103 0.0399 f9 0.525 0.550 0.523 0.533 0.503 0.582 0.095 0.0370 f10 0.525 0.545 0.522 0.531 0.500 0.564 0.124 0.0483 f11 0.516 0.538 0.525 0.536 0.500 0.568 0.129 0.0501 f12 0.516 0.541 0.529 0.534 0.499 0.570 0.123 0.0478 f13 0.525 0.550 0.522 0.525 0.492 0.579 0.117 0.0455 f14 0.521 0.544 0.527 0.533 0.503 0.577 0.106 0.0413 f15 0.525 0.550 0.527 0.532 0.500 0.580 0.099 0.0385 f16 0.511 0.535 0.529 0.535 0.488 0.574 0.138 0.0538 f17 0.512 0.536 0.516 0.527 0.494 0.578 0.148 0.0576 f18 0.527 0.554 0.508 0.517 0.504 0.570 0.131 0.0509 f19 0.521 0.553 0.525 0.531 0.485 0.575 0.122 0.0473 f20 0.522 0.547 0.513 0.515 0.495 0.580 0.139 0.0539 f21 0.523 0.539 0.523 0.519 0.492 0.576 0.138 0.0536

The A-PF-DM to evaluate the risk for DET in the manufacturing industry.
| M1 | M2 | M3 | M4 | M5 | M6 | |
|---|---|---|---|---|---|---|
| f1 | (0.444, 0.678, 0.586) | (0.533, 0.607, 0.589) | (0.616, 0.521, 0.591) | (0.675, 0.476, 0.563) | (0.735, 0.418, 0.534) | (0.543, 0.585, 0.603) |
| f2 | (0.390, 0.695, 0.604) | (0.349, 0.748, 0.564) | (0.644, 0.504, 0.575) | (0.499, 0.615, 0.610) | (0.553, 0.591, 0.587) | (0.523, 0.609, 0.597) |
| f3 | (0.714, 0.441, 0.544) | (0.689, 0.469, 0.553) | (0.501, 0.632, 0.591) | (0.668, 0.483, 0.566) | (0.732, 0.421, 0.535) | (0.514, 0.616, 0.597) |
| f4 | (0.572, 0.569, 0.591) | (0.653, 0.501, 0.568) | (0.452, 0.667, 0.592) | (0.559, 0.578, 0.594) | (0.565, 0.593, 0.574) | (0.499, 0.626, 0.599) |
| f5 | (0.608, 0.535, 0.587) | (0.603, 0.541, 0.586) | (0.565, 0.573, 0.594) | (0.572, 0.585, 0.575) | (0.731, 0.426, 0.533) | (0.451, 0.670, 0.590) |
| f6 | (0.678, 0.475, 0.562) | (0.399, 0.703, 0.589) | (0.668, 0.480, 0.569) | (0.668, 0.483, 0.566) | (0.528, 0.603, 0.598) | (0.496, 0.621, 0.608) |
| f7 | (0.492, 0.639, 0.592) | (0.413, 0.691, 0.593) | (0.474, 0.643, 0.602) | (0.511, 0.610, 0.606) | (0.463, 0.664, 0.586) | (0.393, 0.702, 0.594) |
| f8 | (0.733, 0.420, 0.535) | (0.744, 0.413, 0.525) | (0.507, 0.613, 0.606) | (0.476, 0.641, 0.603) | (0.553, 0.603, 0.575) | (0.688, 0.470, 0.553) |
| f9 | (0.634, 0.519, 0.574) | (0.641, 0.510, 0.573) | (0.571, 0.568, 0.594) | (0.617, 0.536, 0.576) | (0.681, 0.481, 0.552) | (0.645, 0.507, 0.572) |
| f10 | (0.626, 0.533, 0.569) | (0.543, 0.599, 0.588) | (0.561, 0.576, 0.595) | (0.589, 0.560, 0.583) | (0.632, 0.532, 0.563) | (0.355, 0.728, 0.587) |
| f11 | (0.476, 0.650, 0.592) | (0.438, 0.676, 0.593) | (0.614, 0.537, 0.578) | (0.668, 0.483, 0.566) | (0.631, 0.514, 0.581) | (0.401, 0.695, 0.597) |
| f12 | (0.477, 0.649, 0.592) | (0.483, 0.639, 0.599) | (0.676, 0.475, 0.563) | (0.644, 0.504, 0.575) | (0.596, 0.541, 0.594) | (0.444, 0.678, 0.586) |
| f13 | (0.634, 0.511, 0.580) | (0.631, 0.513, 0.582) | (0.561, 0.576, 0.595) | (0.482, 0.637, 0.602) | (0.503, 0.635, 0.586) | (0.602, 0.554, 0.575) |
| f14 | (0.553, 0.575, 0.603) | (0.529, 0.601, 0.599) | (0.654, 0.505, 0.563) | (0.619, 0.542, 0.568) | (0.681, 0.481, 0.552) | (0.563, 0.594, 0.575) |
| f15 | (0.624, 0.528, 0.575) | (0.646, 0.523, 0.556) | (0.637, 0.520, 0.569) | (0.618, 0.573, 0.539) | (0.616, 0.521, 0.591) | (0.594, 0.541, 0.595) |
| f16 | (0.416, 0.690, 0.593) | (0.397, 0.705, 0.588) | (0.689, 0.469, 0.553) | (0.649, 0.503, 0.571) | (0.434, 0.661, 0.612) | (0.510, 0.628, 0.588) |
| f17 | (0.413, 0.682, 0.603) | (0.415, 0.690, 0.593) | (0.473, 0.654, 0.591) | (0.507, 0.613, 0.606) | (0.531, 0.606, 0.592) | (0.584, 0.594, 0.553) |
| f18 | (0.661, 0.498, 0.561) | (0.708, 0.448, 0.546) | (0.368, 0.732, 0.573) | (0.385, 0.716, 0.582) | (0.707, 0.459, 0.538) | (0.433, 0.662, 0.611) |
| f19 | (0.548, 0.581, 0.602) | (0.702, 0.457, 0.546) | (0.601, 0.548, 0.582) | (0.587, 0.562, 0.583) | (0.398, 0.696, 0.597) | (0.519, 0.618, 0.590) |
| f20 | (0.570, 0.569, 0.593) | (0.580, 0.552, 0.599) | (0.421, 0.683, 0.597) | (0.358, 0.741, 0.568) | (0.553, 0.603, 0.575) | (0.619, 0.535, 0.575) |
| f21 | (0.597, 0.544, 0.589) | (0.442, 0.654, 0.613) | (0.584, 0.571, 0.576) | (0.417, 0.704, 0.574) | (0.503, 0.635, 0.586) | (0.543, 0.599, 0.588) |
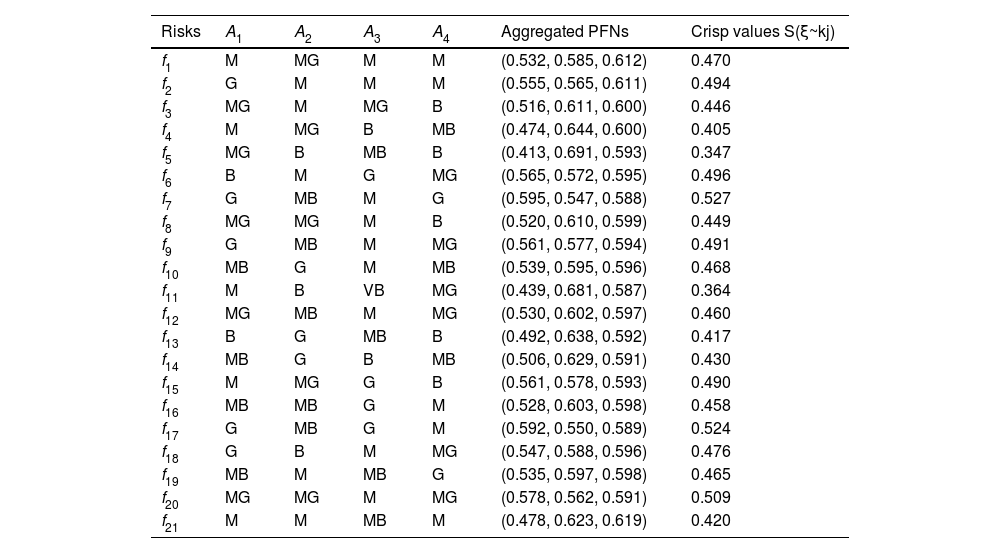
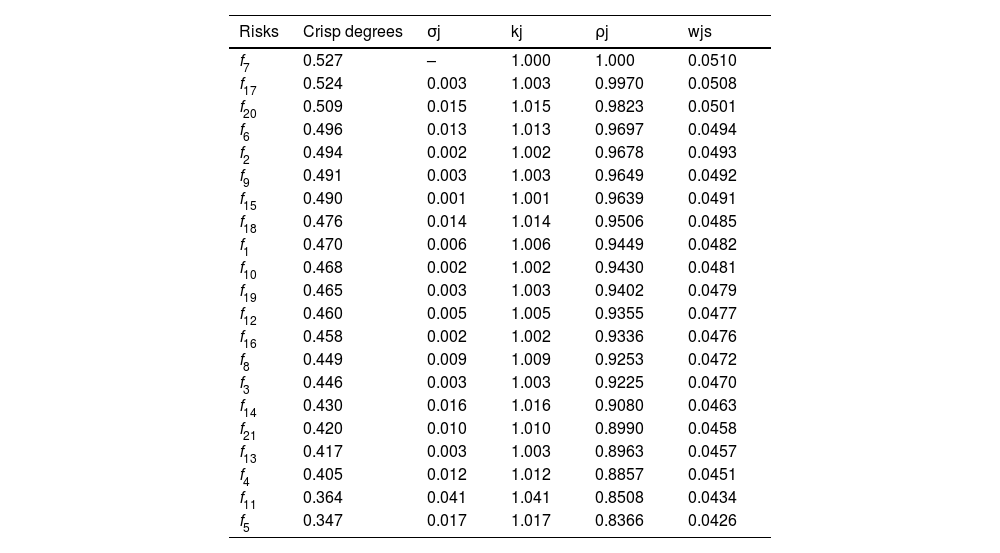
From Eqs. (11)–(13), the subjective weights were computed using the PF-SWARA procedure of each most important risk for DET in the manufacturing industry using Tables 6–7. The resultant values are presented in Fig. 1 and given as follows:
Significance of degree of risk for DET in the manufacturing industry.
| Risks | A1 | A2 | A3 | A4 | Aggregated PFNs | Crisp values S(ξ~kj) |
|---|---|---|---|---|---|---|
| f1 | M | MG | M | M | (0.532, 0.585, 0.612) | 0.470 |
| f2 | G | M | M | M | (0.555, 0.565, 0.611) | 0.494 |
| f3 | MG | M | MG | B | (0.516, 0.611, 0.600) | 0.446 |
| f4 | M | MG | B | MB | (0.474, 0.644, 0.600) | 0.405 |
| f5 | MG | B | MB | B | (0.413, 0.691, 0.593) | 0.347 |
| f6 | B | M | G | MG | (0.565, 0.572, 0.595) | 0.496 |
| f7 | G | MB | M | G | (0.595, 0.547, 0.588) | 0.527 |
| f8 | MG | MG | M | B | (0.520, 0.610, 0.599) | 0.449 |
| f9 | G | MB | M | MG | (0.561, 0.577, 0.594) | 0.491 |
| f10 | MB | G | M | MB | (0.539, 0.595, 0.596) | 0.468 |
| f11 | M | B | VB | MG | (0.439, 0.681, 0.587) | 0.364 |
| f12 | MG | MB | M | MG | (0.530, 0.602, 0.597) | 0.460 |
| f13 | B | G | MB | B | (0.492, 0.638, 0.592) | 0.417 |
| f14 | MB | G | B | MB | (0.506, 0.629, 0.591) | 0.430 |
| f15 | M | MG | G | B | (0.561, 0.578, 0.593) | 0.490 |
| f16 | MB | MB | G | M | (0.528, 0.603, 0.598) | 0.458 |
| f17 | G | MB | G | M | (0.592, 0.550, 0.589) | 0.524 |
| f18 | G | B | M | MG | (0.547, 0.588, 0.596) | 0.476 |
| f19 | MB | M | MB | G | (0.535, 0.597, 0.598) | 0.465 |
| f20 | MG | MG | M | MG | (0.578, 0.562, 0.591) | 0.509 |
| f21 | M | M | MB | M | (0.478, 0.623, 0.619) | 0.420 |
The weight of different risks for DET in the manufacturing industry using the SWARA method.
| Risks | Crisp degrees | σj | kj | ρj | wjs |
|---|---|---|---|---|---|
| f7 | 0.527 | – | 1.000 | 1.000 | 0.0510 |
| f17 | 0.524 | 0.003 | 1.003 | 0.9970 | 0.0508 |
| f20 | 0.509 | 0.015 | 1.015 | 0.9823 | 0.0501 |
| f6 | 0.496 | 0.013 | 1.013 | 0.9697 | 0.0494 |
| f2 | 0.494 | 0.002 | 1.002 | 0.9678 | 0.0493 |
| f9 | 0.491 | 0.003 | 1.003 | 0.9649 | 0.0492 |
| f15 | 0.490 | 0.001 | 1.001 | 0.9639 | 0.0491 |
| f18 | 0.476 | 0.014 | 1.014 | 0.9506 | 0.0485 |
| f1 | 0.470 | 0.006 | 1.006 | 0.9449 | 0.0482 |
| f10 | 0.468 | 0.002 | 1.002 | 0.9430 | 0.0481 |
| f19 | 0.465 | 0.003 | 1.003 | 0.9402 | 0.0479 |
| f12 | 0.460 | 0.005 | 1.005 | 0.9355 | 0.0477 |
| f16 | 0.458 | 0.002 | 1.002 | 0.9336 | 0.0476 |
| f8 | 0.449 | 0.009 | 1.009 | 0.9253 | 0.0472 |
| f3 | 0.446 | 0.003 | 1.003 | 0.9225 | 0.0470 |
| f14 | 0.430 | 0.016 | 1.016 | 0.9080 | 0.0463 |
| f21 | 0.420 | 0.010 | 1.010 | 0.8990 | 0.0458 |
| f13 | 0.417 | 0.003 | 1.003 | 0.8963 | 0.0457 |
| f4 | 0.405 | 0.012 | 1.012 | 0.8857 | 0.0451 |
| f11 | 0.364 | 0.041 | 1.041 | 0.8508 | 0.0434 |
| f5 | 0.347 | 0.017 | 1.017 | 0.8366 | 0.0426 |
wjs= (0.0482, 0.0493, 0.0470, 0.0451, 0.0426, 0.0494, 0.0510, 0.0472, 0.0492, 0.0481, 0.0434, 0.0477, 0.0457, 0.0463, 0.0491, 0.0476, 0.0508, 0.0485, 0.0479, 0.0501, 0.0458).
From the algorithm of the proposed PF-MEREC-SWARA method, the integrated weight using Eq. (14) for τ=0.5 is given in Fig. 1 and presented as follows:
wj = (0.0455, 0.0531, 0.0419, 0.0467, 0.0428, 0.0473, 0.0563, 0.0436, 0.0431, 0.0482, 0.0467, 0.0478, 0.0456, 0.0438, 0.0438, 0.0507, 0.0542, 0.0497, 0.0476, 0.0520, 0.0497).
Here, Fig. 1 discusses the weight values of different risks for DET in the manufacturing industry with respect to the goal. Lack of top management involvement (f7) with a weight of 0.0563, is the most important risk for DET in the manufacturing industry. The unstable market environment in terms of the uncertainty industry and market volatility (f17) with a weight of 0.0542 is the second most important risk for DET in the manufacturing industry. Trust risk between partners (f2) has third with a weight of 0.0531, lack of demand services and high-quality digital industry (f20) has fourth with a weight of 0.0520, Poor digital technology for integrating industry resources (f16) with a weight of 0.0507 has the fifth most important risk for DET in the manufacturing industry and others are considered crucial risks for DET in the manufacturing industry.
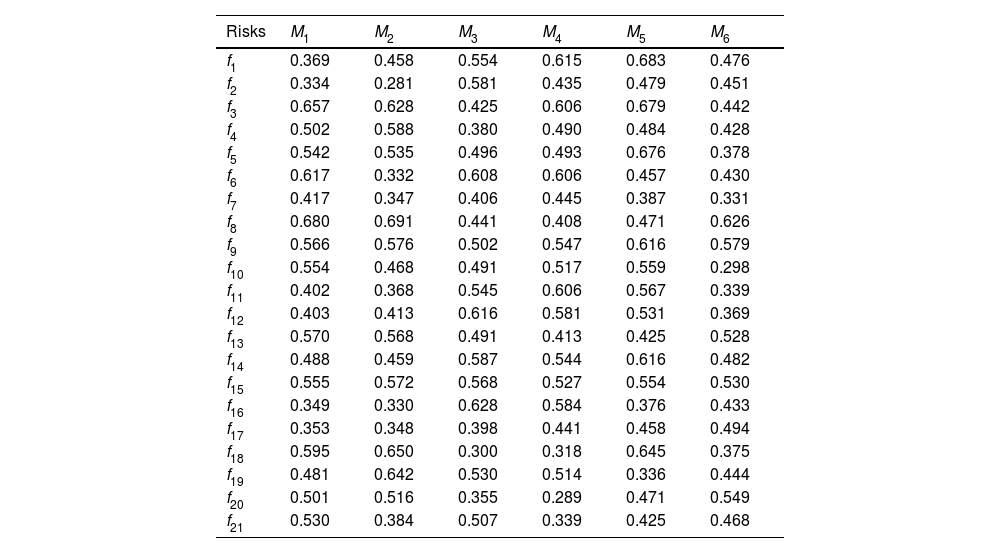
Step 5: By using the score function Eq. (15)–Eq. (16), the A-PF-DM is transformed into the score matrix given in Table 8.
Table 8.Score-matrix of the A-PF-DM.
Risks M1 M2 M3 M4 M5 M6 f1 0.369 0.458 0.554 0.615 0.683 0.476 f2 0.334 0.281 0.581 0.435 0.479 0.451 f3 0.657 0.628 0.425 0.606 0.679 0.442 f4 0.502 0.588 0.380 0.490 0.484 0.428 f5 0.542 0.535 0.496 0.493 0.676 0.378 f6 0.617 0.332 0.608 0.606 0.457 0.430 f7 0.417 0.347 0.406 0.445 0.387 0.331 f8 0.680 0.691 0.441 0.408 0.471 0.626 f9 0.566 0.576 0.502 0.547 0.616 0.579 f10 0.554 0.468 0.491 0.517 0.559 0.298 f11 0.402 0.368 0.545 0.606 0.567 0.339 f12 0.403 0.413 0.616 0.581 0.531 0.369 f13 0.570 0.568 0.491 0.413 0.425 0.528 f14 0.488 0.459 0.587 0.544 0.616 0.482 f15 0.555 0.572 0.568 0.527 0.554 0.530 f16 0.349 0.330 0.628 0.584 0.376 0.433 f17 0.353 0.348 0.398 0.441 0.458 0.494 f18 0.595 0.650 0.300 0.318 0.645 0.375 f19 0.481 0.642 0.530 0.514 0.336 0.444 f20 0.501 0.516 0.355 0.289 0.471 0.549 f21 0.530 0.384 0.507 0.339 0.425 0.468
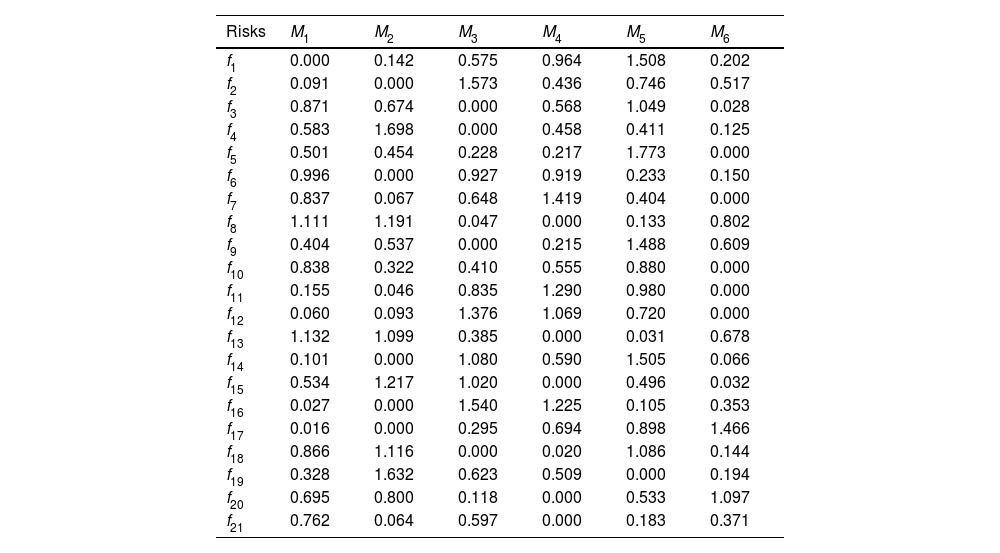
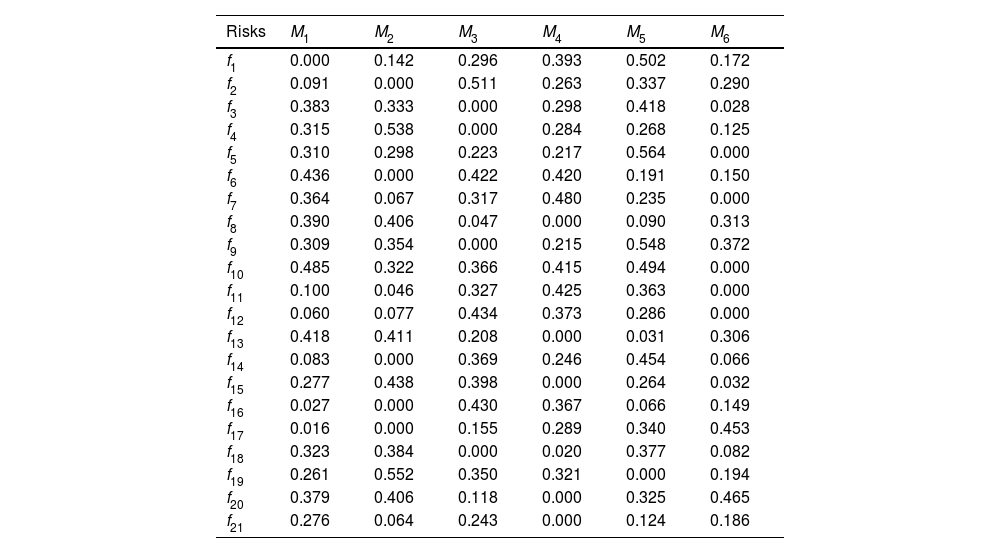
Steps 6–7: Based on the score-matrix, the OGDS (si) is calculated by Eqs. (17)-(18), while the OLDS (si) is computed by Eqs. (19)-(20), which are given in Table 9 and Table 10, respectively.
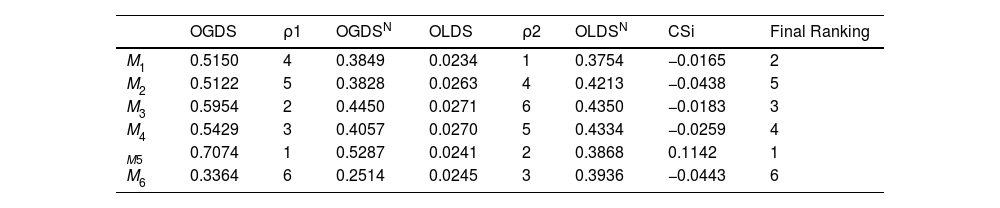
Step 8: By Eq. (21), the collective scores of the alternatives are derived and depicted in Table 11. Therefore, M5≻M1≻M3≻M4≻M2≻M6. That is to say, the industry-V (M5) is the best choice to assess the risks for DET in the manufacturing industry.
Table 11.The collective scores of the industry to assess the risks for DET in the manufacturing industry.
OGDS ρ1 OGDSN OLDS ρ2 OLDSN CSi Final Ranking M1 0.5150 4 0.3849 0.0234 1 0.3754 −0.0165 2 M2 0.5122 5 0.3828 0.0263 4 0.4213 −0.0438 5 M3 0.5954 2 0.4450 0.0271 6 0.4350 −0.0183 3 M4 0.5429 3 0.4057 0.0270 5 0.4334 −0.0259 4 M5 0.7074 1 0.5287 0.0241 2 0.3868 0.1142 1 M6 0.3364 6 0.2514 0.0245 3 0.3936 −0.0443 6
The UGDSs of each option.
| Risks | M1 | M2 | M3 | M4 | M5 | M6 |
|---|---|---|---|---|---|---|
| f1 | 0.000 | 0.142 | 0.575 | 0.964 | 1.508 | 0.202 |
| f2 | 0.091 | 0.000 | 1.573 | 0.436 | 0.746 | 0.517 |
| f3 | 0.871 | 0.674 | 0.000 | 0.568 | 1.049 | 0.028 |
| f4 | 0.583 | 1.698 | 0.000 | 0.458 | 0.411 | 0.125 |
| f5 | 0.501 | 0.454 | 0.228 | 0.217 | 1.773 | 0.000 |
| f6 | 0.996 | 0.000 | 0.927 | 0.919 | 0.233 | 0.150 |
| f7 | 0.837 | 0.067 | 0.648 | 1.419 | 0.404 | 0.000 |
| f8 | 1.111 | 1.191 | 0.047 | 0.000 | 0.133 | 0.802 |
| f9 | 0.404 | 0.537 | 0.000 | 0.215 | 1.488 | 0.609 |
| f10 | 0.838 | 0.322 | 0.410 | 0.555 | 0.880 | 0.000 |
| f11 | 0.155 | 0.046 | 0.835 | 1.290 | 0.980 | 0.000 |
| f12 | 0.060 | 0.093 | 1.376 | 1.069 | 0.720 | 0.000 |
| f13 | 1.132 | 1.099 | 0.385 | 0.000 | 0.031 | 0.678 |
| f14 | 0.101 | 0.000 | 1.080 | 0.590 | 1.505 | 0.066 |
| f15 | 0.534 | 1.217 | 1.020 | 0.000 | 0.496 | 0.032 |
| f16 | 0.027 | 0.000 | 1.540 | 1.225 | 0.105 | 0.353 |
| f17 | 0.016 | 0.000 | 0.295 | 0.694 | 0.898 | 1.466 |
| f18 | 0.866 | 1.116 | 0.000 | 0.020 | 1.086 | 0.144 |
| f19 | 0.328 | 1.632 | 0.623 | 0.509 | 0.000 | 0.194 |
| f20 | 0.695 | 0.800 | 0.118 | 0.000 | 0.533 | 1.097 |
| f21 | 0.762 | 0.064 | 0.597 | 0.000 | 0.183 | 0.371 |
The ULDSs of each option.
| Risks | M1 | M2 | M3 | M4 | M5 | M6 |
|---|---|---|---|---|---|---|
| f1 | 0.000 | 0.142 | 0.296 | 0.393 | 0.502 | 0.172 |
| f2 | 0.091 | 0.000 | 0.511 | 0.263 | 0.337 | 0.290 |
| f3 | 0.383 | 0.333 | 0.000 | 0.298 | 0.418 | 0.028 |
| f4 | 0.315 | 0.538 | 0.000 | 0.284 | 0.268 | 0.125 |
| f5 | 0.310 | 0.298 | 0.223 | 0.217 | 0.564 | 0.000 |
| f6 | 0.436 | 0.000 | 0.422 | 0.420 | 0.191 | 0.150 |
| f7 | 0.364 | 0.067 | 0.317 | 0.480 | 0.235 | 0.000 |
| f8 | 0.390 | 0.406 | 0.047 | 0.000 | 0.090 | 0.313 |
| f9 | 0.309 | 0.354 | 0.000 | 0.215 | 0.548 | 0.372 |
| f10 | 0.485 | 0.322 | 0.366 | 0.415 | 0.494 | 0.000 |
| f11 | 0.100 | 0.046 | 0.327 | 0.425 | 0.363 | 0.000 |
| f12 | 0.060 | 0.077 | 0.434 | 0.373 | 0.286 | 0.000 |
| f13 | 0.418 | 0.411 | 0.208 | 0.000 | 0.031 | 0.306 |
| f14 | 0.083 | 0.000 | 0.369 | 0.246 | 0.454 | 0.066 |
| f15 | 0.277 | 0.438 | 0.398 | 0.000 | 0.264 | 0.032 |
| f16 | 0.027 | 0.000 | 0.430 | 0.367 | 0.066 | 0.149 |
| f17 | 0.016 | 0.000 | 0.155 | 0.289 | 0.340 | 0.453 |
| f18 | 0.323 | 0.384 | 0.000 | 0.020 | 0.377 | 0.082 |
| f19 | 0.261 | 0.552 | 0.350 | 0.321 | 0.000 | 0.194 |
| f20 | 0.379 | 0.406 | 0.118 | 0.000 | 0.325 | 0.465 |
| f21 | 0.276 | 0.064 | 0.243 | 0.000 | 0.124 | 0.186 |
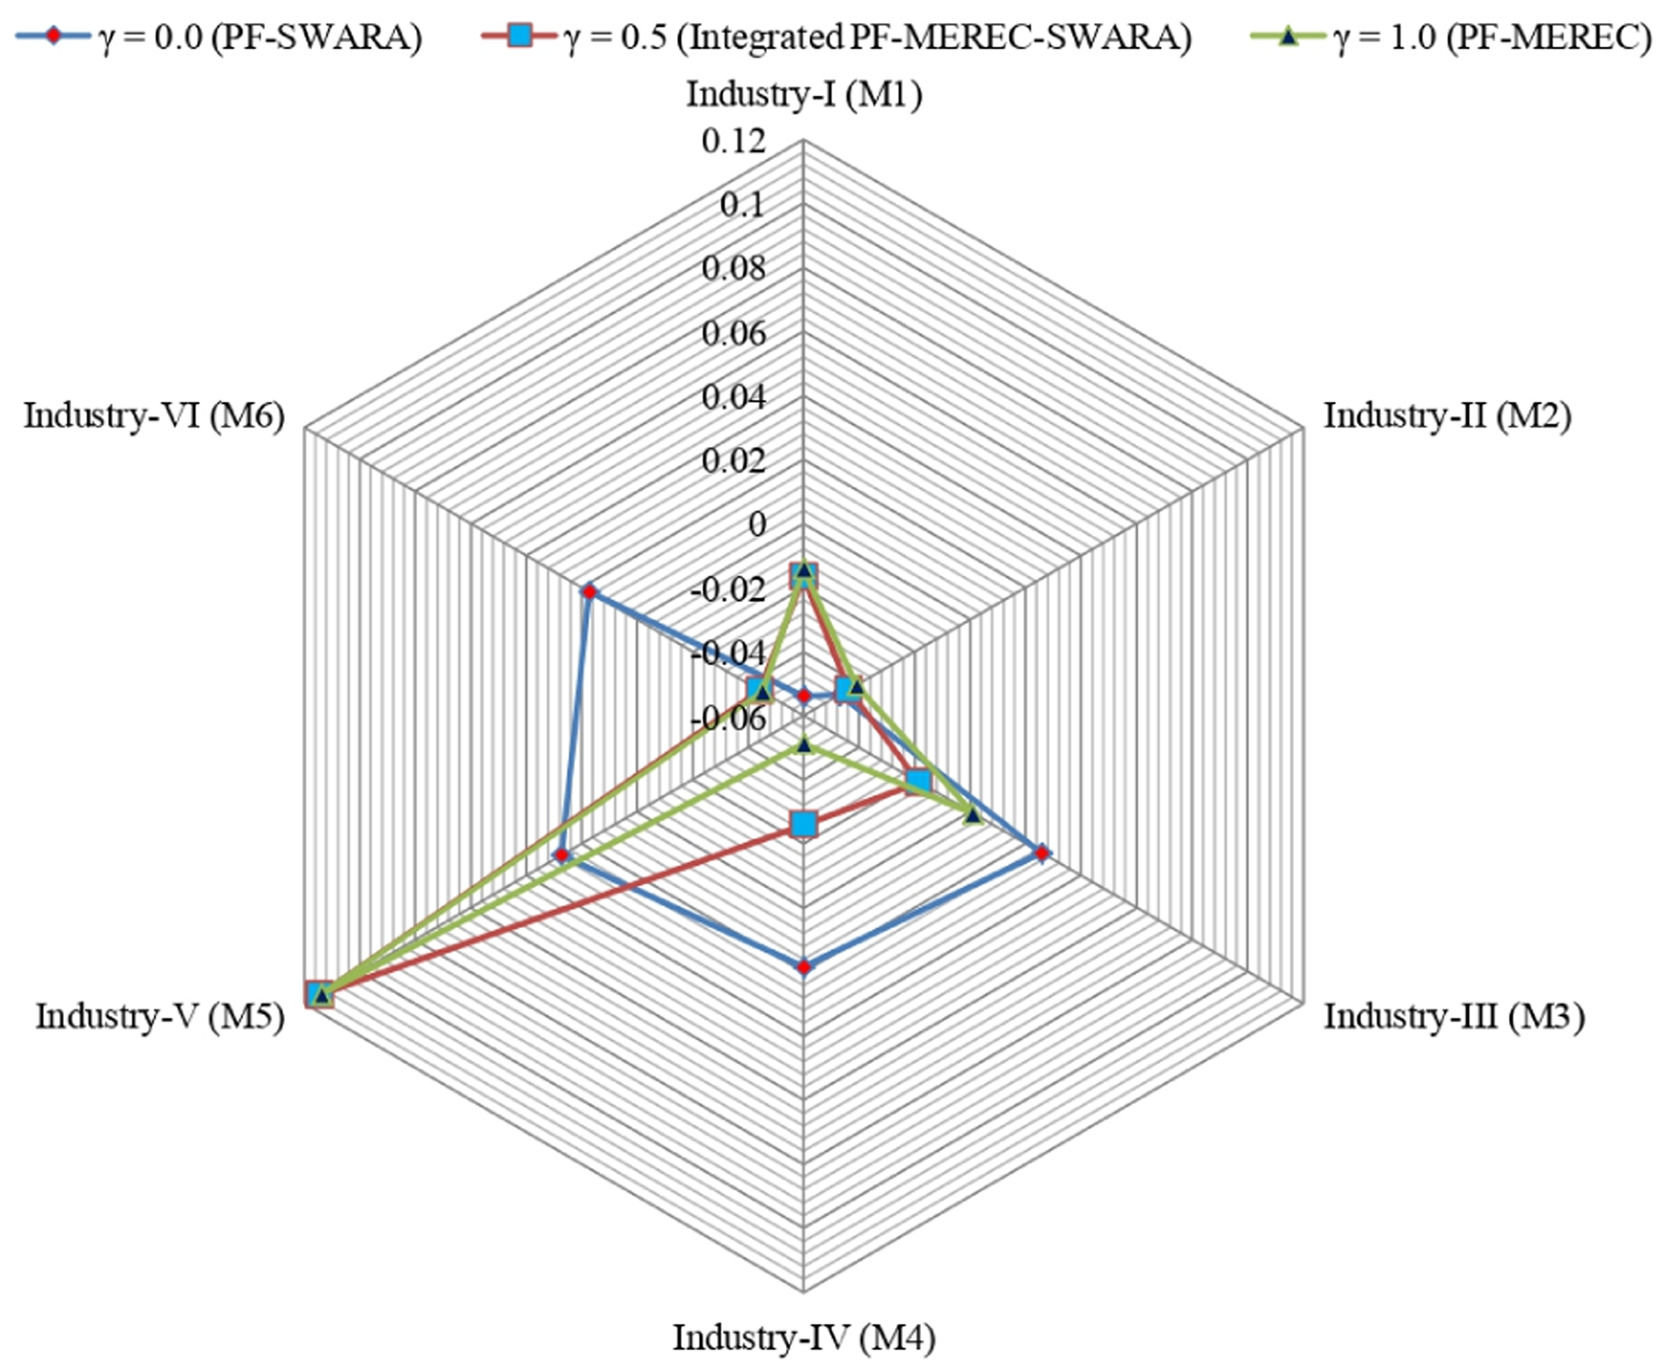
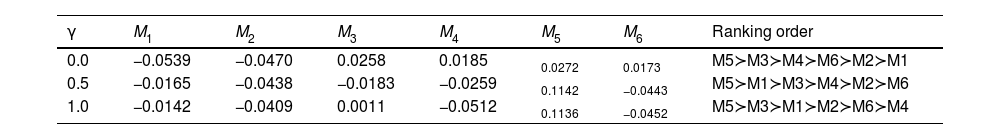
In this subsection, a sensitivity investigation is made on parameter γ. The γ variation helps to assess the approach's sensitivity degree, which changes from objective weighting to subjective weighting procedures. Moreover, variation of γvalues is used for the assessment of the sensitivity of the presented model to the distinction of attribute weights.
Table 12 and Fig. 2 exemplify the sensitivity investigation of the options for diverse utility values of parameter γ. According to the evaluations performed, we achieve the prioritization of industries for the most important risk for digital economy transformation in the manufacturing industry as M5≻M3≻M4≻M6≻M2≻M1 when γ=0.0 using the PF-SWARA weighting procedure, M5≻M1≻M3≻M4≻M2≻M6 when γ=0.5 using the integrated PF-MEREC-SWARA weighting procedure and M5≻M3≻M1≻M2≻M6≻M4 when γ=1.0 using the PF-MEREC weighting procedure, which implies M5 is at the top of the ranking for each value of γ. while the e6 has the last rank for γ=0.0 to γ=1.0. As a result, it can be observed that the presented model is adequately stable with many parameter values. Furthermore, as Table 12 demonstrates, the developed PF-MEREC-SWARA-GLDS method can produce preference results of both stability and flexibility with different utility parameters. This characteristic is highly significant for the MCDM procedures and decision-making reality.
Comparison with extant models
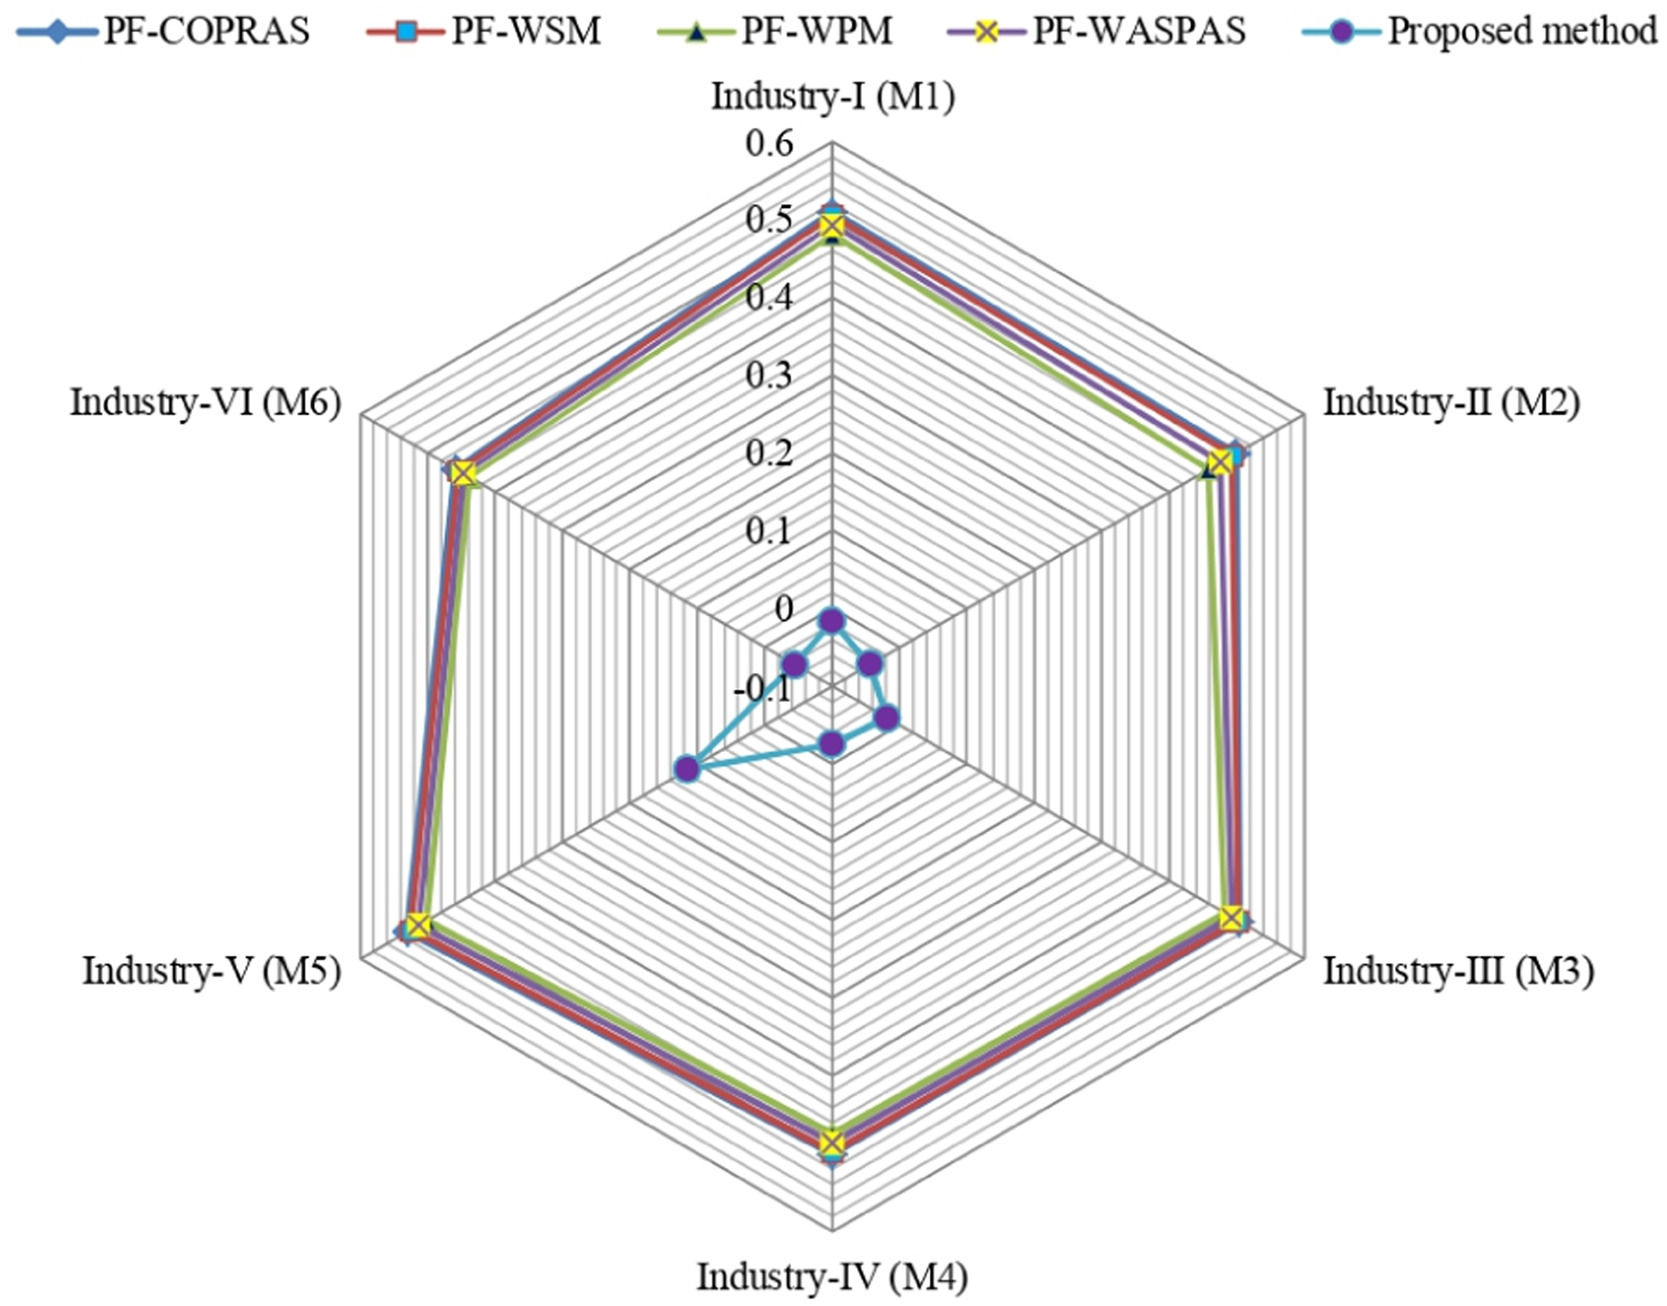
In the current part of the study, we present a comparative study between the proposed and existing PF-COPRAS model (Alipour et al., 2021) and PF-WASPAS (Rani et al., 2020b) for solving MCDM problems under PFSs context as follows:
PF-COPRAS modelSteps 1–4: Same as the presented model
Step 5: Since all attributes are of benefit-type; thus, we find the assessment rating of each option as βi=⊕j=1nwjςij,i=1,2,...,m, which is the same as the “relative degree (RD)” of each option. Hence, we get RD1 = 0.5088, RD2 = 0.4984, RD3 = 0.5036, RD4 = 0.5001, RD5 = 0.5297 and RD6 = 0.4578.
Step 6: Find the prioritization using the RDi of these manufacturing industries as RD5≻RD1≻RD3≻RD4≻RD2≻RD6. The ranking describes that the industry-V (M5) is the optimal one among the others.
Step 7: Estimate the “utility degree (UD)” ui=RDiRDmax×100%. We obtain u1=96.05%,u2=94.09%,u3=95.07%,u4=94.41%u5=100.00%, and u5=86.43%.
By comparing with the PF-COPRAS method, the final ranking of the manufacturing industries is M5≻M1≻M3≻M4≻M2≻M6. and the best manufacturing industry is M5 for the different risks for DET in the manufacturing industry.
PF-WASPAS modelThe PF-WASPAS method is used for the purpose of handling the aforesaid MCDM problem as follows:
Steps 1–4: As the aforementioned model
Step 5: Find the weighted sum model (WSM) Ci(1) and weighted product model (WPM) Ci(2)degrees of each option as
Step 6: Obtain the UD of each option in the expression as


Step 7: According to the UDCi, rank the options.
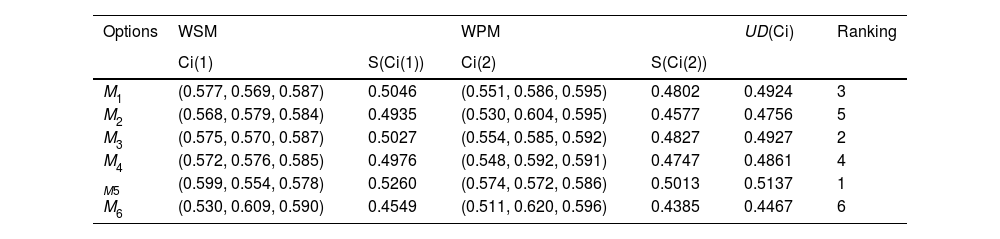
From Eq. (22)-Eq. (23), the values of both models are estimated. Then, the UD of each industry for the evaluation of the most important risk for DET in the manufacturing industry is estimated using Eq. (24) and presented in Table 13.
The UD of option to the evaluation of the risks for DET in the manufacturing industry.
| Options | WSM | WPM | UD(Ci) | Ranking | ||
|---|---|---|---|---|---|---|
| Ci(1) | S(Ci(1)) | Ci(2) | S(Ci(2)) | |||
| M1 | (0.577, 0.569, 0.587) | 0.5046 | (0.551, 0.586, 0.595) | 0.4802 | 0.4924 | 3 |
| M2 | (0.568, 0.579, 0.584) | 0.4935 | (0.530, 0.604, 0.595) | 0.4577 | 0.4756 | 5 |
| M3 | (0.575, 0.570, 0.587) | 0.5027 | (0.554, 0.585, 0.592) | 0.4827 | 0.4927 | 2 |
| M4 | (0.572, 0.576, 0.585) | 0.4976 | (0.548, 0.592, 0.591) | 0.4747 | 0.4861 | 4 |
| M5 | (0.599, 0.554, 0.578) | 0.5260 | (0.574, 0.572, 0.586) | 0.5013 | 0.5137 | 1 |
| M6 | (0.530, 0.609, 0.590) | 0.4549 | (0.511, 0.620, 0.596) | 0.4385 | 0.4467 | 6 |
The prioritization of options is M5≻M3≻M1≻M4≻M2≻M6. Thus, the industry-V (M5) option is the best one for evaluating the risks of digital economy transformation in the manufacturing industry.
As a whole, the benefits of the PF-MEREC-SWARA-GLDS method over the extant method are given as follows (see Fig. 3):
- ■
In the developed method, the subjective weights of risks are obtained by the PF-SWARA tool, and the objective weights of risks are computed by PF-MEREC, whereas in PF-WASPAS, only objective weights of risks are achieved with entropy and divergence measure-based weighting procedure, and in PF-COPRAS, the weights are obtained with the SWARA model.
- ■
The PF-MEREC-SWARA-GLDS method introduced in this study is capable of providing a more precise elucidation under uncertain settings. This capacity is due to the computation of the criteria and DEs’ weights and their application to the processes of the developed framework. In addition, two dominance scores-based procedures as vital concepts in the presented framework lead the computational outcomes to a reliable one.

The increase in the data flows paved the way for the transition into a new level of economic processes management that, in turn, helps to analyze the economic activities of companies more accurately. New databases help users to forecast the economic processes in companies. New smartphones, together with the internet, aid users in creating digital models of consumers and technological processes, which results in resource savings. The increase in the utilization of digital devices has caused ‘big data’ to emerge. As noted earlier, the foundation of the digital economy is to work with these data. The digital economy makes the stage ready for communicating ideas and experiences. Digital technologies have significant roles in training and knowledge sharing and also in implementing new ideas in both professional and social environments. Accordingly, the significance of the digital economy to the success of companies must be highlighted and adequately supported. The literature needs to pay more attention to the problems related to risk analysis. The underestimation of the effects of risks upon the transformation process inhibits the formation of a mature digital economy. Some countries are cut off from global information communications. Such countries fail to switch to a digital type of functioning in their economic systems. Inequality has been reported to be one of the reasons for the institutions’ poor functioning. As a result, the technological and geopolitical conflicts among the leading countries are one of the key risk indicators from the perspective of ensuring national security issues directly related to technological risks. Therefore, in this study, to analyze, prioritize and evaluate the main risks for DET in the manufacturing industry, an integrated decision-making method using the PF-MEREC-SWARA and the PF-GLDS models called the PF-MEREC-SWARA-GLDS approach is introduced. To rank the main risks for DET in the manufacturing industry, the PF-MEREC-SWARA is utilized, and to find the prioritization of different industries for the evaluation of the risks for digital economy transformation in the manufacturing industry, the PF-GLDS method is used. To elucidate the results of this study, sensitivity and comparison assessments with the PF-COPRAS, PF-WSM, PF-WPM, and PF-WASPAS methods are discussed.
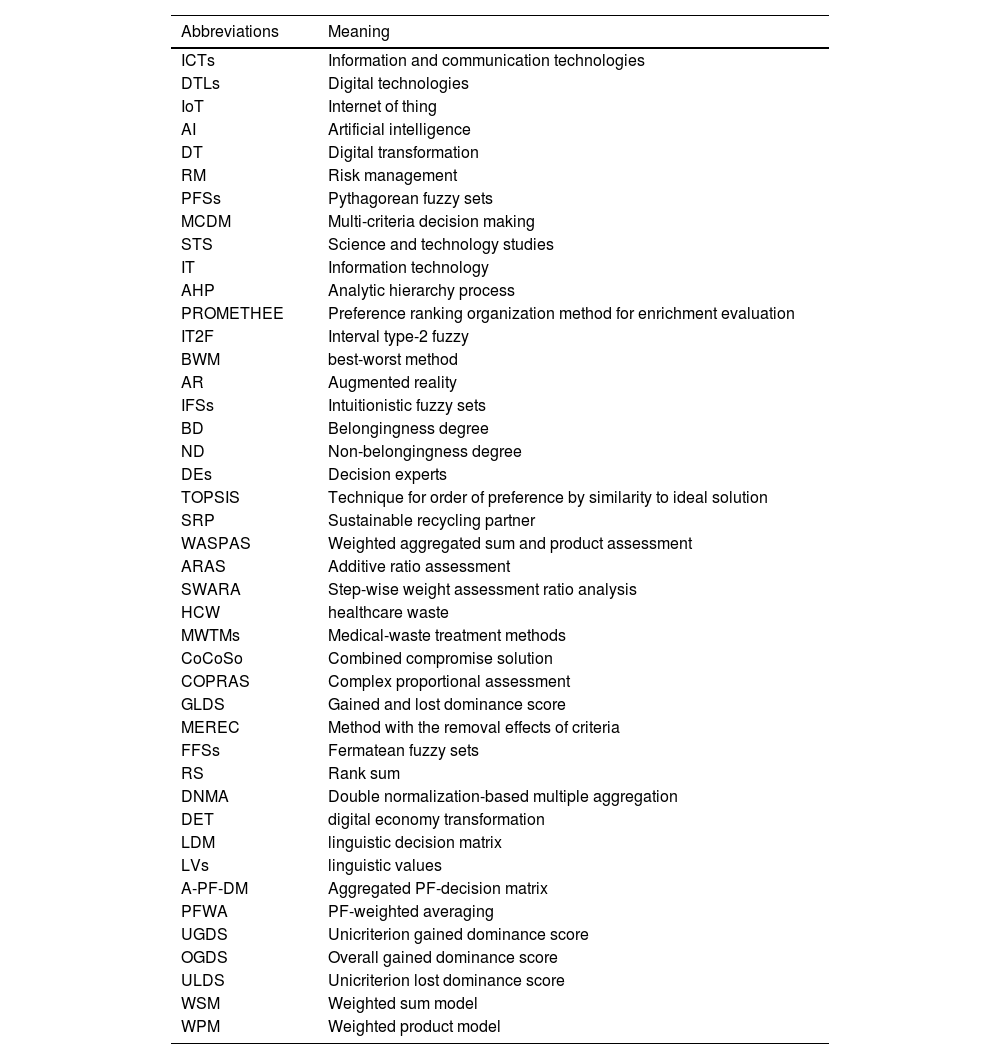
Definition of abbreviations.
| Abbreviations | Meaning |
|---|---|
| ICTs | Information and communication technologies |
| DTLs | Digital technologies |
| IoT | Internet of thing |
| AI | Artificial intelligence |
| DT | Digital transformation |
| RM | Risk management |
| PFSs | Pythagorean fuzzy sets |
| MCDM | Multi-criteria decision making |
| STS | Science and technology studies |
| IT | Information technology |
| AHP | Analytic hierarchy process |
| PROMETHEE | Preference ranking organization method for enrichment evaluation |
| IT2F | Interval type-2 fuzzy |
| BWM | best-worst method |
| AR | Augmented reality |
| IFSs | Intuitionistic fuzzy sets |
| BD | Belongingness degree |
| ND | Non-belongingness degree |
| DEs | Decision experts |
| TOPSIS | Technique for order of preference by similarity to ideal solution |
| SRP | Sustainable recycling partner |
| WASPAS | Weighted aggregated sum and product assessment |
| ARAS | Additive ratio assessment |
| SWARA | Step-wise weight assessment ratio analysis |
| HCW | healthcare waste |
| MWTMs | Medical-waste treatment methods |
| CoCoSo | Combined compromise solution |
| COPRAS | Complex proportional assessment |
| GLDS | Gained and lost dominance score |
| MEREC | Method with the removal effects of criteria |
| FFSs | Fermatean fuzzy sets |
| RS | Rank sum |
| DNMA | Double normalization-based multiple aggregation |
| DET | digital economy transformation |
| LDM | linguistic decision matrix |
| LVs | linguistic values |
| A-PF-DM | Aggregated PF-decision matrix |
| PFWA | PF-weighted averaging |
| UGDS | Unicriterion gained dominance score |
| OGDS | Overall gained dominance score |
| ULDS | Unicriterion lost dominance score |
| WSM | Weighted sum model |
| WPM | Weighted product model |