


Edited by: Brij B. Gupta, Kwok Tai Chui
More infoIt is essential to adhere to innovative leadership and teach students in accordance with their aptitude through the sustainable development of higher education. Promoting high-quality development of local universities is demanded and needed for the adaptive talent in this new era. This work aims to explore how high-quality higher education can provide innovative decision-making solutions for economic development in the digital economy (DE) era. First, the role of higher education in economic development is analysed. Then, the importance of human capital cultivated by higher education to economic development is explained. The innovations are as follows. (1) A high-quality economic development index system in the Yangtze River Basin is established according to the requirements of quality change, dynamic change, and efficiency change in the economic development of the Yangtze River Economic Zone (YREZ). (2) The entropy weight method in intelligent decision-making and TOPSIS sorting technology are used to study the dynamic relationship between DE development and the premium-quality economic advance of the provinces and cities in the YREZ from 2015 to 2021. (3) The analysis part adopts three indicators of mean logarithmic deviation, Theil index, and the Gini coefficient to discuss the regional differences in economic development. Finally, a targeted development strategy is proposed. The results indicate that the DE level of each province in the YREZ in recent years has reached a maximum of 3.9309 and a minimum of 0.2844. The economic development of each province is relatively different, and the level of development is uneven. The overall Moran's I of the premium-quality economic development level of the YREZ in recent years is greater than 0, passing the significance test. This result suggests a positive spatial autocorrelation between them. The research provides data support for the formulation of economic development strategies for the YREZ in the future and reflects the key role of higher education in human capital training and economic development.
The digital economy (DE) is different from the agricultural economy and industrial economy. It is a brand-new economy with new kinetic energy and presentation form. In the era of knowledge as the primary productive force, it has gradually caused profound changes in the entire society and economy. Only a combination of innovation and knowledge can give birth to a rapidly growing economy. China's economy has transformed from rapid growth to high-quality development. The supply and demand and future trends of cloud computing, the Internet of Things (IoT), big data, and artificial intelligence talent worldwide are constantly changing with the development of DE (Kolesnikov et al., 2020; Sadovaya, 2019). Since society entered the information age, the rapid development and broad application of digital technology have produced digital e-commerce. Under the wave of DE, the importance of human skills that technology cannot wholly replace has become increasingly prominent (Viriyasitavat et al., 2020; Mukhtorovna, 2021; Sturgeon, 2021). Higher education, as an important means of investment in human capital, is gradually becoming central to the promotion of high-quality economic development. In addition, higher education, with the development of high-quality human capital at its core, has clearly become a key component of the regions’ efforts (Brekke, 2021; Sonita et al., 2021; Zhou & Luo, 2018).
The DE drives China's comprehensive economic reform and upgrading. Simultaneously, the digital transformation of education ushers in an era of fast growth. Extensive study is required to propel tertiary education to a new stage of development and advance economic digitization (Ding et al., 2021; Holford, 2019; Saeedi & Visvizi, 2021). There are regional inequalities in tertiary education throughout its evolution, as an essential component of talent capital training.
The contribution of various degrees of education to high-quality economic progress varies by area (Akhmadjonovich & Abdusalomovich, 2022; Omodero & Nwangwa, 2020; Sachs, 2019). Moreover, fostering the entrepreneurial spirit of college students can produce qualified entrepreneurs for future economic progress. College students' capacity for creativity and entrepreneurship will influence the development of the DE in implementing tertiary education. An era of intense promotion of digital transformation and growth calls for research into the effect and role of various educational tiers in the creation of a high-quality economy in the digital age, as well as the establishment of a strategy for economic development tailored to the prevailing conditions. Data resources are a crucial component of the DE, and current information networks are its primary transport mechanism. It also uses the integrated application of information and communication technology and the digital transformation of all elements as a vital driving force to promote a new economic form that is both equitable and efficient (Chen & Wang, 2019; Chen et al., 2022; Teece, 2018). The development strategy of the DE has steadily become the driving force behind sustained economic expansion. There are still numerous issues with digital core technology, digital talent education, digital infrastructure construction, and government policy assistance (Liu et al., 2021; Liu et al., 2018; Ye, 2022).
Few initiatives for high-quality economic development can be adopted at now, according to the evidence presented. Therefore, additional examination and research on the status are necessary to facilitate the transformation of the DE. To this goal, a questionnaire survey is conducted, and the impact of human capital on high-quality economic growth, along with related research findings, are discussed. First, an innovative evaluation index system of high-quality and regional economic development levels is established for the Yangtze River Economic Zone (YREZ). Then, the Technique for Order Preference by Similarity to Ideal Solution (TOPSIS) and the improved Entropy Weight Method (EWM) comprehensively evaluates the YREZ indicators and provide constructive feedback. This work can generate fresh research ideas for the advancement of DE.
The follow-up study is divided into four sections. Section 2 covers recent research findings in the relevant topic. Section 3 includes three parts: a high-level analysis of the role of education in high-quality economic development, research on the impact of the level of DE on high-quality economic growth based on intelligent decision-making, and the implementation of smart decision-making for high-quality development of the DE. Section 4 presents and discusses the specific results. Section 5 summarizes the existing research and limitations of this work and proposes future research plans.
Related workDE has a broad meaning that encompasses all economic forms that directly or indirectly use data to direct resources and increase production. Humanity has entered the DE era on the back of a surge of new scientific and technological innovations and industrial revolutions, particularly the widespread use of next-generation information technologies like Big Data, AI, mobile Internet, and Cloud Computing. Adhering to the objective rules of economic development and sustaining China's economic growth necessitates the promotion of high-quality economic development. DE emerged in the backdrop of the digital age (Ma et al., 2019; Shi et al., 2020). Existing study by specialists and academics focuses on how to effectively boost the growth of DE and achieve superior economic advancements.
Li et al. (2020) evaluated the strategy of new value chains to alter country-level participation in global manufacturing and offered Smile Curve Theory predictions for high-tech businesses and their economic advance in Asian global value chains. They concluded that digital entrepreneurship in Asian countries entailed the transformation of business processes through technological innovation, government growth policies, and digital entrepreneurship. They also considered the research orientation driven by platform economy, data analysis, AI, fintech innovation, digital trade, and economic and social sustainability. Jiang (2020) reviewed the effect of Digital Twins (DTs) on mitigating COVID-19, maintaining routine life, and evolving China's DE toward long-term growth. The report revealed that DTs have powered short-dated tactics for the onset of epidemics. In the long run, DT will serve as the technical underpinning of the Industrial IoT and the Consumer Internet and the driving force for the unified growth of service and manufacturing sectors. Positive trends have been observed in the government's DE Policy-supported expansion of the DE over the long run. Pan et al. (2022) utilized ensemble regression to inspect the positive impact of the DE creation on Total Factor Productivity (TFP) in China using the data containing the provincial TFP solved by the paired method and the DE indicator. They discovered a positive and nonlinear correlation between the DE indicator and provincial TFP. The findings demonstrated that DE is an innovative driving force for wide DE indicators and TFP sustainability. Nonetheless, there is regional regularity, with digitalization in eastern China propelling the creation of high-quality TFP, whereas the central and western regions are relatively poor.
Agasisti et al. (2021) investigated the correlation between the efficacy of the Russian local tertiary education system (LTES) and the progress of the territorial economy from 2012 to 2015. The authors analyzed two-stage semiparametric data envelopment, calculated efficiency values for educational institutions, and compiled the scores across regions. In addition, they developed an economic gain model that takes the efficacy of the LTES as an explanatory variable. These findings underscored the favorable and statistically significant relationship between the efficiency of tertiary education institution and regional economic growth. China's economy is transitioning from a stage of high-speed growth driven by labor and capital to an era of high-quality development driven by innovation. An intelligent environment developed with a new generation of cyber-physical systems can reach a high concentration of information resources (Lv et al., 2020). Deep learning approaches' distinctive feature extraction techniques can still play a critical role in research in various fields (Xie et al., 2021). Zhou et al. (2020) incorporated the government's propensity for technical creation into the traditional neoclassical economic advance model as a factor affecting the internal growth model and the efficacy of capital collection. The authors hypothesized that public funds were allocated to public and research expenditures. They analyzed the effect of technological innovation preferences on the economy and their effect on premium-quality economic advancements. They reasoned that if the government boosted its respect for technical innovation, duty rates and growth ratios would rise but the proportion of public utility expenditures would fall.
Ma and Zhu (2022) assessed the DE level and high-quality green development of Chinese cities to reveal the mechanism and impact of DE within a coherent framework. They discovered that combining green technology and innovative industrial restructuring can promote high-quality economic development. Wang et al. (2022) utilized a dynamic panel model to estimate the link between the DE and high-quality economic growth for Chinese provincial panel dataset from 2007 to 2017. They also explored its heterogeneity impact. The results showed that for the high-quality economic development index increases by 0.191% for every 1% increase in the DE index. According to these findings, the DE has a favorable effect on China's high-quality economic development. In regions with a higher DE score and high-quality economic development index, the DE significantly affects high-quality economic development, as demonstrated by the heterogeneity results. Nonetheless, the economic ecology of diverse businesses and regions varies. In addition, Ma et al. (2022) reported that despite the fact that the digital economy is overgrowing, it is crucial to take advantage of all of its benefits and deal with its problems, such as a lack of highly qualified workers and jobs. Marginson (2019) claimed that human capital theory imposes a single linear path on the complex pathway between heterogeneous education and work. It cannot explain how education boosts productivity, why wages become uneven, or the function of status. The writers outlined the limitations of human capital theory on productivity. In other words, human capital, as a key output of tertiary education, is constrained in its ability to promote productivity growth. In addition, sufficient practical experience is required to validate the relationship between education and production for economic growth.
In conclusion, China's ecological development and environmental pollution problems are growing increasingly serious due to its rapid economic expansion. The relationship between DE development and high-quality economic development is inextricable. However, the role of human capital in promoting economic development still has certain limitations. Therefore, a high-quality economic development model is conducive to attaining a win-win situation of high-quality economic development and carbon emission reduction under China's existing Carbon Neutrality objective restrictions. China has embraced a resource-driven economic development strategy. Still, there are obstacles to its success, such as severe ecological and environmental pressure. Therefore, in addition to establishing appropriate economic indicators, the impact of environmental factors and human capital on economic development should be assessed to achieve qualitative economic growth.
Research purposes and methodAnalysis of the contribution of tertiary education in premium-quality economic advanceHigh-quality economic advance lies in the economy's vitality, competitiveness, and innovation, and supply-side structural reform (Kar et al., 2019). Promoting high-quality development is an unavoidable prerequisite for maintaining long-term and healthy economic growth, responding to changes in China's major contradictions, constructing a moderately prosperous society in all areas, and creating a modern socialist country in all aspects. DTs' research & development (R&D) and innovation are the driving forces behind economic expansion. All of these require the assistance of superior human capital. Education is the primary means of developing human capital. The final complete quality of talent is influenced by the quality of education, the caliber of teachers, and the educational setting (Miethlich et al., 2020). The development and transformation of the knowledge economy is the fundamental way to promote premium-quality economic progress. Human capital's significance to economic growth is determined by the period of the information economy. Fig. 1 reveals the mechanism by which education contributes to superior economic growth.

According to the laws of talent development, the educational approach and content must vary among age groups. They have distinct forces on economic advance. Figure 1 demonstrates that education consists of primary education, secondary education, and tertiary education. Tertiary education contributes greatly to economic growth since it directly faces social employment and the training of scientists and engineers. The Internet can have a nonlinear impact on the quality of economic development due to its unique network effect, superior technology, and lack of time and geographical limits. Additionally, the Internet+ education model encourages economic development via direct products and industrial upgrading. Education fosters high-quality economic development from three aspects: changes in quality, efficiency, and dynamics.
First, tertiary education may give premium-quality talents for premium-quality economic progress and contribute to altering the quality of economic progress by cultivating diverse and specialized talents. A talent supply system that is on par with the degree of economic development is required for premium-quality economic growth. This is an educational system. In particular, the DE mandates the adoption of a digital talent training model by the education system to avoid delivering a cognitively detached workforce.
Second, education increases labor productivity through the accumulation of human capital, altering the efficiency of economic advancements and fostering premium-quality economic advances. Specifically, labor expenses continue to rise when the number of laborers is no longer expanding. It is vital at this time to modify the quality of labor to achieve a constant increase in labor productivity. Education boosts the efficacy of economic growth by increasing labor productivity, hence fostering a superior economic advance.
Lastly, tertiary education employs the accumulation of information to inspire, which can bring dynamic changes for economic advance and create premium-quality economic improvement. The reason is that education enables the knowledge-bearer to realize the transformation from material to life. The knowledge capital possessed by talents in economic activities is manifested as innovation ability. Education in innovation and entrepreneurship fosters innovative individuals with the knowledge and ability to innovate. It is conducive to enterprise product innovation and technological progress, ultimately promoting enterprise development and achieving economic progress.
Investigation of the impact of DE level on premium-quality economic advance based on intelligent decision-makingDE has gradually transformed into a new driving force for the premium-quality development of China's economy, affecting all aspects of the development of the national economy. Fig. 2 depicts the ecosystem organization of DE.

The DE ecology consists of an environmental service system, an infrastructure support system, a technical support system, an application service system, and a standard rule system, as depicted in Fig. 2. The extent of DE's impact on premium-quality economic advance warrants additional research. Promoting premium-quality development is essential for adhering to the laws of economic advancement and maintaining sustainable and healthy economic advances. Fig. 3 displays examples of premium-quality economic enhancement initiatives.

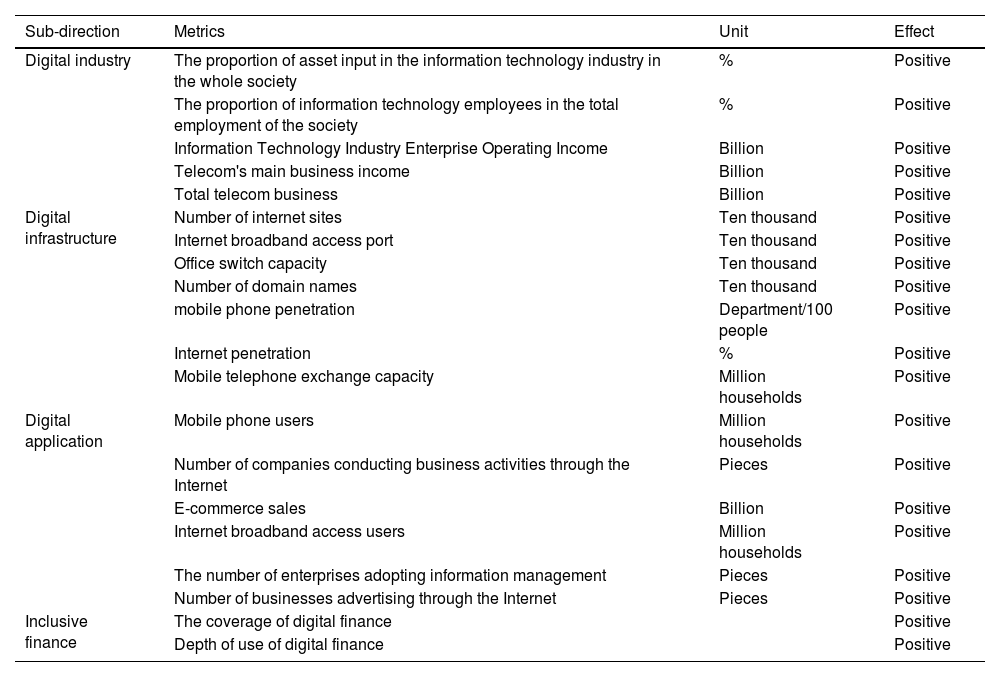
As the economic core of China's future, the YREZ requires economic characteristics reliant on high-tech and information. It encompasses 11 provinces and cities in the east, center, and west of China, including Shanghai, Jiangsu, Zhejiang, Anhui, Jiangxi, Hubei, Hunan, Chongqing, Sichuan, Yunnan, and Guizhou. It is a coordinated development belt of interaction and cooperation between east, west, and central regions of China. Therefore, this work studies the impact of the DE in the YREZ on premium-quality economic advances. The premium-quality development of the YREZ is divided into three aspects to study based on the above analysis of the connotation of premium-quality advance and the mechanism analysis of the impact of the DE: quality change, dynamic change, and efficiency change. The construction of an indicator system for premium-quality economic development must adhere to scientific, systematic, practical, and dynamic principles. This work selects 20 indicators to build the high-quality development index system of the YREZ based on the three directions of quality change, dynamic change, and efficiency change, as indicated in Table 1.
An evaluation index system for the superior level economic development of the YREZ.
Note: "Negative" indicates that a lesser value indicates better performance. "Positive" suggests that a large value indicates excellent performance.
Environmental quality is assessed using the ratio of pollutant intensity to Gross National Product. As the cornerstone of premium-quality economic development, quality change indicators include traditional product and service quality, environmental quality improvement, and product quality optimization. The calculation method of pollutant emission intensity is as follows. Firstly, the Analytic Hierarchy Process method calculates the weight of three pollutants: wastewater, sulfur dioxide, and soot. The respective weight results are 0.342, 0.361, and 0.297. The pollutant emission intensity is calculated using Eq. (1).

In Eq. (1), γi represents the emission intensity of pollutants in the ith area; wj signifies the weight of the pollutants; xij refers to the discharge amount of the jth pollutant in the ith area. Three kinds of pollutants are mentioned above, so the value range is j = 1, 2, 3. As the core goal of high-quality development, efficiency change indicators include resource element allocation and collaboration efficiency. Capital efficiency and labor efficiency are resource considerations. Since the YREZ includes 11 provinces and cities, the value of I ranges from 1 to 11.

In Eq. (2), Korepresents the initial capital stock;g stands for the investment growth rate; δ represents the capital depreciation rate; Io indicates the amount of capital investment. Then, the capital stock from 2017 to 2021 is expressed as Eq. (3).

In Eq. (3), pt represents the capital price index.
The DE progress of the YREZ is evaluated from four aspects: digital industries, digital infrastructure, digital applications, and inclusive finance. Twenty sub-indicators are picked from these four directions to form the digital economic level indicator evaluation system of the YREZ, as presented in Table 2.
An assessment indicator system for the DE level of the YREZ.
Note: "Negative" means that the smaller the value, the better the performance. "Positive" means that the larger the value, the better the performance.
Here, the improved EWM is adopted to quantitatively assess the link between premium-quality development and DE level. EWM is frequently employed to calculate weights. It is a measure of the linear dependence between a random variable and a group of random variables and an explanation, derived from the fundamental concepts of information theory. Entropy is a measure of the degree of disorder in a system. The greater the index's weight, the greater its importance in the overall rating. EMW is enhanced by combining temporal data with regional variables.
Assume that there are p years, m regions, and n indicators. Then, the data standardization process is executed. Positive and negative indicator normalization procedures are indicated by Eqs. (4) and (5).


In Eqs. (4) and (5), xtij represents the index value of the jth item in the ith region; xmax denotes the maximum value of the jth index; xminrefers to the minimum value of the jth indicator; xtij` denotes the standardized value.
Eq. (6) determines the value ratio of the ith sample indicator under the jth indicator.

Then, the information entropy value of the jth index can be written as Eq. (7).

In Eq. (7), k represents a constant, as presented in Eq. (8).

Eq. (9) describes the information entropy redundancy dj.

The weight of the jth indicator wj is calculated according to Eq. (10).

The multi-objective decision-making method, TOPSIS, was adopted to calculate the comprehensive evaluation value of the premium-quality advance and DE level of the YREZ. It is a thorough approach for measuring distance that sorts the evaluation objects according to their proximity to the ideal object. The distance between each sample and the positive and negative ideal solutions is measured by assuming the positive and negative ideal solutions. Besides, their relative closeness to the ideal solution is obtained to rank the merit of each evaluation object. In other words, the result is further from the negative ideal solution the closer it is to the positive ideal solution. First, the decision matrix is constructed. Eqs. (11) and (12) describe, the scheme set and the indicator set respectively.


The value of the scheme Mi to the indicator Dj is xij. Then, the decision matrix X can be expressed as Eq. (13).

The positive and negative indicators perform dimensionless processing on the decision matrix.


In Eqs. (14) and (15), vij represents the normalized value; max(xj) and min(xj) represent the maximum and minimum values of the jth index, respectively.
Then, a weighted decision matrix is built according to Eqs. (16) and (17).


Then, the positive and negative ideal solutions are calculated according to Eqs. (18) and (19).


In addition, the Euclidean distance is employed to determine the distance between the different schemes and the positive and negative ideal solutions:


Moreover, the relative fit ηi of different schemes and positive ideal solutions can be described as Eq. (22).

The greater the value of ηi, the closer the decision plan Mi to the positive ideal solution, and the better the plan. This work incorporates the above EWM with TOPSIS. First, the index weight is determined using EWM. Then, the final evaluation results are determined by combining the weights obtained with the specific values of the indicators in each year of the YREZ.
The data set here comes from 11 provinces and cities (Shanghai, Jiangsu, Zhejiang, Anhui, Jiangxi, Hubei, Hunan, Chongqing, Sichuan, Yunnan, and Guizhou) in the YREZ. Their panel economic development index data from 2015 to 2021 are used to calculate the weight of each indicator as a data set.
There are apparent district disparities between the premium-quality economic advance and the DE level. The mean log deviation (MLD), Theil index (Theil), and the Gini coefficient (GINI) are selected to measure the difference, which are calculated according to:
where N represents the number of regions; µ refers to the average value of premium-quality economic advance and the DE level; yi denotes the level of provinces and cities in the YREZ.


In Eq. (25), n represents the number of samples; yi denotes the level of the ith province and city after the premium-quality advance and DE level of the YREZ are arranged in ascending order.
Here, the global Moran's I is used as the evaluation index. Spatial econometrics is used to analyze the impact of DE on premium-quality economic advance, as shown in Eq. (26).

In Eq. (26), wij represents the weight matrix; x¯ denotes the mean value of the development level of the YREZ; xi and xj signify the development level of provinces i and j in the economic zone, respectively. Moran's I is divided into Global Moran's I and Anselin Local Moran's I. Moran's I, in a narrow sense, is a rational number. After normalization, the variance's value will be normalized to a range between -1.0 and 1.0. Moran's I > 0 indicates a positive spatial correlation. The spatial association becomes clearer as the value increases. Moran's I < 0 demonstrates a negative spatial correlation. The smaller the value, the greater the spatial difference. When Moran's I = 0, the space is random. Randomness characterizes the spatial distribution of premium-quality advance stages in the YREZ.
The Spatial Error Model (SEM) addresses spatial disturbance correlation. The model is defined as:
where ρ refers to the spatial error coefficient; M stands for the weight matrix; y and X represent the premium-quality development level score of the YREZ and the n × k-order matrix formed by the data used for regression, respectively. The spatial correlation is mainly reflected by µ.Innovative and intelligent decision-making to achieve premium-quality development of the DE


China has entered a new historical phase of building a new socialist, modernized country and advancing toward its second-centennial objective. The issue of imbalanced and inadequate regional economic advance is still relatively prominent. The DE has high innovation, intense penetration, and extensive reach. Accelerating the development of the DE is a crucial support force for expanding domestic demand, promoting growth, increasing employment, and preserving stability. It is conducive to supporting China's economic system modernization, facilitating China's economic cycle, activating development drivers, and bolstering economic resilience. Therefore, it is essential to make efforts in the following aspects to promote the premium-quality advance of the DE.
- (1)
Lay a solid foundation for the development of the DE. China's DE development is based on key core technologies and new digital infrastructure, both of which have substantial limitations and vulnerabilities. Therefore, it is imperative to firmly grasp the autonomy to develop the DE and focus on improving the intelligent and comprehensive digital information infrastructure to enhance the innovation capability of key digital core technologies and attain a high level of independence and autonomy.
- (2)
Activate the vitality of data production factors effectively. Information is essential to the development of the DE. Therefore, it is necessary to strengthen the supply of premium-quality data elements, accelerate the market-based circulation of data elements and innovate the development and utilization mechanism of data elements. We should also focus on launching pilot projects to improve data quality, cultivating the market for data elements, and reforming the market-based distribution of data elements to strengthen data governance norms and methods.
- (3)
Enhance the efficiency of DE governance. Development promotion and regulation must function in unison. It is essential to construct a digital government and a digital society and strengthen collaborative management and regulatory mechanisms. In addition, it is necessary to establish and strengthen a governance framework for the DE to boost the DE's security assurances. The measures can comprehensively enhance the efficacy of digital governance and maintain the security baseline.
- (4)
Encourage the innovation and entrepreneurship skills of tertiary education talents. As a critical component in the production of human capital, tertiary education necessitates individuals with extensive entrepreneurial experience and the capacity to give ideas in the session of enterprise development. Enterprise development drives economic advance. Therefore, education is the engine of economic advancement, requiring adequate attention and investment.
- (5)
Expand the development space of the DE continuously. The DE is the future development direction of the world. Its healthy and orderly development depends on the shared responsibility of all countries, joint cooperation, and common promotion. All humankind may benefit from premium-quality DE development only by actively cooperating on DE governance and preserving and improving global DE governance institutions.
EWM calculates the index weights of premium-quality economic advances in the YREZ. Quality change is 0.32680, power change is 0.39958, and efficiency change is 0.26959. Fig. 4 presents the comprehensive indexes of the premium-quality development level of each province calculated by TOPSIS.
.")
In Fig. 4, the highest level of premium-quality economic growth in the YREZ is in the YREZ is indicated by the index value of 3.8582 in Shanghai in 2018; the lowest level is indicated by the indicator value of 0.7324 for Guizhou Province in 2016. It can be seen that there are pronounced regional differences in the level of high-quality economic growth among the YREZ cities. Shanghai, Jiangsu, and Zhejiang have economic quality levels above 2, and their development levels are generally remarkable. Other provinces, including as Anhui, Guizhou, Hunan, Jiangxi, and Yunnan, have a quality rating of approximately 1, indicating a rather backward development level. China's economic growth rate remains largely stable and upward from 2015 to 2021, with a tiny drop in 2016 and 2021. Anhui province attained the highest composite index of high-quality economic level in 2020, at 1.2479. Shanghai achieved the highest composite index of high-quality economic level in 2018, at 3.8525. Hubei province had the highest composite index of high-quality economic level in 2020 at 1.6351. Guizhou province reached the highest composite index of high-quality economic level in 2020 at 0.9689. Hunan province achieved the highest composite index of high-quality economic level in 2020 at 1.1542. In 2020, the composite index of high-quality economic level hit its peak of 1.1542. Six provinces and cities have a greater growth rate than the national average, and their development pattern is quite constant.
Similarly, the weight of digital economy indicators for each province in the YREZ is calculated. Digital industry weight is 0.3174; digital infrastructure weight is 0.3786; digital application weight is 0.2428; financial inclusion weight is 0.0612. Fig. 5 depicts a comprehensive index of the DE level in the YREZ derived in this manner.
.")
Fig. 5 suggests that in recent years, the province with the greatest DE level in the YREZ is Zhejiang Province, which reached 3.9309 in 2020; the province with the lowest DE level is Guizhou Province, reaching 0.2844 in 2015. There are substantial disparities and uneven development across provinces. Shanghai, Zhejiang, and Jiangsu provinces have the highest economic level, and their composite score is above 2. Other regions' average composite index sis lower. Specifically, the highest average composite indexes of Anhui, Hubei, Chongqing, Yunnan, Hunan, Guizhou, Jiangxi, and Sichuan are 1.5621, 1.191, 1.2277, 1.667, 1.6119, 1.0526, 1.137, and 2.3016, respectively. From the standpoint of the time axis, the DE levels of the YREZ provinces has exhibited an upward trend year by year. Meanwhile, the growth rate has remained constant. Except for 2018, which dipped to 5.019%, all other years showed an upward trend in terms of growth rate, particularly linear growth from 2018 to 2021. Other than Shanghai, Jiangsu, and Zhejiang, the provincial growth rates of Anhui, Hubei, Chongqing, Yunnan, Hunan, Guizhou, Jiangxi, and Sichuan were greater than the national average.
The development levels of various YREZ provinces fluctuate across years, as depicted in Figure 5. Shanghai, Zhejiang, and Jiangsu are also ahead of other provinces in terms of education. The export of talent from these regions' institutions of tertiary education each year has contributed to indisputable economic growth. Consequently, the economic status of these provinces is considerably better than that of other provinces.
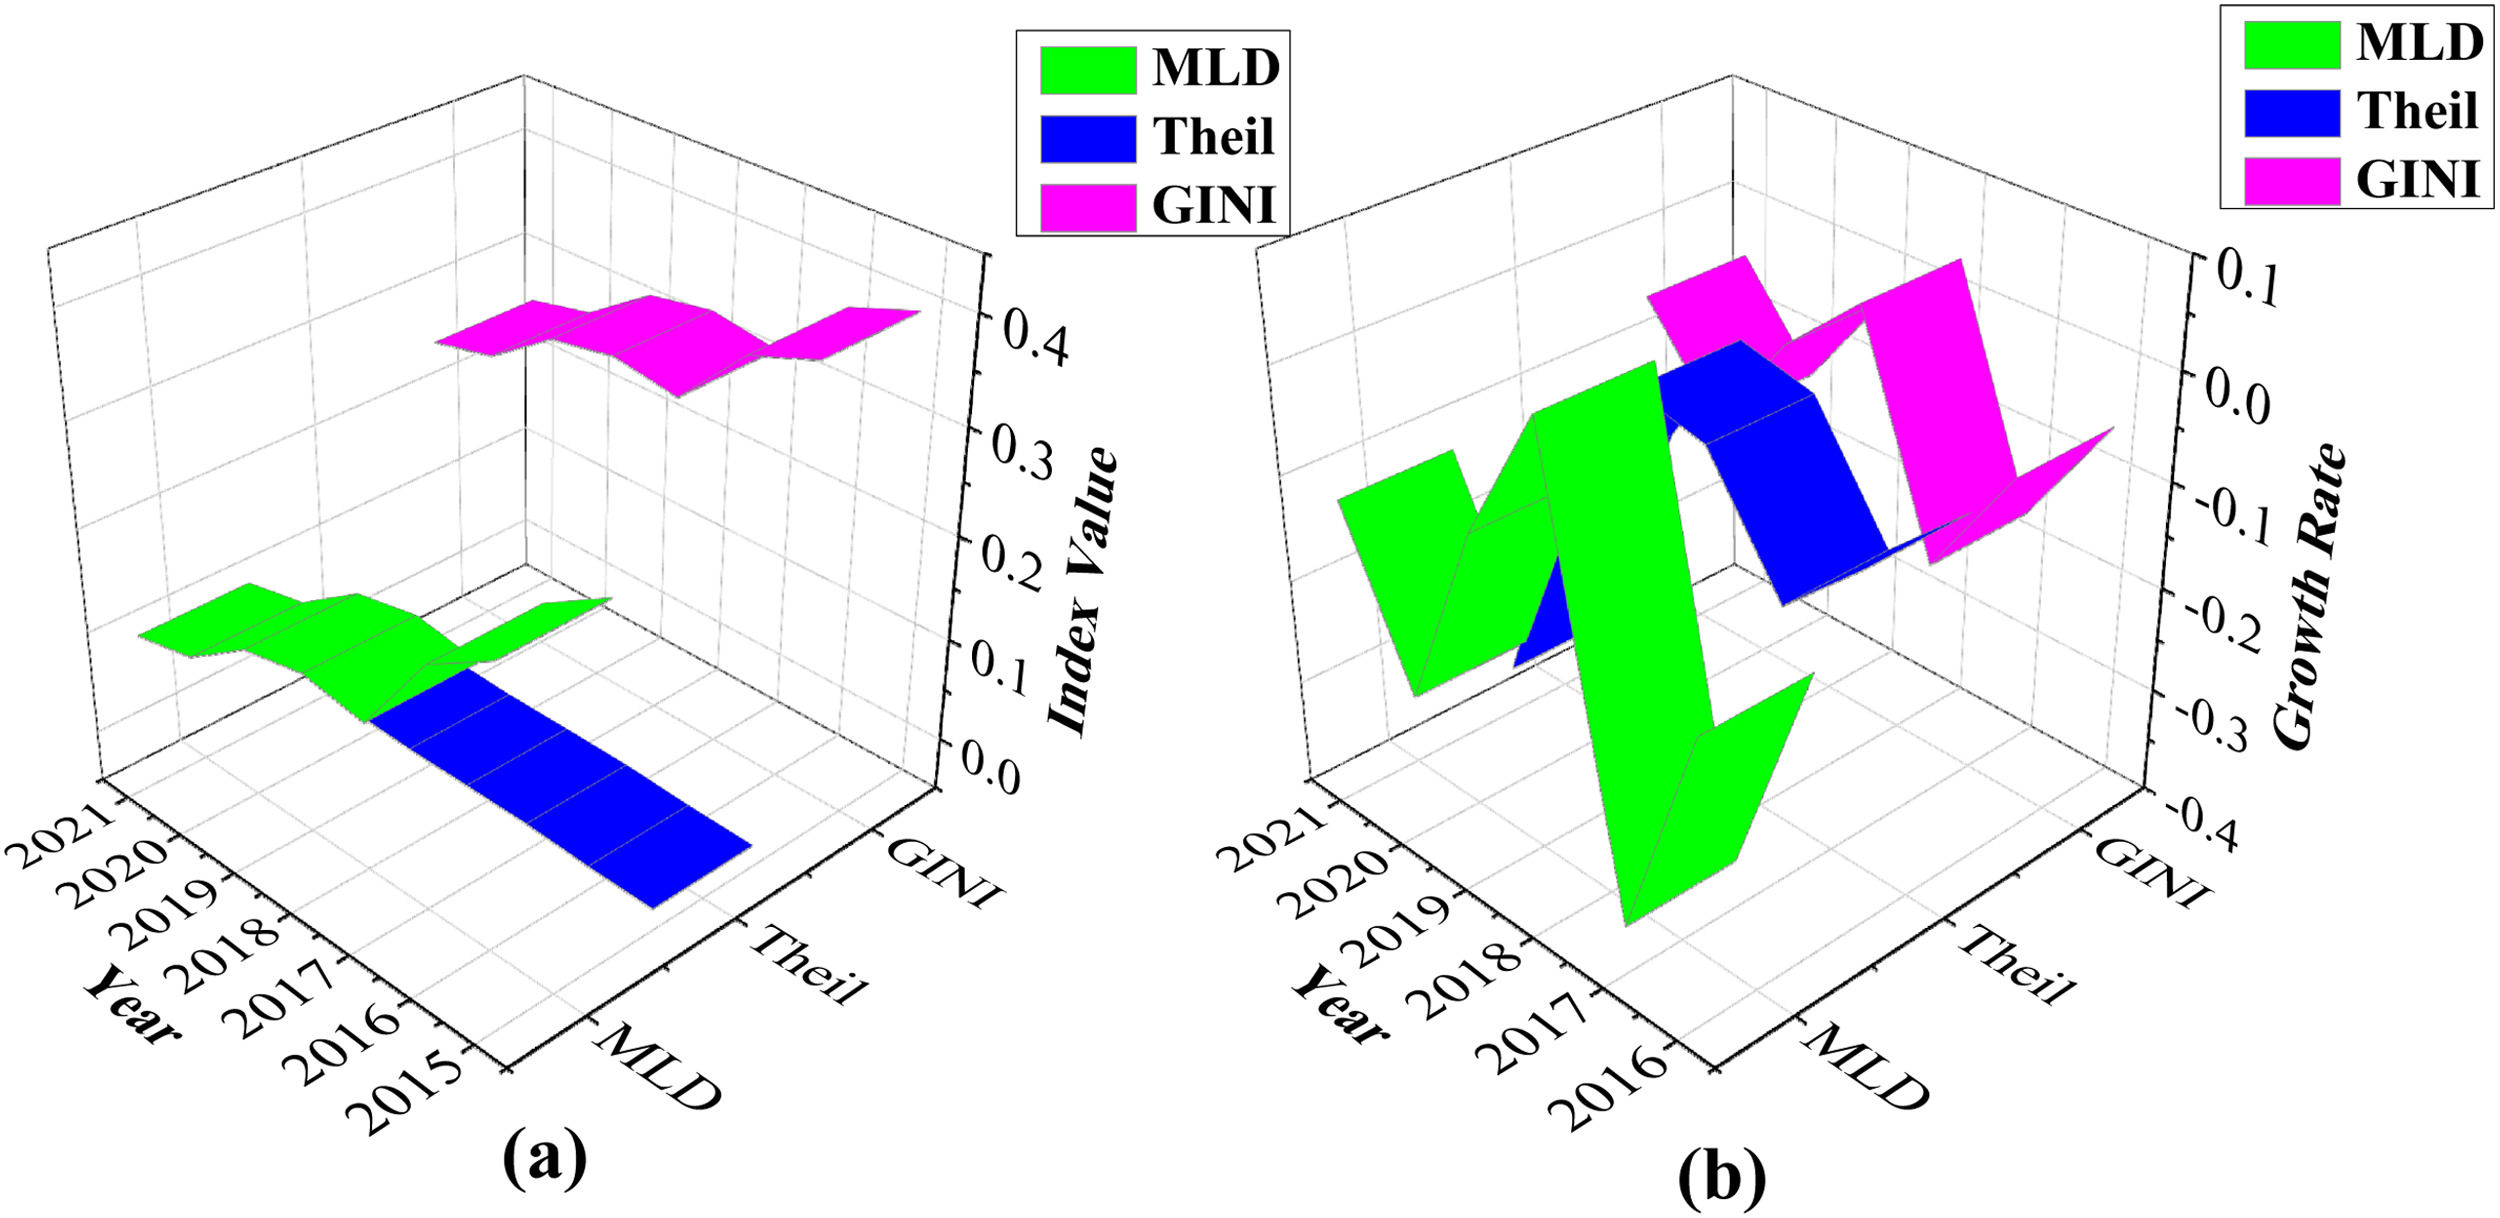
Fig. 6 illustrates the disparities in the level of premium-quality economic advance in different regions according to MLD, Theil, and GINI.
.")
The Theil indicator of the premium-quality economic advance level of the YREZ has a minimum value of -0.296, a maximum value of -0.0225, and an average value of -0.0253, as shown in Fig. 6. The minimum value of MLD is 0.1116, the maximum value reaches 0.1433, and the average value is 0.1215. The minimum Gini coefficient value is 0.2473, the maximum value reaches 0.2974, and the mean value is 0.2732. Except for 2016, the change trends of these three indicators are similar, but the changes are considerably distinct. In 2018 and 2016, the MLD decreased by 0.0388, the Theil index decreased by 0.0262, and the Gini coefficient decreased by 0.018. The changes were comparable, indicating that the overall changes in the level of premium-quality economic advance level of the YREZ in 2018 remained consistent.
Fig. 7 presents the differences in the DE levels amongst different provinces.
.")
The minimum value of the Theil index of the DE level in these years is -0.0285, the maximum value is -0.0191, and the mean value is -0.0236. Minimum MLD value is 0.1156, maximum MLD value is 0.2850, and average MLD value is 0.1891. Minimum Gini coefficient value is 0.2670, maximum value is 0.3975, and mean value is 0.3300. In 2019, the MLD of the DE level of the YREZ fell by 0.0737, the Theil index fell by 0.0124, and the GINI fell by 0.0349, all of which are less than 0.1. In 2019, the overall change in DE level remained steady.
Impact of the DE on the level of premium-quality economic advanceThe aforementioned conclusions prove that the regional distribution characteristics of the premium-quality economic advance level and the DE development level are identical. These indicate a relationship between the two. Fig. 8 provides Moran's I analysis results of the premium-quality economic advance level and non-high-quality development level of the YREZ in the past seven years based on spatial econometric theory and STATA software discussed previously.

The total Moran's I value of the leading level of the premium-quality economic advance exhibits a trend of up-and-down swings, as shown in Fig. 8. The overall Moran's I of YREZ's premium-quality economic advance level and DE level in recent years is greater than 0. These metrics passed the significance test, indicating that they are spatially positively connected. The DE development level had a declining and then climbing pattern. This phenomenon illustrates that the correlation of the development level of the regional DE first decreases and then increases. Besides, the spatial correlation is developing in a favorable manner. As a result of the YRBZ provinces' regional agglomeration effect, common values with significant space for development surround low values of the development level.
Table 3 lists the coefficients and P values of the SEM.
According to Table 3, the aforementioned variables pass the test at a minimum of the 10% level. Results reveal that elements, including human capital, significantly impact the premium-quality advance of the YREZ.
DiscussionThe impact of the economy on the premium-quality advance of the YREZ is demonstrated by establishing a structural Eq. model. Global autocorrelation and local autocorrelation tests are performed on the measurement results based on the above calculation of YREZ high-quality development and DE levels. The results indicate that weight change is the most critical factor affecting the high-quality development of the YREZ. Significant differences exist between the ratios of mass change and efficiency change, with the ratio of mass change being slightly greater than that of efficiency. Although the influence coefficient of the YREZ's economic development level on the premium-quality development level is not the maximum value, it has a favorable effect. This finding is consistent with the original hypothesis, suggesting that fostering regional economic development is essential for achieving high-quality growth in the YREZ. Human capital variables, such as tertiary education, transportation infrastructure, government financial resources, investment levels, and openness to the outside world, influence the level of high-quality growth in YREZ.
The above conclusions are similar to those of previous studies. China's DE statistics from 2004 to 2019 were used by Tang et al., (2021) to suggest an indicator system to gauge the degree of DE development. They also employed factor analysis to determine these provinces' annual development levels. Theil index and kernel density estimates were used to assess regional differences at the developmental stage. Moreover, the network method was used to investigate the association between the levels of agricultural sustainable development in various Chinese provinces and cities. Regional differences exemplify the problem of polarized and uncoordinated economic development, as demonstrated by research. The southern region has a higher level of DE development than the northern region. Regionally speaking, network research suggests that interprovincial digital economic development has positive spillover effects. Li et al., (2021) explored the relationship between sustainable development and environmental quality in 217 cities in China from 2003 to 2018. The author evaluated the degree of coupling and coordination between the digital economic and ecological systems. They discovered that the collar and coordination between the digital economic and environmental systems fluctuated upward from 2003 to 2018. The formation of DE was also observed to considerably reduce PM2.5 levels. Urbanization, population density, and economic growth all create threshold effects. When the urbanization rate and population density surpass a specific threshold, DE will substantially suppress PM2.5 levels. Therefore, the research findings given here are consistent with the current state of economic development and reach comparable conclusions. Table 4 summarizes the specific comparison.
A specific comparison between this work and other literature.
| Research Scope | Research Methods | Conclusion | Discussion | |
|---|---|---|---|---|
| Research reported here | China's DE and premium-quality economic development in the YREZ from 2015 to 2021 | An index system, EWM, and TOPSIS | The economic development of each province is quite different, and the level of development is unbalanced | The comparison shows that the results reported here and the conclusions of the two literature studies are similar to a certain extent, reflecting the reliability and accuracy of the results reported here. |
| Tang et al. (2021) | China's DE data from 2004 to 2019 | An index system and factor analysis | There is profound polarization. Cross-provincial DE development has beneficial spillover effects. | |
| Li et al. (2021) | The dynamic relationship between the digital economic system and the environmental system | Coupling coordination and threshold effect analysis | Urbanization, population density, and economic development all create threshold effects. |
As the primary method of cultivating human capital, higher education should develop talent who love the country and the people and insist on the fundamental task of cultivating people with virtue. The quality of human capital determines the premium-quality economic advance level to a certain extent. The DE is a new financial form based on the internet. It is a reallocation of resources, in line with China's concept of innovative, coordinated, green, open, and shared development, and fits the profound content of premium-quality economic advance. This work first analyses the role of higher education in high-quality economic development. Then, an evaluation index system for the YREZ is established based on the DE and premium-quality economic advances. However, this work has various shortcomings. For example, only the YREZ was chosen to establish an evaluation index system, and the proposed development strategy is targeted. Further cases are needed to confirm the implementation on a national scale. Future research will conduct long-term dynamic observations of the future economic trend of the YREZ and even the whole country, explore the dynamic relationship between higher education and economic development, and formulate and adjust economic development plans promptly.
This work was supported by the Major Program of the National Social Science Foundation of China (Grant No. 22ZDA009).