


Cooperativism, as an agent of social innovation, significantly contributes to fostering a dynamic economy and plays a fundamental role in rural areas. Analyses of profitability in cooperatives versus Investor-Owned Firms (IOFs) show disparate results depending on the methodology and indicators used. This disparity of results is largely due to the fact that common indicators are used in the business sphere that do not take into account the duality of investor-supplier members in cooperatives. This paper deals with a comparative analysis of the efficiency and profitability of cooperatives and IOFs, which takes into account the cooperative specificity as far as partner-producer duality is concerned. The populations analyzed are the olive oil producing companies in Andalusia and the methodology used is twofold: DEA, in the case of efficiency, and probit regression for the analysis of profitability. For the latter, a cooperative global profitability indicator has been defined. The results point to a superiority of the cooperatives in terms of both efficiency and overall profitability compared to the IOFs, which denotes a greater capacity to better remunerate the producer, especially in smaller companies. However, this superiority disappears as the cooperative gains dimension. Our findings show that the relative performance of cooperatives and IOFs varies by size. This reality warrants the attention of both society and governments, prompting the need for the development and implementation of public policies aimed at their growth and safeguarding. Additionally, it initiates a pathway for further research into other sectors of activity.
Cooperatives are enterprises with stable and unconditional links to the rural environment and thus play a leading role in the local economy and in fixing the population to the territory, making them true agents of rural development (Cos Sánchez, Escardíbul Ferrá & Colom Gorgues, 2021; Mozas & Bernal, 2006). Their governance, principles, and values make cooperatives agents of social innovation1 that contribute to solving problems in society and meeting social needs that the markets cannot fulfill through collective engagement (Windrum, Schartinger, Rubalcaba, Gallouj & Toivonen, 2016).
Among the multiple definitions and perspectives on the concept of social innovation, in 2013, the European Commission associated it with the implementation of new ideas (products, services, and models) to meet social needs and create new social relationships or collaborations in a process that involves correctly identifying social needs, developing innovative solutions for those needs, evaluating their effectiveness, and scaling up effective solutions (European Commission, 2013).
The social structure of agricultural cooperatives and their rural roots make them true agents of social innovation. Moreover, while for-profit business organisations innovate to address the changing nature of demand, cooperatives innovate based on their members’ changing and unmet needs (Dongre & Paranjothi, 2020), thus generating wealth in the communities in which they are based with the consequent population settlement, avoiding production offshoring, and preserving the environment.
Examples of social innovation by cooperatives and other social economy formulas are found worldwide, developed in response to changes in the social needs of the community. In the agri-food sector, cooperatives present innovative initiatives to respond to current challenges, such as facilitating joint cropland management to combat members’ land abandonment and the lack of generational renewal (Piñeiro, Meliá-Martí & García Alvarez-Coque, 2021), creating groups or networks to tackle investments in R + D + i to improve the added value of their members (Gallego-Bono & Chaves-Avila, 2016), working to transform members' crop production systems into organic or integrated methods (Parrilla-Gonzalez & Ortega-Alonso et al., 2021), and sharing economic experiences (Dabbous & Tarhini, 2021).
Several studies have noted that producer cooperatives generate higher returns than investor-owned firms (IOFs) (Barros & Santos, 2007, D'Amato et al., 2021, Yu & Huang, 2020), which is a result of the dual status of members, suppliers, and owners, and their greater commitment to and alignment with the interests of the cooperative. However, this duality of membership and the cooperative governance model itself, with a democratic structure and vaguely defined property rights, entails the appearance of costs, which may dilute the advantage held by cooperatives.
The results of most existing studies comparing the profitability of cooperatives and IOFs raise many doubts insofar as they do not consider the differential elements between the two types of enterprises and are often limited to comparing profitability indicators based on corporate profits. According to Kalogeras, Pennings, Benos and Doumpos (2013), profitability analyses conducted on agricultural cooperatives can be grouped into two categories: those using indicators related to economic efficiency and those based on financial ratios. However, to the best of our knowledge, no research to date has addressed both methodologies together.
This study aims to conduct a comparative analysis of producer cooperatives and IOFs that integrates both approaches (efficiency and profitability) and considers the special dual role of the cooperative member-supplier. This comparison pays particular attention to the impact of size on the profitability of both types of companies.
First, profitability is analysed in an efficiency study using data envelopment analysis (DEA). DEA is the most frequently used technique in efficiency studies owing to its usefulness and validity (Kuosmanen, Johnson & Saastamoinen, 2015). Second, an analysis is conducted using financial ratios. However, as several studies have noted, traditional financial measures do not consider the dual role of cooperative members (users and owners) (Benos, Kalogeras, Wetzels, de Ruyter & Pennings, 2018), or that cooperative owners, unlike the owners of IOFs, are not primarily or exclusively interested in the return on their investment, but rather are focused on other services and benefits cooperatives provide (Soboh, Oude Lansink & Van Dijk, 2011).
This study proposes a ratio that allows the profitability of cooperatives and IOFs to be compared without being affected by the differences in weights for the purchase of products from suppliers (also cooperative members) between the two types of entities.
This study was conducted with olive oil companies in Andalusia, which is the main production region in Spain. Cooperatives represent 50% of the total number of mills and 67% of production in this region. Thus, the cooperatives and IOFs in this analysis are in the same production sector, use the same technology, and are located in the same region, making them similar in all aspects except for those derived from their different legal forms. Therefore, the differences that emerge in the comparison conducted in this study can be attributed to their different organisational or business forms.
However, as cooperatives grow, their organisational costs increase, along with their capacity to invest in assets and services aimed at improving the profitability of their members, thereby leading to increases in the unit costs of cooperatives compared to those of IOFs. Both elements can place cooperatives in a lower position for profitability compared to IOFs. Thus, to compare profitability in the different stages of company growth, two models are considered, with the second one including the impact of size on differences in profitability between both types of companies. Stakeholder theory and transaction cost theory are used to explain the different behaviours of both types of companies concerning company size.
To achieve the above objectives, the remainder of this paper is structured as follows. Section 2 presents the theoretical framework and hypotheses to be tested. Section 3 describes the methodology and origin of the data used. Section 4 reports and discusses the main results. Finally, Section 5 summarises the main conclusions and values derived in this study.
Theoretical framework and hypothesesIntegrating the production of numerous entrepreneurs to share production and sales costs is a key pillar of cooperativism (Mozas & Guzmán, 2017). Moreover, cooperatives correct for market failures by providing services for which a functioning market does not exist, thereby improving the quality of life and profitability of farmers and their farms2 (Parliament, Lerman & Fulton, 1990). Cooperatives are new forms of ownership, representing a new way to foster better production and engage in capitalism differently. These firms focus on providing a cooperative model for missions to empower people and nurture their capacity to participate from the start rather than just reacting afterwards (Mazzucato, 2023).
Economies of scale, as a source for increasing efficiency and, thus, competitiveness (Allen & Liu, 2007; Margono, Sharma & Melvin, 2010) are key elements in the creation of cooperatives. Economies of scale are present when a firm increases its output if it can reduce costs per unit of output while keeping the proportion of resources used constant. This concept has been used to explain industrial concentration (Curry & George, 1983; Vergos, Christopoulos, Krystallidis & Papandroni, 2010).
In the olive sector, which provides the basis for this study, economies of scale are vital. According to Ministerio de Agricultura (2021), during the industrial phase of olive oil extraction, the weighted average extraction cost for 1 kg of oil and the net margin generated are highly dependent on total production volume. As economies of scale in the olive sector are a clear factor in greater productivity, the process of cooperatives concentration provides clear benefits.
Therefore, a large part of cooperatives’ raison d'être is based on the concentration of activity and business size, allowing them to achieve economies of scale. However, the relationship between size and performance is complex (Bolarinwa & Obembe, 2017), and empirical studies have not obtained conclusive results regarding the sign of this relationship. From a theoretical perspective, some theories report that this relationship is positive, whereas others indicate the exact opposite (Camisón-Zorzona, 1996). The former includes, among others, the theory of the firm, according to which a firm becomes more efficient as it approaches its optimal size, since it allows its unit costs to be minimised, as well as the classical industrial economics approach, according to which the relationship between size and profitability is positive, considering the market share or concentration that it provides. Thus, according to Demsetz (1973), a larger market share facilitates pacts/collusion with other companies, leading to greater market power and, thus, greater profitability. Finally, new industrial economics theory argues that large companies have all the options available to small and medium-sized enterprises, but not vice versa. In addition, larger firms have a greater competitive advantage in five areas: economies of scale and experience curves, financial resources, human resources, marketing resources, and technological resources (Sánchez & García, 2003). These theories have been supported by numerous empirical studies such as Begley and Boyd (1986), Goddard and Wilson (1996), Majumdar (1997), and Fu, Ke and Huang (2002).
However, the democratic structure of cooperatives, shared identity of members as both owners and users, and pursuit of a dual objective (i.e. to serve both members and business), can lead to the emergence of new costs, both organisational and derived from the growing incorporation of services provided to members, especially when cooperatives grow in size and complexity. This counteracts the advantages achieved through the concentration of activity and size and can place cooperatives in an inferior position in terms of business profitability compared to other enterprise forms, including IOFs.
Stakeholder and transaction cost theories justify the differential nature of cooperative enterprises compared with other types of entities in terms of their performance. Stakeholder theory (Freeman, 1984) indicates that organisations comprise a set of actors or interest groups (stakeholders) whose requirements management must meet to ensure a company's survival (Donaldson & Preston, 1995). Accordingly, a larger number of and greater diversity in stakeholders, such as of large companies, can make it difficult for firms to meet their needs and objectives, thus negatively affecting business efficiency (Parmar et al., 2010). This is the case in cooperative societies, where relationships with stakeholders are more complex than in other types of entities. This is mainly because of the different roles, with different associated interests, assumed by the cooperative members: owner, supplier, customer, and in some cases, workers.
The second theory, transaction cost theory, posits that costs are associated with coordination and transactions between parties, such that in large companies, these costs can increase organisational complexity and therefore lead to lower economic efficiency (Madhok, 2002). In the case of cooperatives, greater organisational and operational complexity can increase governance costs, thereby negatively affecting efficiency (Parmar et al., 2010). Specifically, increases in activity and the number and heterogeneity of members can increase the costs of collective decision-making (Nilsson, 2018) or of monitoring management, as agency problems are aggravated (Cook & Iliopolus, 2016),
Various studies have attempted to compare the efficiency levels of cooperatives and capital investment companies (IOFs). Barros and Santos (2007) maintained that, on average, cooperative societies achieve greater efficiency than non-cooperative societies. Furthermore, one research stream indicates that membership in cooperatives positively influences the performance of agricultural production due to the advantages farmers gain from this concentration (Ma, Renwick, Yuan & Ratna, 2018). Cooperatives are a form of vertical integration for services provided to farmers (Valentinov & Iliopoulos, 2013). Thus, the many services cooperatives provide to their members make them stand out from the rest. For example, they usually have technicians to advise members on how to improve the yields of their farms, provide refueling stations, and buy inputs for their members in common. Yu and Huang (2020) reported a breakthrough in their evaluation of cooperative efficiency, including social impact, a usually neglected area of study. Their results showed that the cooperative legal form provides a higher level of performance, considering the social dimension which characterises it, and creates even tighter links with sustainability. Focusing on the olive sector, Dios-Palomares, Martínez-Paz and Martínez-Carrasco (2006) show that cooperatives are less efficient than other business structures; however, this is a consequence of the cost of the services cooperatives provide to their members, which other entities, including IOFs, do not offer.
The peculiar model of crop liquidation in cooperatives, which is affected by the dual ‘owner-member’ role, may bias efficiency comparisons between the two types of entities. This is because cooperatives have among their objectives not only to obtain maximum profits as a company but also to generate maximum value for members (Lauermann, Moreira, Souza & Piccoli, 2020; Li, Jacobs & Artz, 2015); thus, they can pay a higher price for the harvests delivered than industrial mills. Therefore, if ‘partner-delivered harvest’ is used as an input to assess the efficiency of these companies, it may reflect a lower level of efficiency than that found in other types of entities.
Although the identity and governance of cooperatives can cause them to face organisational costs that IOFs do not, we understand that the advantages in technical efficiency resulting from the alignment of members' objectives with those of their cooperatives indicate the superiority of cooperatives over IOFs. Accordingly, we propose the following hypothesis:
H1 Cooperative mills are more efficient than industrial mills, if ‘the harvest delivered by the member’ is excluded as a production factor.
Most of the literature that comparatively analyses the performance of cooperatives and IOFs has done so using different indicators at the cooperative/enterprise level based on corporate profits, such as return on assets, return on equity, return on sales, gross profit over sales, net profit over assets, profit margins, and net profits.
However, these profitability indicators should only serve as a basis for a comparison between cooperatives and IOFs in cooperatives with the strategy of maximizing their profitability as enterprises. This undermines the effectiveness of applying profit-based performance indicators in cooperatives and calls for nuances in their interpretation (Bijman, Pyykkönen & Ollila, 2012; Kontogeorgos, Sergaki, Kosma & Semou, 2018; Soboh et al., 2011). In addition, other differential elements between both types of institutions (i.e. cooperatives and IOFs) may generate profitability biases not attributable to the management of the institutions themselves. This is the case for differences in the sources of financing or tax incentives. Economists agree that cooperatives finance a large percentage of their investments with equity and use more short-term and less long-term debt than their investor-owned counterparts (Hardesty & Salgia, 2004; Li et al., 2015; Russell, Briggeman & Featherstone, 2017), which may have a positive effect on profitability to the extent to which debt financing has a negative ‘relationship’ with earnings (Hailu, Jeffrey & Goddard, 2007; Parliament et al., 1990). Regarding tax incentives and subsidies, as in most market-oriented economies with advanced agricultural sectors, cooperatives receive public support, such as in the form of a flexible legal framework or beneficial tax treatment (Ribašauskiene et al., 2019).
In contrast, other studies compare the performance of both entities using combined profitability indicators at the cooperative/enterprise-member level. Amongst them, Soboh et al. (2011) incorporated into their analysis the cost of raw materials, (i.e. the acquisition cost of the product [milk in this case] the farmers delivered). D'Amato, Festa, Dhir and Rossi (2021) used an adjusted measure based on EBITDA to estimate the gross cost of raw materials, thereby avoiding distortions in cooperatives’ margins caused by their costs of raw materials being higher than those for other similar companies. Ling and Liebrand (1998) and Grashuis and Cook (2016) incorporate the extra-value index (EVI), which measures the efficiency of a firm's operations in adding value to the firm for stakeholders (Table 1).
Empirical literature on the comparative performance of cooperatives and IOFs.
Source: Author.
However, the results of studies comparing the performance of IOFs and that of cooperatives at the cooperative/enterprise level have been contradictory. Although most found no significant differences between the two entity types (Ferrer, Abella-Garcés & Maza, 2019; Gentzoglanis, 1997; Hardesty & Salgia, 2004; Harris et al., 1996; Martínez-Victoria, Arcas Lario, & Maté Sánchez Val, 2018; Parliament et al., 1990), others have found IOFs to be more profitable. For example, Ananiadis, Notta and Oustapassidis (2003) and Notta et al. (2007), who conducted different studies on dairy cooperatives and IOFs in Greece, suggested that the differences in profitability between the two groups can be attributed mainly to the higher efficiency of the capital structure and market share in IOFs. No studies have categorically affirmed the superiority of cooperatives over IOFs in terms of profitability, although some related elements have been explored, such as cooperatives having higher survivability (Valette, Sentis & Amadieu, 2016) and less volatile performance overall (Challita, Aurier, & Sentis, 2019) than IOFs.
However, studies that analyze performance at the cooperative/enterprise-member level have yielded different results, especially those that incorporate variables that quantify the cost of purchasing products from members. For example, D'Amato et al. (2021) performed a comparative analysis between cooperatives and IOFs in the wine sector in Italy and found a clear superiority of cooperatives. Others have reported different results, such as Soboh, Oude Lansink and Van Dijk (2012), who found that European dairy cooperatives tend to have higher material costs, which might result from cooperatives paying higher prices for raw milk and may therefore be preferred by dairy farmers. Consequently, cooperatives earn lower profits. However, cooperatives also tend to have a higher turnover-to-fixed-assets ratio and a lower turnover-to-inventory ratio. These results led Soboh et al. (2012) to suggest that cooperatives demonstrate better operational efficiency compared with IOFs.
Based on this analysis of the literature, we can presume that if we use an indicator that considers profitability globally at the cooperative-member level, and consider that, as we have proposed in H1, we expect the advantages inherent in the cooperative structure to outweigh the costs, cooperatives will perform better than IOFs. Therefore, we hypothesize the following:
H2 The overall performance of cooperatives is superior to that of IOFs (calculated at a cooperative-member level).
The study population comprised olive oil production and processing organisations in Andalusia, which is the world's main olive oil-producing region. These organisations are involved in processing olives into oil and marketing the resulting products.
Table 2 shows the technical data used in this study.
Study fact sheet.
Source: Author.
The DEA technique is considered one of the main methods for conducting efficiency analyses in terms of its popularity and use (Kuosmanen et al., 2015; Liu, Lu & Lu, 2015). It compares the same inputs and outputs of each decision-making unit (DMU) by using a linear programming technique which determines the efficiency ranking of each one (Samoilenko et al., 2014).
Among the various advantages of DEA is its flexibility, in addition to the large number of developments and extensions proposed in the literature (Charnes, Cooper, Lewin & Seiford, 2013). Liu et al. (2015) highlighted its validity and usefulness compared with similar techniques. We selected DEA in this study owing to its ability to evaluate the relative efficiency among DMUs without requiring explicit assumptions about the underlying production function. This method is particularly useful for comparing the performance of cooperatives and IOFs across varying scales and organisational structures, providing insights into efficiency disparities without predetermined efficiency scores or functional forms.
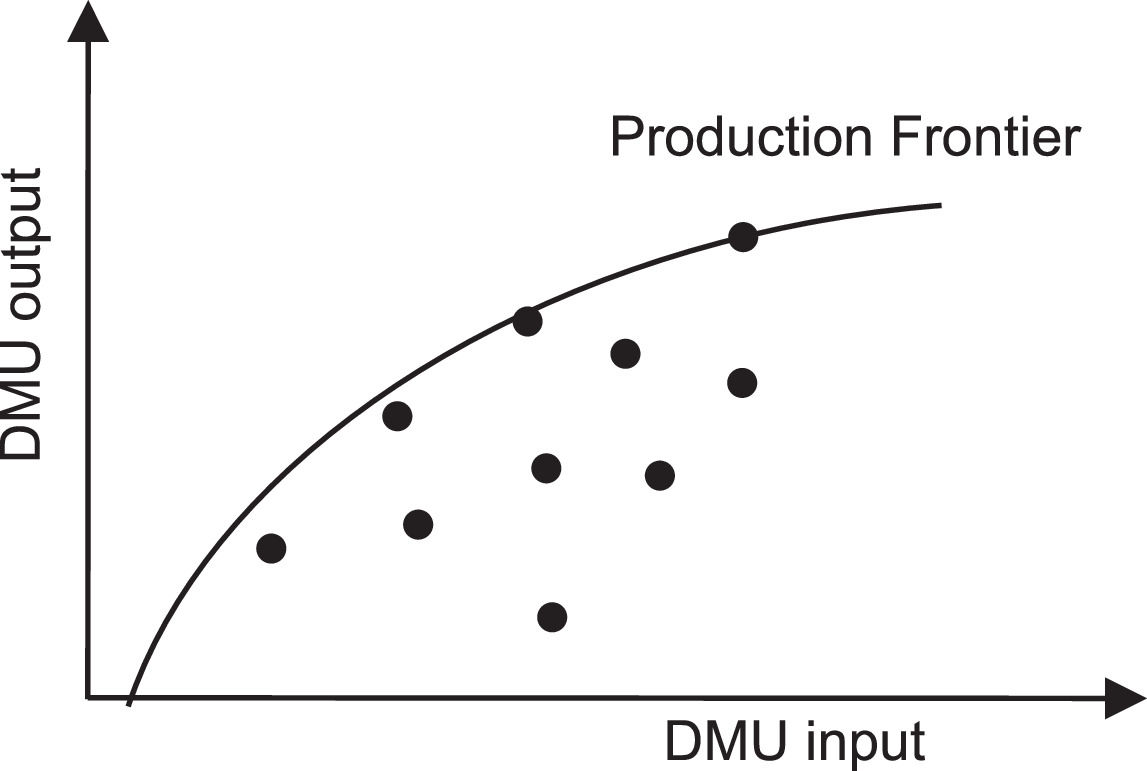
Among the different DEA variants, the classic BCC model has been used to evaluate inputs and outputs by considering variable returns to scale (Charnes et al., 2013) (Fig. 1). Furthermore, an orientation towards maximizing outputs (BCC-O) was chosen for the proposed model because the significant commercial problems these agricultural entities face, as well as their agricultural nature in which inputs are partially subject to crop seasonality, makes the BCC model more fruitful than others.

Graphical representation of the efficiency frontier of the BCC model.
However, a central drawback of this methodology is its high sensitivity to outliers, as they are used to determine the efficiency or best practice frontier (Charnes et al., 2013). Thus, detecting and removing these noise-contaminated observations will lead to more accurate results and more efficient rankings (Banker & Chang, 2006). To alleviate this handicap, we used the super-efficiency technique, eliminating observations that exceed an efficiency threshold of 2, which can be considered outliers (Banker & Chang, 2006). The primary DEA approach in its BCC-O version is as follows:

In this case, if ∅=1, the evaluated unit is considered efficient; thus, no other unit produces more or achieves the same level of output with fewer resources. Table 3 shows the variables considered for the proposed model.
The output used in the model is a classic variable in efficiency studies, especially for DEA (Othman, Mansor & Kari, 2014; Raja, Lario & de Lema, 2006). For the inputs used in the model, ‘total assets’ was chosen as the fixed factor because it includes all the capital employed in production. Regarding the choice of factors, although the main cost element of the olive-growing cooperative is the harvest members deliver, this variable cannot be used. This is because the cooperatives' settlement system, based on 'gross margins', means that this cost component is not independent but rather is closely related to the 'turnover' variable. Therefore, this variable has been excluded from the variable production factors and the variable ‘other operating costs’ has been included instead, incorporating the external services contracted by companies such as independent professionals, transport costs, energy or water supplies, insurance, and advertising, together with ‘personnel costs’ and ‘depreciation of tangible fixed assets’.
Probit modelA probit regression was conducted to investigate whether the performance levels of cooperatives differ from those of IOFs, as well as other factors. Probit regression is a discrete choice model used to predict the probability an event will occur. Several studies have demonstrated that discrete choice models are descriptive tools that can be employed to empirically discriminate or investigate differences between two categories, as represented by the dependent variable, and they have been used specifically to compare cooperatives and IOFs (Ferrer et al., 2019; Soboh et al., 2011).
The dependent variable of the model (Y) is categorical (dichotomous) and refers to the probability of a firm being either a cooperative or IOF (Y = 1, cooperative; Y = 0, IOF):
with

G is the standard normal cumulative distribution function expressed as an integral,
where ϕ(z) is the standard normal density,Independent variables

Global performance (GP) has been proposed as a joint cooperative/enterprise-member profitability variable. This mixed indicator incorporates the joint capacity of cooperatives/IOFs to generate profits and remunerate suppliers (also members in cooperatives) for delivering goods (cost of goods sold or materials) and is similar to the indicators proposed in previous research (D'Amato et al., 2021) (Fig. 2; Melia-Marti & Martinez-Garcia, 2015).


This indicator represents the percentage (%) of operating revenue or sales that a company can allocate to supply production and business profits (before interest and taxes) once its operating costs have been met (personnel, depreciation, and other operating expenses). This GP indicator is valid for both cooperatives and IOFs and has the advantage of not being disturbed by the different settlements for production to the supplier (member in the case of cooperatives) between cooperatives and IOFs, as it uses the operating income before materials in the numerator. A company and a cooperative with identical revenues and costs, with the only different cost being that corresponding to the payment to producers (members in cooperatives and suppliers in the IOFs), would yield identical GP.
To avoid bias derived from the possible differences between cooperatives and IOFs in their financing sources and tax systems, we used operating income in the GP indicator, insofar as this is calculated before interest and taxes.
In the cooperatives included in the analysis, members are their only olive suppliers. Therefore, the item ‘materials’, also known as ‘cost of goods sold’, corresponds to purchases of olives from members and, to a lesser extent, other consumables such as containers or packaging. However, given that the second item is a very small minority compared to the first, we consider this indicator to be appropriate when measuring GP. The other dependent variables are as follows:
- •
Assets turnover (ATurn): a common variable for measuring performance in cooperatives (Hardesty & Salgia, 2004; Parliament et al., 1990).
- •
Operating revenue (OR): income generated from normal business operations and measure of size.
- •
Growth of the firm (Growth): Measured as revenue in 2018 compared to revenue in 2017 minus one (D'Amato et al., 2021; Singh, Misra, Kumar & Tiwari, 2019; Soboh, Lansink, Giesen & Van Dijk, 2009)
- •
Control variables (Region): monitors potential regional effects and represents the eight regions of Andalusia (Almeria, Cadiz, Cordoba, Granada, Huelva, Jaen, Malaga, and Seville).
Another concern is the possible endogeneity problem in the model. To test for its existence, the residuals of the regression were obtained and their degree of correlation (Spearman) with the different independent variables of the regression was tested (H0: the independent variables and the residuals are independent), which did not prove the existence of a correlation. For the central variable of the model (GP), because the Spearman test (rho = −0.12, p = 0.0569) did not yield strong results, the Wald test of exogeneity was developed (H0: there was no endogeneity, corr = 0), confirming the non-endogeneity of GP (prob > chi2 = 0.0665).
To validate the results, a multiple linear regression was proposed, with GP as the dependent variable and the independent variables being Type (type = 1: cooperative, type = 0: IOF), Assets turnover, Growth, and Operative revenue, as well as control variables. This model allows us to contrast the variables that influence or determine the profitability of a company in the olive oil sector in Andalusia, especially the business typology (cooperative/IOF) and its products, with the company size.
ResultsData envelopment analysisIn the efficiency model (Table 3), after the super-efficiency calculations we performed, the number of organisations in the olive sector was reduced by one unit (the analysis continued with 384 DMUs). Table 4 presents the efficiency results obtained once the outliers were eliminated. The results show that 5.73% of the organisations in Andalusia's olive sector are efficient. These data revealed that even with outliers excluded, very few companies stand out from the rest by making the most efficient use of their resources. The average efficiency in the sample is 0.47, which is lower than the average inefficiency level, considering the distance between efficient organisations and the other companies.
A second analysis was subsequently performed to assess whether the obtained efficiency results showed statistically significant differences between cooperatives and IOFs. First, to apply the corresponding statistic, we verified that these data do not conform to a normal distribution, thereby leading us to use the Mann–Whitney U test to conduct a non-parametric statistical analysis of the difference in means. The results are shown in Table 5.
Based on the results of the Mann–Whitney U test, we could reject the null hypothesis that ‘both groups have a similar distribution’, 0.00 < 0.05. Therefore, we concluded that cooperatives and IOFs have statistically significant differences in relation to the efficiency indices.
Based on these data, we observed a positive and significant relationship between cooperatives and the overall economic efficiency levels. Thus, the results support H1 and validate the superior average efficiency of cooperatives over that of IOFs, which aligns with the results previously reported by Barros and Santos (2007).
Probit modelThe descriptive data of cooperatives and IOFs were analysed before the probit analysis. Some data were not included in the probit model because of high correlations with the other explanatory variables. This is the case for the expenditure efficiency indicators (Table 6). They reflect expenses as a percentage of revenue (expenses/revenue) as follows:
- •
Dep = Depreciation/Operating revenue
- •
Sal = Salaries/Operating revenue
- •
Oope = Sales and general and administrative costs/Operating revenue
Descriptive statistics (2018).
p-value (Mann–Whitney U test).
Moreover, the normality of the sample distribution (Shapiro–Wilk normality test) and the (Levene) homogeneity of variances test were compared. The assumptions of normality and homogeneity of variances were not met; therefore, we used the Mann–Whitney U test for independent and non-parametric samples to determine whether both samples (cooperatives and IOFs) showed significant differences (Tables 6 and 7).
Descriptive statistics by size (2018).
p-value (Mann-Whitney U test).
Classification on the basis on Commission Recommendation of 6 May 2003.
There are three large companies (with revenues above 50 million euros, and they have been excluded from the comparison).
The non-availability of data on the number of employees has meant that the classification has been carried out on the basis of the turnover variable only, although the official also takes as a reference figures for the volume of assets and the number of employees.
The descriptive statistics show that cooperatives are larger than IOFs in both asset volume and turnover (sig 0.1%). Furthermore, the GP of cooperatives is higher than that of IOFs (sig 10%). The differences in asset turnover are not significant. The cooperatives demonstrated lower growth capacity than IOFs from 2017 to 2018 (sig 10%). Regarding efficiency, cooperatives were observed to be capable of operating with a lower proportion of their income allocated to staff remuneration (sig 10%) and other operating expenses (sig 0.1%).
Companies were classified by size to determine if this variable showed any differences between groups (Table 7). We first observed that, for both cooperatives and IOFs, performance increases with firm size, which aligns with the previous findings of authors such as Pokharel, Archer and Featherstone (2020). Significant differences in GP were observed for micro and small enterprises between cooperatives and IOFs. Among micro-enterprises, cooperatives showed by far the highest profitability (GP) (1% sig), owing to their larger size (turnover (0.1% sig)), higher asset turnover (10% sig), and lower cost per unit of income (salaries, depreciation, and oope) (1%). However, for small enterprises, IOFs were more profitable (GP) (1% sig) as a result of greater investment in assets in cooperatives that are not sufficiently compensated for in the form of revenue (despite being higher than in IOFs), leading to a lower asset turnover (1%). In many cooperatives, this increased asset investment is linked to the provision of services to members to facilitate their operations or reduce the cost of their inputs. This explains the higher personnel and depreciation costs per monetary unit of sales revenue (5%).
Among medium-sized companies, IOFs have a much higher turnover rate compared with cooperatives, and although they also have greater investments in assets, the weight of these investments is lower with respect to income, and consequently, IOFs have higher asset turnover (5% sig).
As in the small enterprises, depreciation and personnel costs per unit of sales revenue are higher in cooperatives (5% sig), leading to lower profitability (GP) in the cooperatives, although the difference is not significant in this case. The only item that was significantly lower in all analysed groups was the oope per unit of sales revenue (0.1–5% sig), which includes supplies contracted by the company.
Table 8 presents the results of the probit regression with the variables included and their beta values, significance, and marginal effects. This study used two models. Model I, the baseline model, includes the variables GP, Growth, Assets turnover, and Operating revenue, as well as the control variables. Model II includes an interaction term, GPxOperating revenue, to test the influence of size and GP on the probability that a firm will be a cooperative. The overall rate of correct classification was estimated as 66.93%, and 69.33% in Models I and II, respectively.
Probit regression (2018).
The results show that the companies did not experience significant turnover growth from 2017 to 2018. Regarding GP, the results show that cooperatives are superior to IOFs (1% sig), indicating that, among olive oil production companies in Andalusia, the higher the GP, the higher the probability that a company will be a cooperative. This superiority of cooperatives over IOFs comes from their higher efficiency, as demonstrated using DEA, not from the higher asset turnover, which has a negative coefficient (1% sig).
However, as a company increases in size, this effect changes (Model II). The sign of the interaction term ‘GP x Operating revenue’ becomes negative (sig 1%), implying that in the case of larger and more profitable companies, the higher the GP, the higher the probability the company is an IOF and not a cooperative. According to the marginal effects, for each additional percentage point of performance a firm showed, the probability of it being a cooperative increased by 2.2%. These results partially support H2. At smaller sizes, cooperatives prove to be more profitable than IOFs; however, as company size increases, the cooperative structure generates new costs that cause them to lose their advantage over IOFs.
The regression results (Table 9) confirm the positive impact of cooperative business typology on GP (1% sig), in addition to other elements such as business size (Operating revenue) and asset turnover, which have positive effects (1% sig in both cases). However, in line with the probit regression results, as cooperatives grow larger, the impact on GP becomes negative (5% sig).
Results of regression analysis (2018).
Var dep: GP; Type= company type (Coop/IOF): Type 1 if Coop; Type =0 if IOF.
This study's results indicate the superiority of cooperatives over IOFs in terms of both efficiency and profitability. These findings support H1, partially support H2, and align with the results of D'Amato et al. (2021). This greater efficiency is due to the cooperative's differential characteristics, especially the duality of the partner (supplier and owner), which places them in a preferential position in key areas, such as product supply security, and a greater alignment and commitment of partners with the company's strategy (Bontems & Fulton, 2009).
However, the analysis further indicates that the use of mixed profitability indicators from a dual cooperative/enterprise-member perspective reveals differences in profitability in favor of cooperatives that are not visible when using those that only consider profitability at the cooperative/enterprise level, which is in line with Kontogeorgos et al. (2018) and Sebhatu et al. (2021). The advantage cooperatives have over IOFs, which is particularly evident in smaller cooperatives, translates into a greater collective ability to generate profits and pay their suppliers (i.e. the members of the cooperatives) more for their products. This is consistent with the findings of D'Amato et al. (2021) who used a similar cutoff indicator. Cooperatives’ goal of offering fairer prices to producers allows them to operate more efficiently and maintain lower operating costs (including wages, depreciation, and other expenses) compared to IOFs. Levi and Davis (2008) previously indicated that ‘enfants terribles’ cooperatives are completely depersonalised and represent a broader phenomenon that goes beyond the dominant global economy. Cooperatives are seen as a model based on two components, one economic and one social, and, in this, lies the source of their incompatibility with the hegemonic economic paradigm.
However, as firm size increases, this advantage of cooperatives is diluted and they become less scale-efficient. Assuming the U-shape of average business costs proposed by Marshall (2009) in Principles of Economics, the present results suggest that cooperatives would ‘suffer’ diseconomies of scale before IOFs. Several elements are the determinants of this phenomenon. The first is the superior investment in assets of cooperatives compared to that of IOFs, which increases with size. The tendency of cooperatives to ‘overinvest’ has been recognised in various studies (Parliament et al., 1990) and indicates that they require increasingly higher turnover to compensate for the consequent increased depreciation costs in terms of profitability. Concerning investment in assets, the greater difficulty cooperatives face in establishing their operational size is important to recognize. While IOFs choose the operational size that maximises their profitability, the size of a processing cooperative is determined by the volume of the members' supply of raw materials, which may be beyond the optimal level of supplies the cooperative requires (Soboh et al. 2012).
Another element that influences cooperatives’ loss of profitability is the increased weight of two types of costs per monetary unit received from sales, personnel and amortisations, which becomes more evident as the cooperative increases in size. This depreciation is a consequence of the abovementioned tendency of cooperatives to overinvest in assets. In the case of personnel expenses, this greater effort is explained by the very essence of the cooperative, that is, providing various services to members, which does not exist in IOFs. Although a micro cooperative does not have the financial muscle to provide such services to the members, they can incorporate them as they grow, thereby leading them to invest in assets (e.g. supply shops to reduce the cost of their inputs, machinery to facilitate members’ agricultural activity) and more staff to incorporate them (Casado-Montilla, Pulido-Fernández, Carrillo-Hidalgo & Durán-Román, 2023). These costs overrun their lead, resulting in a loss of profitability compared with IOFs. These results align with those obtained by Oustapassidis, Vlachvei and Karantininis (1998), who concluded that cooperatives are less scale-efficient because of their organisational characteristics that endorse oversupplying members' inputs.
Beyond financial reasons, other elements linked to the special governance of cooperatives become more prevalent as size increases and may affect the visible profitability loss. In line with stakeholder theory, a higher number of stakeholders with greater complexity in cooperatives, compared to those in IOFs, may negatively affect profitability. Similarly, according to transaction cost theory, the growth of cooperatives can lead to the appearance of costs associated with coordination between the parts of the organization that do not exist in IOFs. Nilsson (2018) identified the different governance costs that emerge or intensify as a consequence of growth and the incorporation of members for cooperatives. In particular, the costs of collective decision-making, or the costs of management supervision, are worth noting. Regarding the former, we can highlight the higher costs of coordination, portfolio, and horizon problems, which can hinder members' investments or lower incentives for members to contribute to governance because of the lack of clarity on property rights. In addition, the high number and heterogeneity of memberships increase collective decision costs, which arise with the adoption of costly processes to address the heterogeneity of patron interests and decisions that do not serve the average owner and may instead benefit unrepresentative groups (Cook & Iliopoulus, 2016).
Regarding management costs, firm size aggravates agency problems. As the number of members increases, each owner's share in the potential gains from effective supervisory management decreases, resulting in increased opportunistic costs and the emergence of bad-decision costs (Cook & Iliopoulos, 2016). This increase in the costs of the cooperative formula may mean that when cooperatives reach a sufficiently large size, they may migrate towards other models with lower organisational costs; however, whether this would be in the best interest of the partners is unclear.
Our findings have several managerial implications. Cooperatives in the agri-food sector need to grow to survive in a global and highly competitive context. However, this growth comes at a cost. Cooperative directors and managers must be aware of these costs during their growth process. Although some of these costs may be acceptable or even desirable, as they provide members with better services, those arising from greater organisational and decision-making complexity, as well as the divergence of interests between members and the cooperative, require an exercise in foresight and the introduction of modifications in their governance and decision-making models to ensure the sustainability of the cooperative.
ConclusionsBased on this study's objectives, the results obtained using the DEA method show statistically significant differences in the distribution of efficiency indices between cooperatives and IOFs, with cooperative organisations achieving greater efficiency. These findings support H1.
However, a mixed indicator of performance at the cooperative/enterprise-member level has been designed (GP), allowing us to visualize the higher profitability of cooperatives compared to IOFs, especially in smaller companies, which reveals their superiority in providing both higher profits and higher prices to suppliers for their products (also members in cooperatives).
The duality of the cooperatives’ producer-member role is fundamental as an incentive for these enterprises to adjust their operating costs, insofar as the direct beneficiaries of these adjustments are members. However, as their size increases, the idiosyncrasy of cooperatives brings to the surface costs that do not exist in IOFs, as these are derived from the dual nature of members (owners and users), their democratic structure, and their vaguely defined property rights, which make cooperatives lose their superiority over IOFs in terms of profitability. This element means that H2 is only partially supported (i.e. in the case of small cooperatives).
This study presents several differential elements with respect to the existing academic literature in the field of comparative analysis of the profitability of cooperatives and IOFs. First, it uses a dual methodology, DEA, and financial analysis through ratios using probit regression. Second, we propose an indicator that considers the dual role of cooperative members (users and owners) and examines profitability with a mixed approach from the perspective of the cooperative as an enterprise and from the viewpoint of its members. Although with a different formulation, this joins the similar proposals of Soboh et al. (2012) and D'Amato et al. (2021).
This study is also the first to introduce size as an element that mediates the relationship between different types of firms (cooperatives or IOFs) and profitability. Our results show that the relative performance of cooperatives and IOFs varies depending on their size. The emphasis on size as a moderator in the relationship between profitability and company type suggests that this may be one factor responsible for the differences revealed in previous studies that compared the profitability of both types of companies. Therefore, size is an element to consider when comparing the profitability and efficiency of cooperatives with those of other companies.
However, this study also has limitations. The results refer to only one activity sector and two comparative periods. These limitations provide new lines of research, as we intend to determine whether the same effects can be found in other sectors and periods. Although increased size was found to result in a loss of profitability for cooperatives relative to IOFs, a differentiated analysis has yet to be conducted to determine what part of this loss of profitability is caused by an increase in member services and what part is a consequence of costs inherent to the cooperative organisational model itself. Other lines of research could aim to analyze the efficiency of the economic activity of other social economy families compared with IOFs. Thus, further research could demonstrate whether the social economy is not only more sustainable but also more efficient and under what conditions.
CRediT authorship contribution statementElena Meliá-Martí: Writing – original draft, Methodology, Formal analysis. Adoración Mozas-Moral: Writing – review & editing, Funding acquisition, Conceptualization. Enrique Bernal-Jurado: Writing – review & editing, Validation, Formal analysis, Conceptualization. Domingo Fernández-Uclés: Writing – original draft, Methodology, Formal analysis.
Krugman (2023) indicated that, while extreme inequality is tearing societies apart, and environmental damage is making the planet increasingly uninhabitable, much can be done at the lower levels, especially by third sector organisations in which cooperatives make up the core family.
García Pérez et al. (2024) noted that agri-food cooperatives adopt analytical or hybrid strategies that aim to balance efficiency and cost control with innovation.