


This study takes the central, provincial and municipal Environmental Protection Interviews (multi-hierarchical EPI) as a mechanism innovation for precise environmental regulation in Yangtze River Delta (YRD) and constructs a multi-cutoff regression discontinuity design to accurately measure the policy effects of multi-hierarchical EPI on air quality improvement in YRD. Overall, the findings demonstrate that EPI at all levels is correlated with improving the air quality for interviewed cities in the short term, which tends to weaken after 3–6 months and may even rebound to the initial level after a longer period. The improvement effect of EPI on air quality is primarily reflected in controlling the pollutant concentration of PM2.5, PM10 and NO2. Moreover, there were great differences in the policy effects of the multi-hierarchical EPI for air quality improvement amongst cities in YRD. The higher administrative level of EPI, the stronger policy effects of the corresponding EPI were. The provincial and municipal EPI are likely to involve initiative regulation and exert greater effects. Some cities under the provincial and municipal EPI could break through the hierarchical constraints and shift to stronger air quality improvement effects, providing new reference for China's precise environmental governance mechanism.
Governments have employed extensive measures to alleviate the threat of environmental damage (UNFCCC, 2015). The Chinese government has implemented mandatory environmental regulation policies to achieve environmental improvement for the past decades; however, the central government's unified mandatory regulations haven't brought about satisfactory effects. The 2020 Ecological Environment Bulletin of China showed that 135 cities failed to meet air quality improvement requirements (Zeng et al., 2023). The central government determined that more precise governance amongst various cities should be urgently implemented and could have more accurate regulatory effect. As traditional environmental regulation policies failed to solve some previous environmental issues, the Ministry of Ecology and Environment of China formally issued the Interim Measures for Environmental Protection Interview (EPI) in 2014 and conducted vertical environmental supervision of EPI over local governments with severe environmental issues (Jin et al., 2021; Zeng et al., 2023). The central government interviewed municipal government officers to alert cities to prioritise stricter environmental regulation. Central EPI implementation currently follows a pattern of ‘downward decentralisation’ and ‘upward centralisation’ regulation features for the interviewed cities (Ma et al., 2022; Zhang & Wang, 2013; Huang & Chen, 2014; Fan & Liu,2013). The Ministry of Ecology and Environment of China also encourages provincial and prefecture-level governments to conduct deepened and personalised regulation policies for better environmental regulation effects. The Ministry of Ecology and Environment has established an improved vertical regulation mechanism by standardising the typical interview behaviour and instituting standardised governance based on effective experience and practise in recent years. Aiming for precise governance, EPI implementation has broken the traditional environmental governance logjam, stimulating provincial and municipal EPI in addition to central EPI, enabling cross-level governance and advancing precise governance.
Unlike previous environmental regulation policies, EPI may be triggered by inadequate government supervision, the high frequency of heavily polluted weather and prominent problems with enterprises’ illegal emissions. EPI is a mandatory regulation with high-level regulation strength, and EPI-regulated cities could exert a deterrent effect for provinces or cities without central EPI. Un-interviewed cities with more crisis awareness and heightened pursuit of green growth are more likely to adopt a provincial or municipal EPI initiative. The multi-hierarchical EPI, (i.e. central, provincial and municipal levels) combines various levelled responsibilities and regulatory institutions (Zhang, 2021) and EPI strengths tend to weaken level by level and the policy effect of environmental governance is unsatisfactory (Shimiluowa & Wang, 2011). Correspondingly, previous research has demonstrated that the multi-hierarchical EPI has differing regulatory roles for environmental improvement (Yang, 2022; Zhang, 2022). Furthermore, there is wide variation in governmental processes (Gong & Zhang, 2022; Shen & Zhou, 2017), as the procedural preferences of multi-hierarchical governments regarding environmental governance may not be entirely consistent (Su & Tang, 2021).
As noted, given the multi-hierarchical practice pattern of EPI in China, the associated regulatory targets vary amongst administrative levels (Huang, 2013). Normally, both the central- and provincial-level EPI target the corresponding lower-level (provincial and municipal) local governments to advance environmental improvement with regulatory measures and the municipal-level EPI primarily targets local micro-enterprises and streets to control emissions with detailed measures. This approach could lead to various differences in both the incentives and effects of EPI from multi-hierarchical perspectives (Wang, 2021). Second, the multi-hierarchical governments may have conflicting goals and place differing emphasis on both environmental governance and economic development (Yi, 2019). Both provincial and municipal governments must consider the balance between economic growth and resource constraints when implementing environmental policies (Zhang et al., 2020). This balance emphasis may result in divergent directions and implementation intensity for the multi-hierarchical governments, which could generate remarkable differences in the personalised precise governance process for provinces and cities (Wang, 2021). Specifically, the central EPI predominantly targets prefecture-level municipalities with major pollution challenges and requires local governments to share feedback and develop treatment plans to address environmental problems within an agreed time frame. According to the existing provincial and municipal EPI in China, the provincial EPI is primarily for cities that do not meet the standards or lag in the provincial rankings. The municipal EPI is mainly triggered by environmental problems reported by the local public or automatic monitoring data exceeding standards in the jurisdiction and is often directed towards district and county governments or key enterprises in a city. Moreover, cities with more focus on green growth could also conduct municipal EPI. In this sense, central EPI is close to a mandatory environmental regulation policy, while the provincial and municipal EPI is closer to self-monitoring and is a proactive environmental regulation initiative.
Most recent research has concentrated on the central EPI (Wang et al.,2022a; Wang et al.,2022b; Wang, 2019), and few studies have examined the provisions, implementation goals and development patterns of EPI at provincial and municipal levels (Zhang, 2018) or examined the governance effectiveness of EPI at various levels. The multi-hierarchical EPI could be an exploration of possible precise governance for various cities. Investigation of central EPI alone does not reflect the boundaries of contemporary policies. Accurate evaluation of the policy effects of multi-hierarchical EPI could benefit the clarification of the governance characteristics and future precise governance for various regions.
Teng & Ou (2021) asserted that local governments have a major role in environmental governance efficiency. Regions with more focus on green growth could take more initiative to enhance the province and municipal cities by implementing the provincial and municipal EPI. The cities in the Yangtze River Delta (YRD) are often considered to be the pioneers in green growth and environmental regulation. As an essential aspect of China's regional integration reform, YRD has supported a number of environmental governance initiatives, including the multi-hierarchical EPI. EPI-regulated cities in YRD could have a deterrent effect on the provinces or cities without central EPI. Un-interviewed cities with more crisis awareness and stronger pursuit of green growth are more likely to adopt provincial or municipal EPI initiatives for cities (Zeng et al., 2023). The problem of air pollution has become more severe due to on-going urbanisation and rapid economic development, particularly in YRD, which is both densely inhabited and commercially developed (Wang, 2020), and poses a serious public health threat in contemporary China (Gao et al., 2023; Ebenstein et al., 2015; Stanaway et al., 2018; Saunila, 2020).
This study focuses on identifying the mechanism innovation of the multi-hierarchical EPI on precise governance, using a multi-cutoff regression discontinuity (RD) design to measure the detailed policy effects of multi-hierarchical EPI on air quality improvement with sample data in YRD. To reach this objective, this investigation raises the following questions to provide a new basis for precise environmental governance in China. Does the multi-hierarchical EPI present a precise mechanism innovation of precise environmental regulation for various cities in YRD? Does the multi-hierarchical EPI have differing regulatory effectiveness on air pollution control? As pioneers in green regulation, could some cities transform the mandatory EPI policies into regulatory initiatives and achieve more sustainable treatment effects by breaking through the hierarchical features?
To clarify the above issues, the remainder of this study proceeds in the following manner. Following the introduction, section 2 reviews the literature on the policy effects of EPI, policy effectiveness evaluation and policy in YRD. Section 3 presents the study's research methodology and details regarding variable selection based on the collected sample data. Section 4 provides an assessment of the short-term and long-term effects of multi-hierarchical EPI. Section 5 concludes and provides closing remarks.
Literature review and hypotheses developmentLiterature reviewResearch on policy effects of EPIThe initial intention of EPI was to ensure that local governments implement effective environmental regulation policies (Sun et al., 2020). EPI implementation has significantly affected the way local governments regulate environmental concerns (Wang & Yue, 2021). A series of research has endeavoured to measure the improvement effects of atmospheric pollutant regulation, demonstrating that different pollutants can respond differently to the same EPI and the improvement effect of various pollutants differs remarkably (Zhao et al., 2020). Wu et al. (2018) found that the improvement effect of EPI on sulphur dioxide (SO2) concentration was obvious, the effect on PM2.5 occurred with time and the effect on PM10, nitrogen dioxide (NO2) and carbon monoxide (CO) was not obvious and the concentration of ozone (O3) increased rather than decreasing. In contrast, with the evidence from 25 central EPI interviewed cities, Shi et al. (2017) found that EPI's treatment benefits were limited to PM2.5 and PM10 and had no impact on other air pollutants, while Wu et al. (2018) determined that the central EPI had no influence on the Air Quality Index (AQI) using a difference-in-difference (DID) method. The persistence of the beneficial effects of EPI on improving and reducing pollution emissions is a contemporary topic of debate amongst researchers (Wu & Wang, 2019; Pan et al., 2022; Shi et al., 2017). Some scholars have asserted that EPI is effective in the long term (Pan et al., 2022), while others disagree regarding long-term effectiveness of EPI (Wu & Wang, 2019).
Previous research has indicated that EPI could also exert indirect behaviour mechanism and policy effects for advancing sustainable growth. EPI has been found to only be effective in improving environmental performance over the long term when it spurs businesses to pursue technical innovation (Wang et al.,2022a). Specifically, EPI encourages micro-enterprises to make more environmental investments and strengthens government subsidies as an environmental incentive strategy to ensure that local governments provide active subsidies (Wang et al.,2022b). In this sense, local governments have exerted pressure on firms to adopt green innovation initiatives through EPI (Wang et al.,2021a).
Similarly, regional EPI implementation has also encouraged enterprises’ increased green innovation, which is particularly notable for practical green innovation (Yu, 2021). EPI in one region has also exerted a spatial deterrent effect for un-interviewed cities, Wang & Yue (2021) confirmed this assumption, finding that the motivating innovation effect primarily concerned substantive green innovation, with no appreciable impact on strategic green innovation. In addition, some scholars have contended that EPI's effects are not long-lasting (Wang, 2019).
Research on policy effect evaluation approachesPrevious research has applied the analytic hierarchy process (Chen, 2009), DID method (Wu et al., 2018) and RD design (Salman et al., 2022) to assess the policy effects of governmental regulations. RD design is based on quasi-natural experiments, and a number of scholars have conducted studies to measure corresponding policy effects of policy with one cutoff. For example, some researchers have employed sharp RD design to determine the causal relationships between environmental governance, winter heating and other policies and environmental pollution (Cai et al., 2020; Wang & Zhao, 2021), Salman et al. (2022) adopted fuzzy RD design to evaluate the policy interventions of the Paris Agreement on environmental efficiency and greenhouse gas emissions in 162 countries from 1990 to 2020. EPI is a higher level of intervention which abruptly changes local environmental regulatory activities and affects local governments’ environmental governance and regulation. RD design can discriminate between the effects of permanent factors and EPI.
However, the RD design also has some shortcomings in its application process, as it cannot determine whether the change in environmental quality is caused by the new environmental policy or other policies (Xi & Liang, 2015). In addition, the implementation time of policies varies in different regions. As a result, the RD assessment of policy effects with single cutoff definitely lacks sufficient accuracy, requiring the development of alternative techniques for more accurate estimation.
Research on EPI regulatory mechanisms and policy effects in YRDAs a pioneer in environmental regulation and green growth, the performance of YRD's environmental governance is a popular research topic. Many scholars have investigated regional environmental governance performance in YRD urban agglomeration (Hou et al., 2021), particularly in terms of air pollution, finding it to be effective for most cities in YRD and determining that air quality will also be affected by special events (Yang et al., 2019; Wang et al.,2021b). As a newly launched environmental governance policy, different scholars have different perspectives. According to Shi et al. (2017), the central EPI has had different effects on various air pollutants.
Scholars have argued that sustainable development might be made possible if this cooperative ecological governance paradigm is incorporated into environmental governance (Sun & Zhao, 2022). In this sense, some research has concentrated on regional coordinated atmospheric governance in YRD, and the majority have contended that it is necessary to balance the relationships between localities and encourage innovation in environmental governance mechanisms to improve the policy impact of atmospheric governance (Mao & Cao, 2016; Li & Li, 2022; Chen et al., 2022). Mao & Cao (2016) used YRD as an illustration to construct a regional collaborative air pollution governance system and determined that environmental governance was still in an unsolved state with particularly insufficient regional administrative coordination; however, the effectiveness of regional environmental governance can be improved by initiating vertical interventions such as administrative arrangements made by higher-level governments (Li & Li, 2022). Due to spatial variances in regional air pollution characteristics, YRD should be administratively zoned and customised to local conditions to reduce and manage air pollution (Shi et al., 2018). To enable the implementation of differentiated policies at different administrative levels, some scholars have suggested that YRD should be divided into different control areas according to pollutant concentrations and policies with different requirements should be strategically targeted according to different areas to establish a specific system for improving environmental efficiency (Chen et al., 2022; Wang et al.,2022b).
Previous research has contributed to the understanding of policy effect estimation of environmental regulation. Most research concerning EPI have focused on the policy effects of the central EPI, while YRD cities are under the regulatory framework of multi-hierarchical EPI with some cities under central EPI and other cities under provincial or municipal EPI for precise environmental regulation; less research has investigated the possibility of coordinated environmental governance amongst YRD cities. Extremely limited research has investigated the coordinated regulation mechanism innovation and precise policy effects of central, provincial and municipal EPI in YRD. This study explores the research on the innovation of EPI mechanism in YRD since it embraces central government mandatory regulations in addition to including environmental regulation initiatives in cities to further investigate the policy effect of EPI.
Second, the majority of the studies on EPI have focused on the policy effects of the central EPI, and few studies have explored the effectiveness of the multi-hierarchical EPI in YRD or whether the provincial or municipal EPI could exert better effects with possible self-regulatory initiatives. The effect estimations of the multi-hierarchical EPI in this study could offer practical insights to further advance precise environmental regulation practices.
Third, the regular DID method and sharp RD design are used to estimate policy effects, both of which are quasi-natural experiments; however, the DID method is vulnerable to ‘policy endogeneity’ (Chen & Wu, 2015) due to improper grouping. As the implementation timing of the central EPI is definite and has a reliable cutoff point, sharp RD design is more reliable. Moreover, Liu et al. (2022) held that the sharp RD design is also closer to quasi-natural experiments than the DID method, with stronger capabilities for drawing causal inferences and more successfully avoiding endogeneity issues. However, the investigated cities have implemented multi-hierarchical EPI at various time points with specific circumstances. Extremely limited research has adopted RD design with multi cutoffs at various time points to estimate the multi-hierarchical EPI policies in YRD, since the assessments of policy effects with sharp RD have been insufficiently accurate. This study uses a multi-cutoff RD design to investigate the policy effects of EPI at different time points, solving the problem on varying multiple implementation time of the multi-hierarchical EPI amongst YRD cities, which further enhances the research on EPI policy effects.
Hypotheses developmentStudies have demonstrated that EPI can lower obstacles of corporate social responsibility for environmental governance and increase the local governments’ governance effectiveness (Wang & Wu, 2021). Considering the evidence that EPI can promote enterprises’ green innovation while increasing the effectiveness of public attention and local governance (Wang et al., 2022b), this study takes the multi-hierarchical EPI as a potential mechanism innovation for precise environmental regulation in YRD and establishes a multi-cutoff RD design to accurately measure the policy effects of the multi-hierarchical EPI on air quality improvement. For this reason, this study proposes the following hypothesis:
Hypothesis 1 The multi-hierarchical EPI could present a mechanism innovation of precise environmental regulation for a region.
As air pollution contains different kinds of contaminants, to advance the achievement of accurate treatment, this study explores whether EPI exerts the same effect on different pollutants and assesses the duration of EPI treatment effect on different pollutants. Therefore, this study proposes the following hypothesis 2:
Hypothesis 2 EPI in YRD can improve air quality and exerts different improvement effects on differing pollutants, while the effects are mainly limited in the short term.
In terms of local governments’ possible facilitating role in environmental efficiency (Teng & Ou, 2021) and the transmission mechanism of the multi-hierarchical EPI, some debate remains regarding the sustainable impact of the multi-hierarchical EPI on air quality (Pan et al., 2022; Wu & Wang, 2019). The question of whether the multi-hierarchical EPI has the same effect on air quality also lacks clear answers. Therefore, to explore the hierarchical characteristics of the of multi-hierarchical EPI's improvement effect on air quality in YRD, the following hypothesis is proposed:
Hypothesis 3 The improvement effects of the multi-hierarchical EPI on air quality have obvious hierarchical characteristics in YRD, where in the central EPI has the strongest regulatory effects and the municipal EPI has the weakest regulatory effects.
The multi-hierarchical EPI exerts pressure on local governments to improve environmental quality. Are any local governments taking the initiative to interact with the mandatory environmental governance to achieve better policy effects? To explore the possible facilitative regulatory efficiency of EPI for cities in YRD, this study proposes hypothesis 4 as follows:
Hypothesis 4 There are few YRD cities that can transform mandatory policies into regulatory initiative policies to realise more sustainable treatment effects by breaking through EPI's hierarchical features.
Contemporary environmental issues have stimulated the involvement of all levels of government in YRD in environmental regulation. As an initial investigation, this study constructs a proposed precise environmental regulatory framework based on the multi-hierarchical EPI in YRD. The next section presents the research design for the evaluation of the short- and long-term policy effects of the multi-hierarchical EPI using both sharp RD design and multi-cutoff RD design. Furthermore, the study focuses on the multi-hierarchical characteristics of EPI and examines the hierarchical differences in the policy effects. Finally, this study investigates whether there are cities with EPI's effects that can leverage the hierarchical features and realise more sustainable treatment effects.
Research designData sources and sample descriptionThe explanatory variables are obtained from the China Stock Market&Accounting Research Database, including the AQI and air pollutant concentration (PM2.5, PM10, SO2, CO, NO2 and O3). The meteorological data are obtained from the Huiju data website. As the earliest EPI was initiated in May 2014, the study chose a time span of 1 January 2013 to 30 June 2022 in order to compare the explanatory variables before and after the truncation. The data on EPI comes from the search results of the ecological environmental departments of cities in YRD, China's environmental news and search engines. Some cities are removed due to the lack of meteorological data.
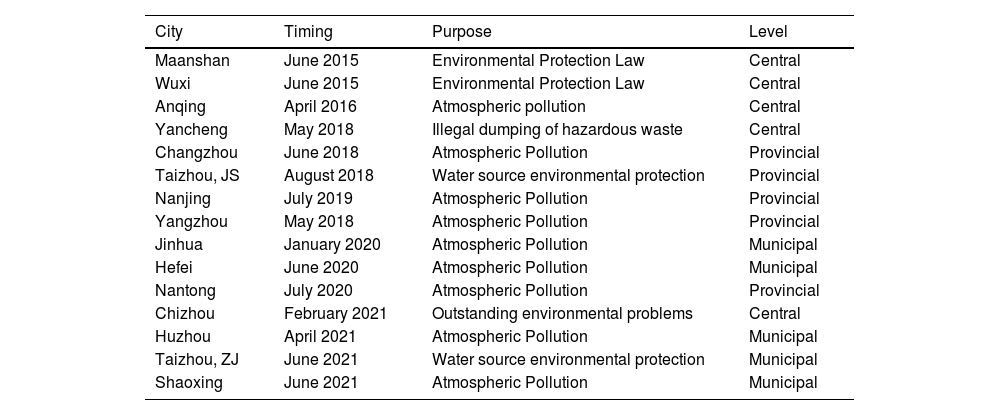
Table 1 details the list of EPI cities in YRD. The first column shows the name of the city, while columns 2, 3 and 4 show EPI implementation time, the implementation objectives and the administrative management level of EPI, respectively. The 15 cities are Maanshan, Wuxi, Anqing, Yancheng, Changzhou, Taizhou-JS (Taizhou in Jiangsu province), Nanjing, Yangzhou, Jinhua, Hefei, Nantong, Chizhou, Huzhou, Taizhou-ZJ (Taizhou in Zhejiang province), and Shaoxing. The listed cities are divided according to the administrative management level of EPI: central level, provincial level and municipal level.
The list of EPI cities in YRD.
Note.Taizhou, Jiangsu is reported as "Taizhou, JS"; Taizhou, Zhejiang is recorded as "Taizhou, ZJ".
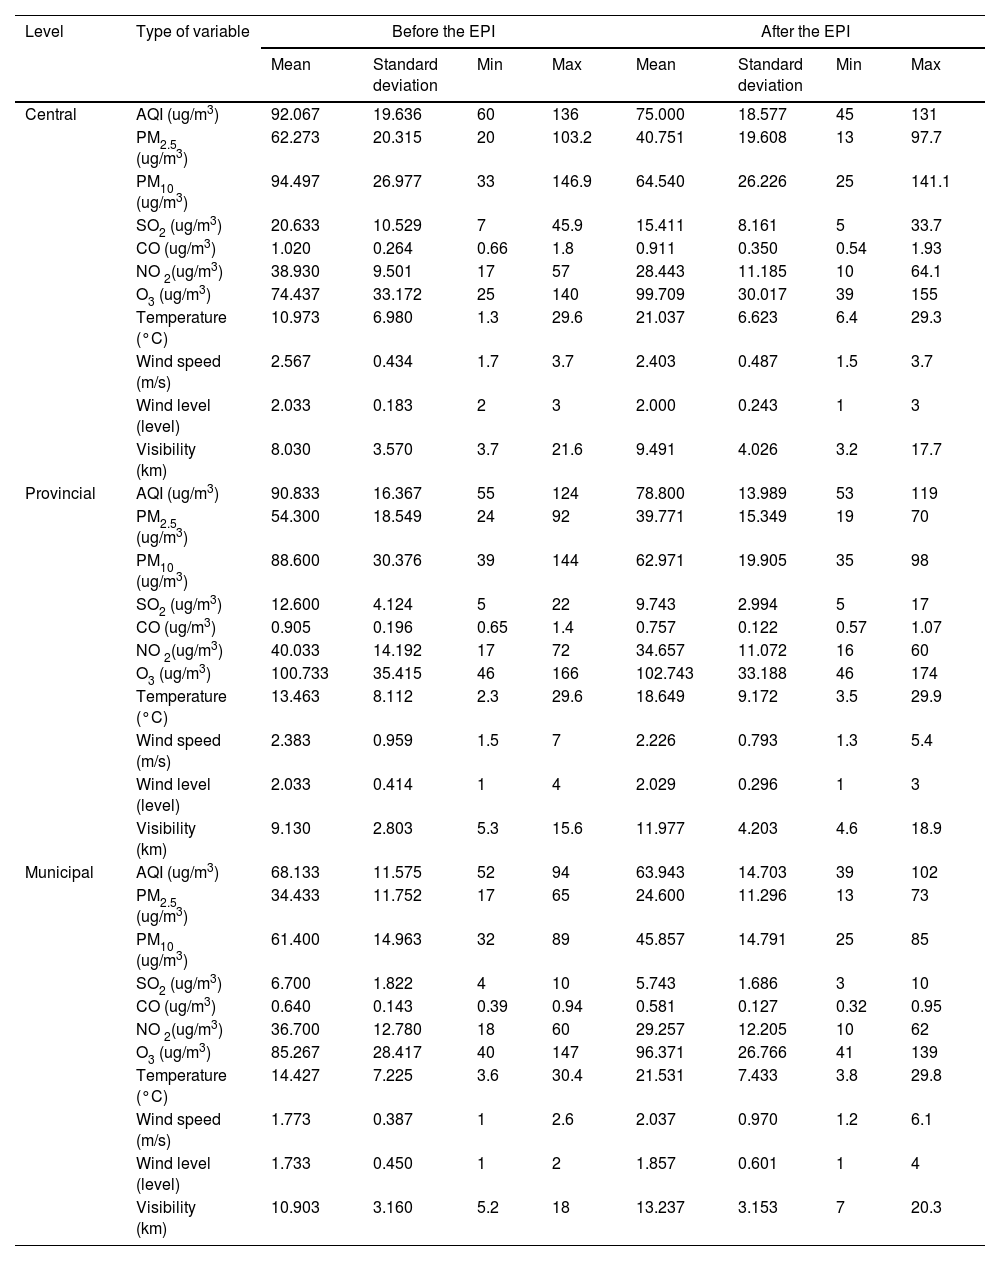
In order to effectively compare the differences before and after EPI, descriptive statistics in this study use data from 6 months before and after EPI. Table 2 presents basic statistics for indicators of various variables in each level, including mean, standard deviation, maximum and minimum values. Descriptive statistical results indicate that: (1) Before the implementation of EPI, the average pollutant index of cities interviewed by the central level government was higher than that of cities interviewed by the provincial level government, and the provincial level was also higher than the municipal level. This indicates that the central government is paying more attention to cities with severe pollution, thus implementing EPI, thus implementing EPI. (2) After implementation of EPI, most of the pollutants decreased. The decrease in pollutant concentration for the central EPI interviewed cities is the largest; while the decrease for the municipal EPI interviewed cities is the smallest. The fact indicates that EPI policy is effective in bringing about environmental benefits, and the governance effectiveness of multi-hierarchical EPI varies. Therefore, this study will further use the sharp RD design to verify the proposed hypotheses.
Descriptive statistics for key variables.
To verify the governance effectiveness of multi-hierarchical EPI, the primary explanatory variable used in this study is EPI, an environmental regulatory policy. This study used the implementation timing of hierarchical EPI to determine the cutoff point. The treatment variable is EPI implementation in each city. This model determined the impact of EPI through the differences before and after EPI, and distinguished it from the impact of some continuously changing variables. Assume that the cutoff is some constant c, and the grouping rule is as follows:

This study uses a sharp RD design to measure the impact of EPI on air quality (Shi et al., 2017), as shown in Eq. (2).

The explained variable is the value of an air quality indicator in month t for the 15 YDR cities. The key explanatory variable is a dummy variable for whether the city implemented EPI in month t, with implementation equalling 1 and non-implementation equalling 0.
The coefficient α is a measure of the magnitude of the jump in the explanatory variable at the cutoff; Zt is a control variable, including temperature, wind speed, wind level and visibility, which are used to control for the effect of changes in weather factors on air quality; β is the direct effect of EPI on air quality, excluding the interference of other control variables in the regression, which is the focus of attention in this investigation.
The sharp RD design cannot handle situations with multiple cutoffs. Therefore, some scholars have proposed the multi-cutoff RD design, one is multi-cutoff RD design with multiple operating variables (Li & Lin,2006), and the other is multi-cutoff RD design with multiple cutoffs (Aguirre & Matta, 2021).
The reason for the occurrence of "multiple cutoffs" in the former is that different individuals have different cutoffs, resulting in the population having multiple cutoffs, which is taken as ‘non-cumulative multiple cutoffs’. For example, when exploring the employment gap between Chinese college students and non-college students, the cutoffs is the specific score. However, due to the different undergraduate score lines in each province, it can lead to the emergence of "multiple cutoffs".
The "multiple cutoffs" of the latter are caused by multiple implementations of the same policy, which can better evaluate the effectiveness of the second implementation. This situation of cutting the same variable multiple times is called ‘cumulative multiple cutoffs’.
In this study, the implementation time of EPI in multiple cities differs, which can be considered as non-cumulative multiple cutoffs. In addition, to examine the lag effect of EPI policy, the effect of EPI after 3 and 6 months can also be considered cumulative multiple cutoffs. To solve this problem, referencing relevant research (Liu et al., 2022), the settings are as follows:
As for the non-cumulative RD design, the individuals are divided into n groups, with varying cutoffs :
where Ci denotes the cutoff value of the group to which the sample belongs. The cutoff Ci∈C with C={c1,c2,⋯,cj}. The pooled average treatment effect can be calculated (Cattaneoet al., 2016; Cattaneoet al., 2020) as follows:
The within-group treatment effect is as follows:

Based on the number of samples in each group, the weights for each group are as follows:

The pooled average treatment effect is as follows:

For cumulative RD design, individuals receive different treatments for different ranges of the running variables. In this setting, individuals receive treatment 1 if Xi≤c1, treatment 2 if c2≤Xi≤c3 and so on, until the last treatment value of Xi≥cj
Denote the values of these treatments as dj, so that the treatment variable is as follows: Di∈{d1d2…dJ}.
Finally, the treatment effect is estimated as follows:
Empirical resultsDirect effects of EPI on air quality
This study takes 15 interviewed cities in YRD as investigated sample cities and uses the sharp RD design to explore the direct impact of overall EPI on air quality. To guarantee the method applicability, this study conducts the performing variable manipulation tests and continuity tests for control variable.
- (1)
Performing variable manipulation tests
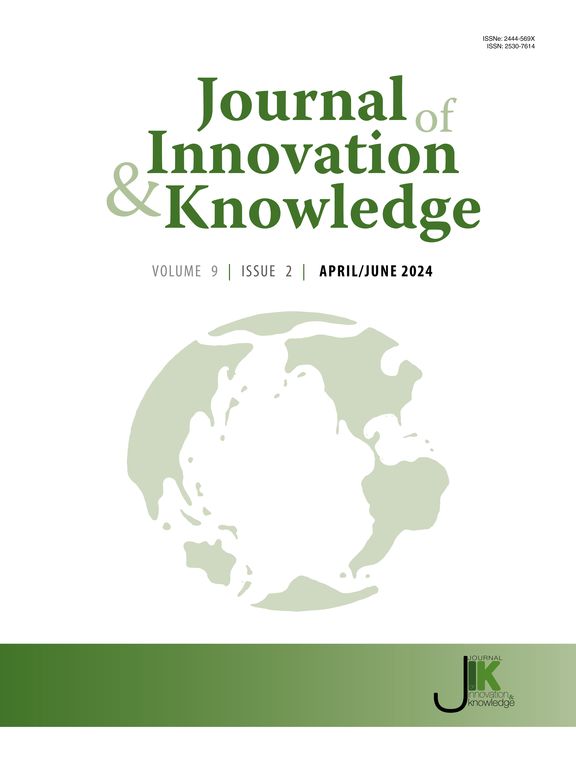
Fig. 1 shows AQI cutoff distribution to test the implementation variables. The confidence intervals around the critical point in Fig. 1 mostly overlap. This demonstrates that the grouping variables are largely free of jumps around the critical point, and there is no significant difference in the density function between the two sides of the cutoff. Therefore, this study is suitable for analysis using a sharp RD design.
- (2)
Continuity tests for control variables

This study introduces monthly meteorological variables such as temperature, wind speed, wind level and visibility as control variables for analysis (Deng et al., 2021), separately testing whether the control variables jumped at the cutoffs and removing control variables with p-values less than 0.05. Table 3 presents the estimation results concerning the variables of temperature, visibility and wind speed. The data regarding temperature and visibility are positively relevant, which indicates that the original assumption cannot be passed; thus, wind speed and wind level are selected as control variables.
- (3)
Analysis of empirical results
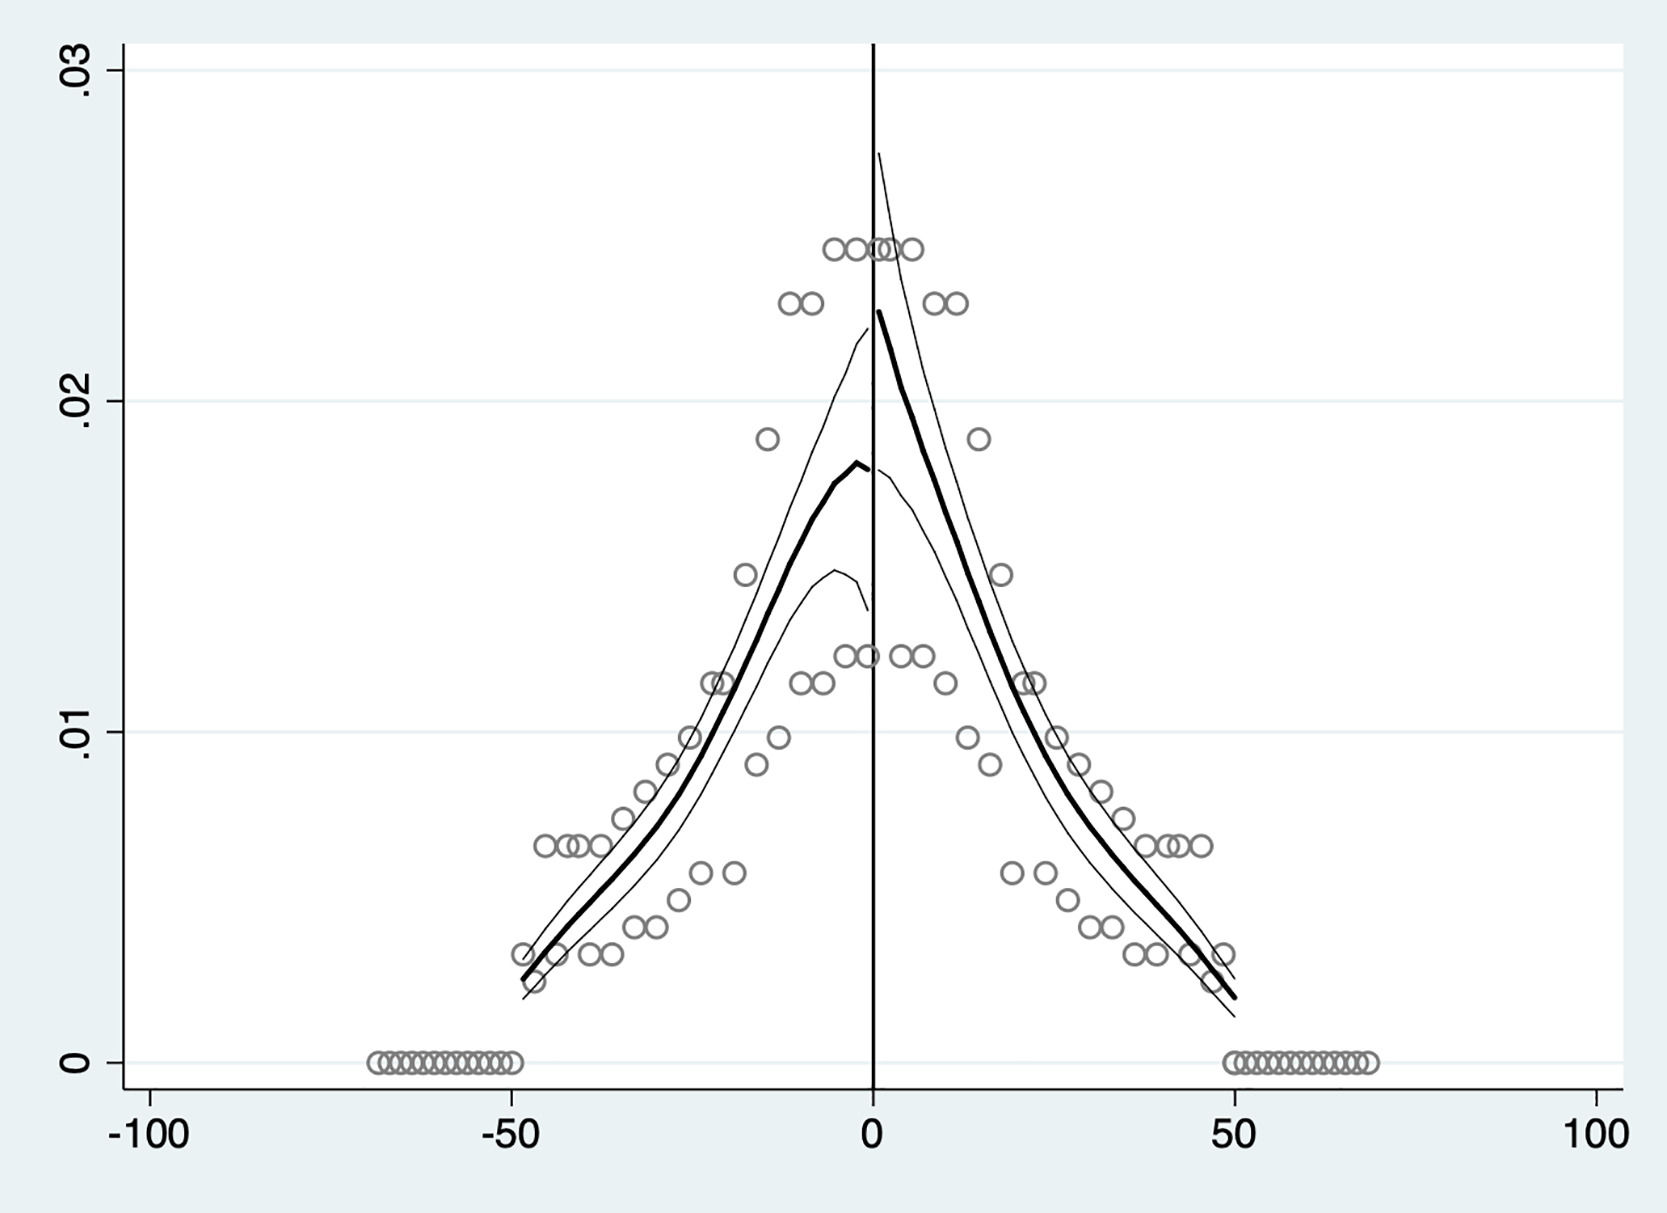
Fig. 2 presents the sharp RD plots before and after EPI. The vertical axis represents the AQI and the horizontal axis represents the time variable after standardisation, with a value of 0 at the point in which the policy had a treatment effect. Fig. 2 reveals a clear downward jump in AQI before and after EPI at the cutoff, indicating a tendency for the AQI to decrease after EPI.

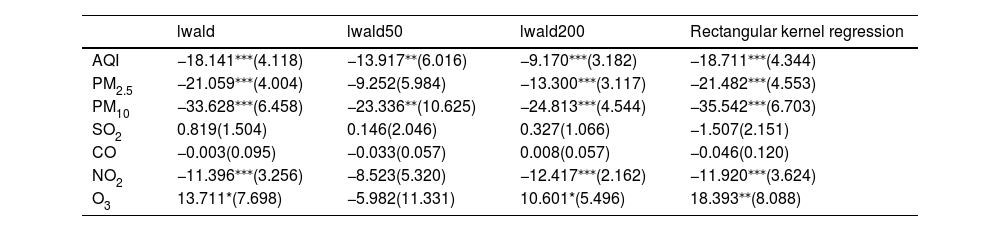
As AQI is a dimensionless index of integrated air quality, it can only reflect the concentration of the top pollutants on a given day, but it cannot reflect the specific pollutants or the possible sources of pollution. Therefore, this study also examines the impact of EPI on specific pollutants, and the results of the sharp RD are presented in Table 4.
Overall effectiveness of EPI in YRD.
Note. *p < .1, **p < .05 and ***p < .01.
Column 1 in Table 4 shows the treatment effects for different indicators. AQI, PM2.5, PM10 and NO2 decreased significantly after governments at all levels conducted EPI, while other pollutants did not. This indicates that EPI can significantly reduce AQI, PM2.5, PM10 and NO2. Amongst them, PM10 decreased the most, followed by PM2.5 and NO2, while SO2, O3 and CO exhibited little or no improvement. The rationale for this may be that the current assessment of air management is primarily focused on PM2.5 and PM10, which receive special attention from local governments. Second, PM2.5 and PM10 are secondary pollutants and are therefore easily controlled in the short term. NO2 is generated by fossil fuel combustion during production and vehicle exhaust; thus, its decline could be due to enterprises ‘temporary ‘shutdown’.
- (4)
Robustness tests
As the RD design is extremely sensitive to model setting conditions, the estimation results could be highly dependant on individual setting conditions; therefore, to ensure the accuracy of the estimation results, this study performs a robustness test on the sample by adjusting the bandwidth and the fitting method.
This study uses bandwidths of 0.5x and 2x for robustness test. In terms of methodology, rectangular kernel regression is chosen. The results are presented in columns 2–4 of Table 4, showing that EPI significantly reduces AQI, PM10 concentration with varying bandwidths and varying kernel functions. Therefore, the robustness result of effectively promoting air quality underlines hypothesis 1 is valid.
Effectiveness of EPI with sharp RD designThis study classifies the 15 YRD cities into 3 groups according to the municipal, provincial, and central EPI in Table 1. This section further uses a sharp RD design to explore whether there are differences in the policy effects of the multi-hierarchical EPI.
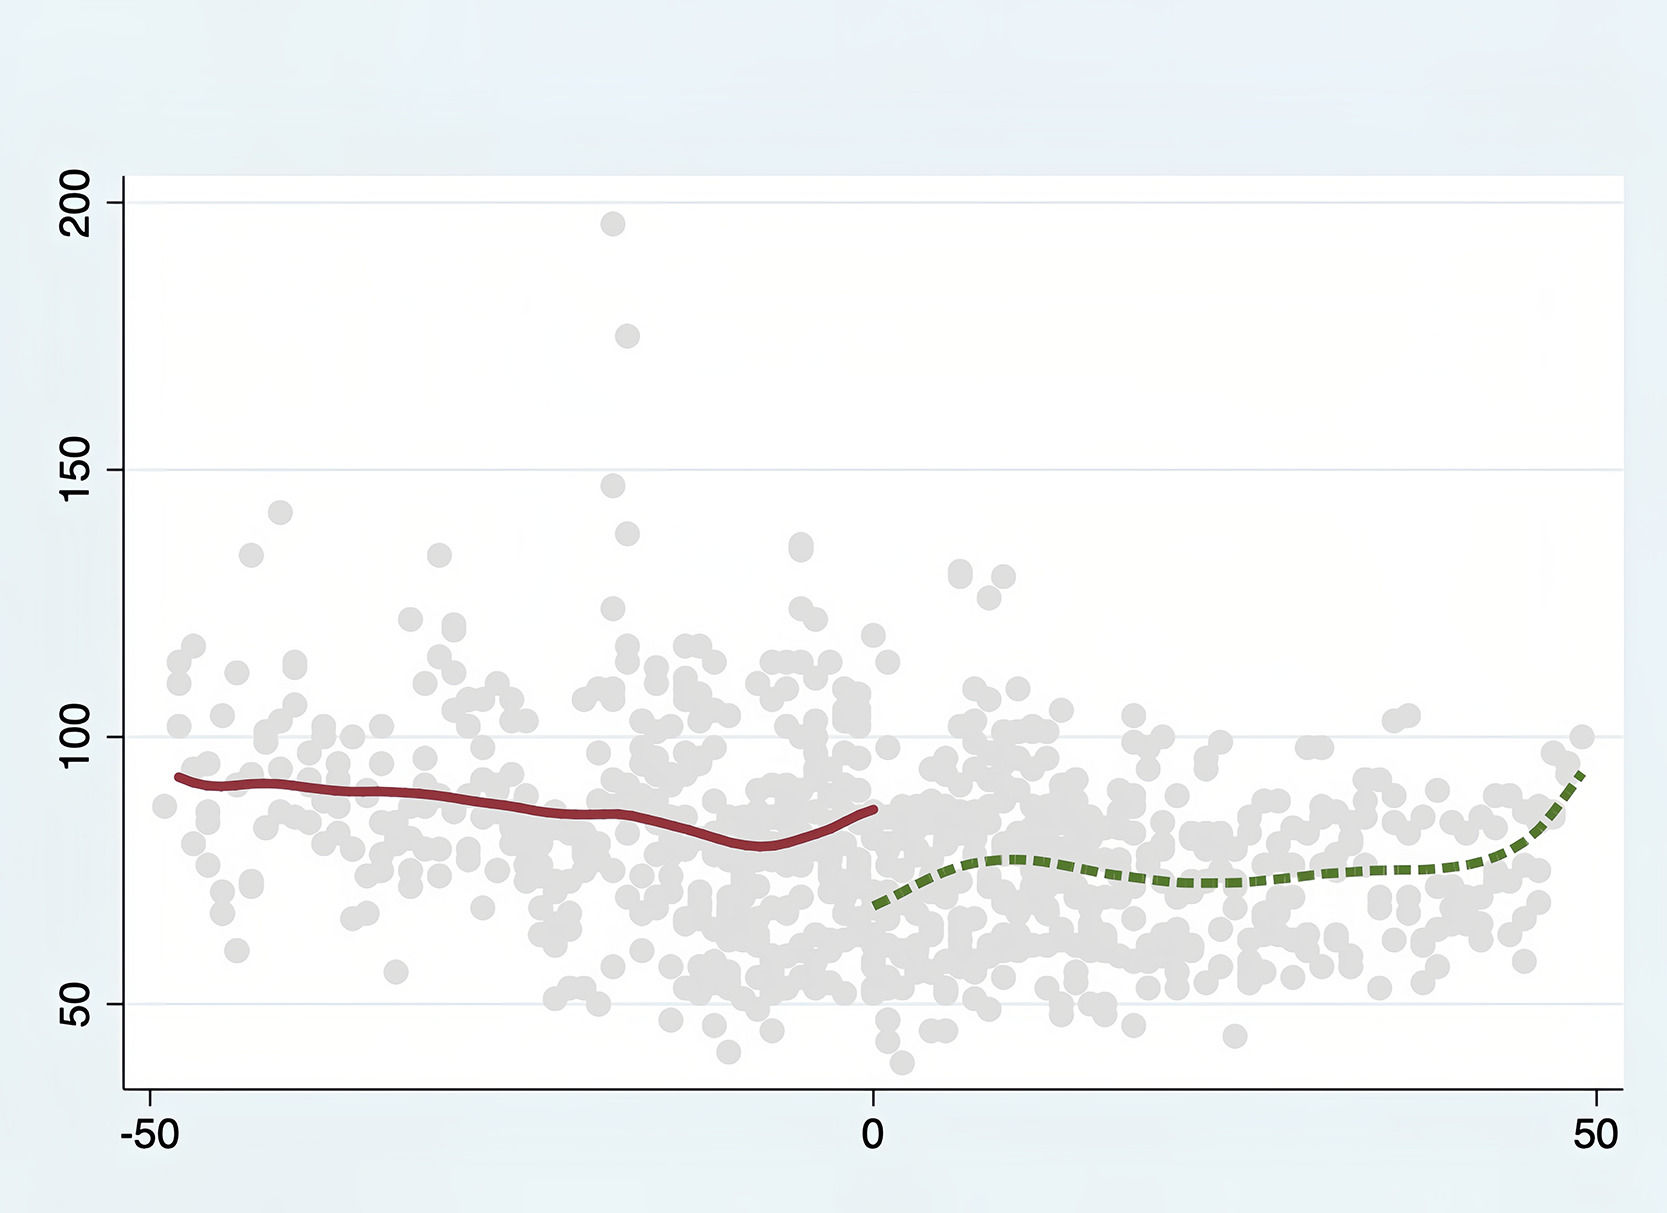
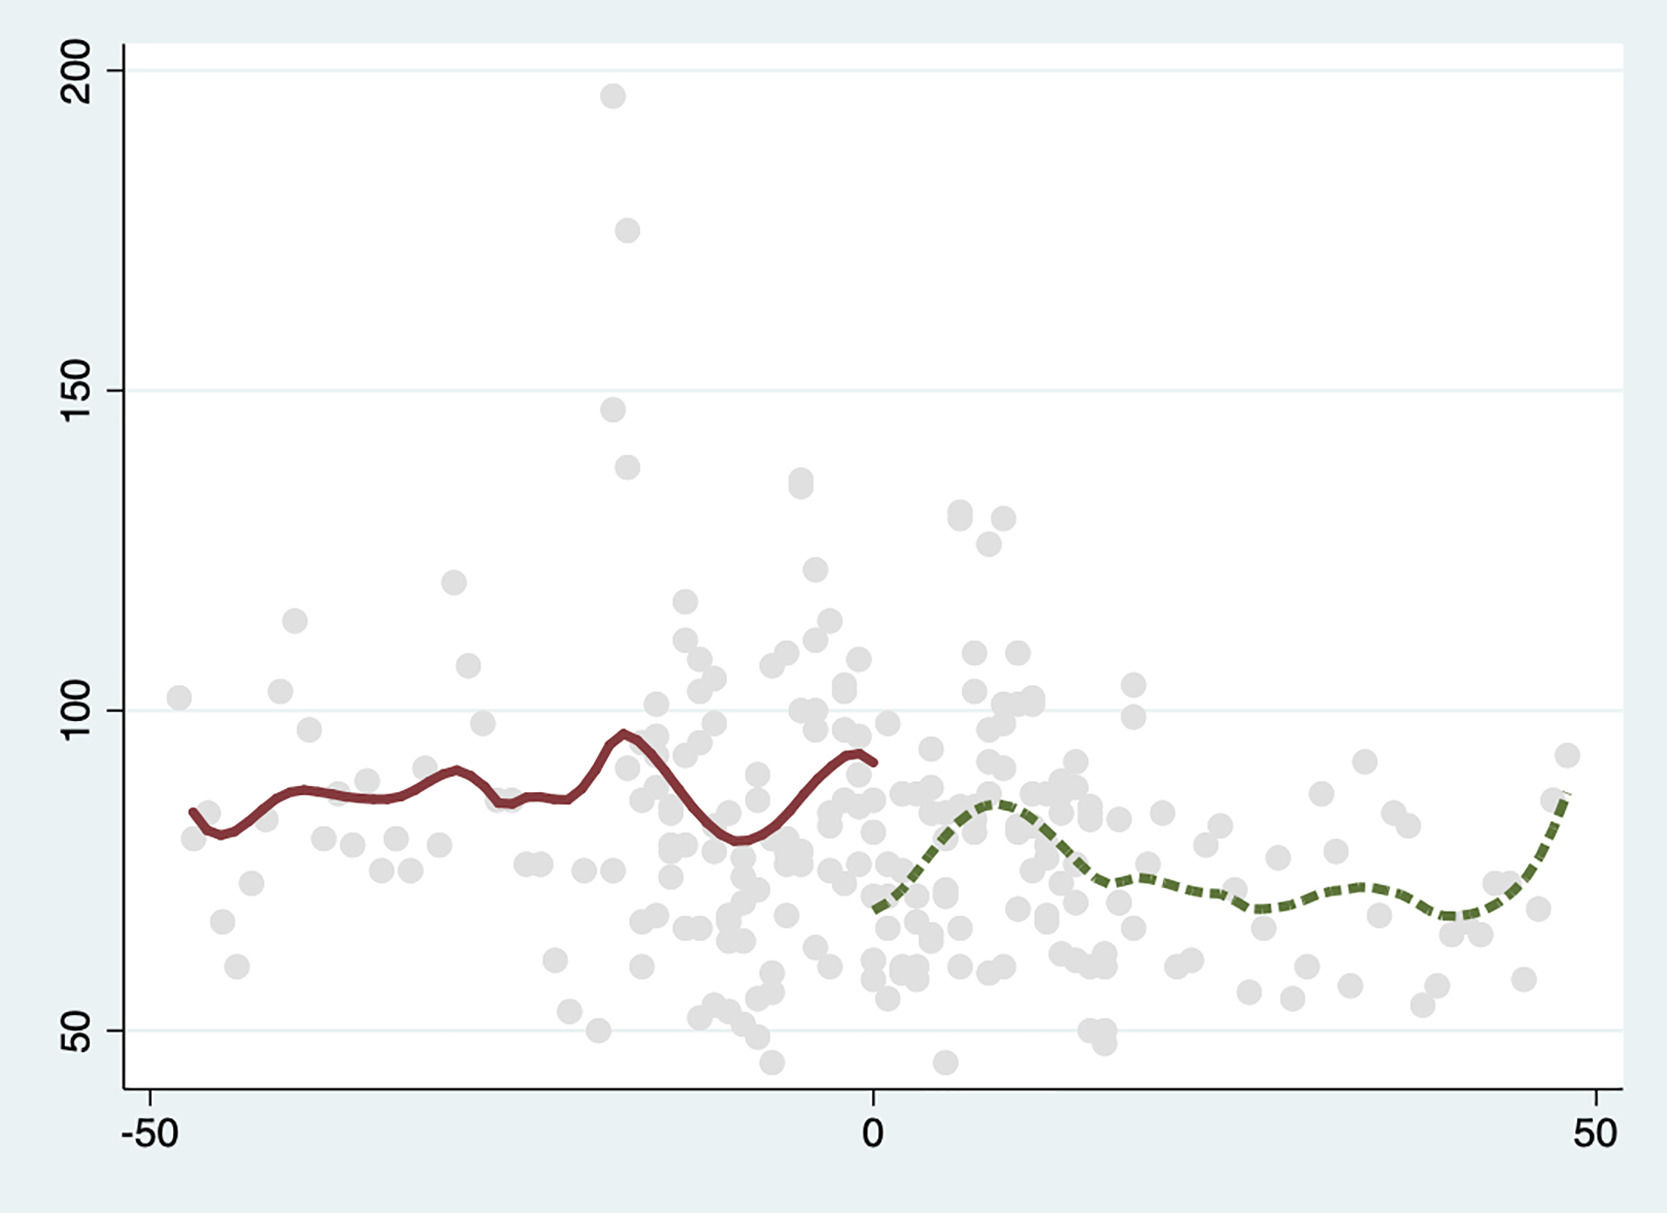
Figs. 3, 4 and 5 show the cutoff effect of AQI for central, provincial and municipal EPI. A consistent downward cutoff trend for AQI is provided for multi-hierarchical municipal, provincial, and central EPI.


After the implementation of EPI by governments at all levels, the AQI dropped ‘cliff like’ at the cutoff point. After a period, the AQI rebounded and finally stabilised. The final AQI ended slightly lower than that before EPI, indicating that EPI has improved the overall air quality of these cities. This may be the result of the strict short-term measures taken by the cities to rapidly improve air management in response to higher-level governments’ inspection. However, these cities may have relaxed regulatory oversight following the inspection, and air quality became worse again, but was still significantly better than before EPI.
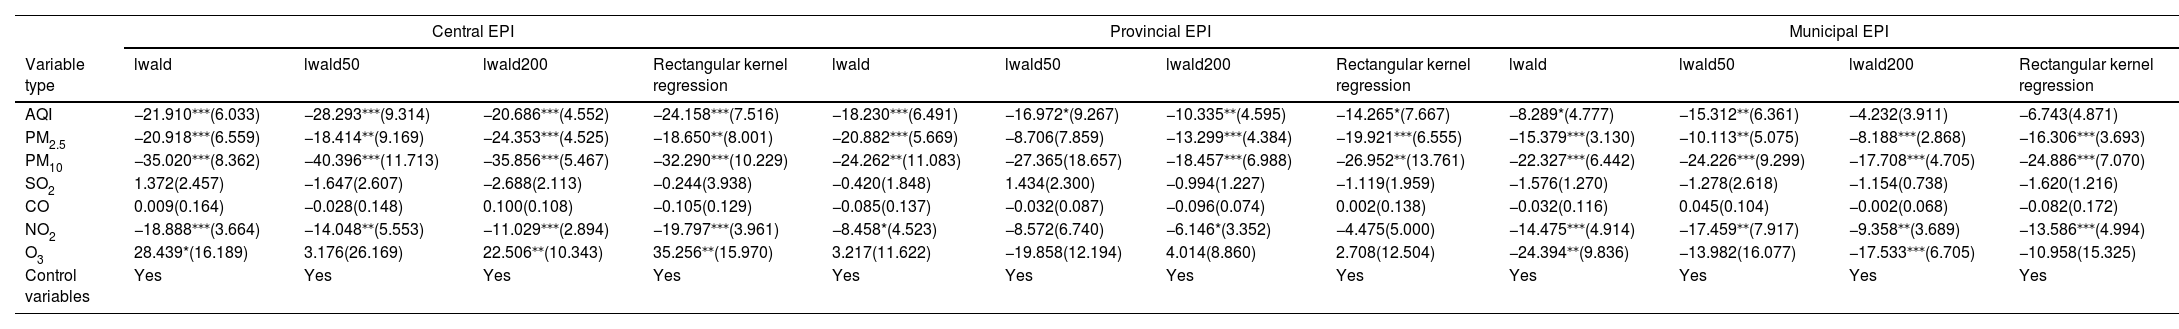
This study further evaluates the improvement effect of multi-hierarchical EPI for AQI and six other pollutants, and the results are presented in Table 5. Columns 2, 6 and 10 show the sharp RD results for the optimal bandwidth, and the remaining columns show the RD results for the robustness test.
Estimated sharp RD results of multi-hierarchical EPI on AQI and six pollutants.
Note: Robust standard deviations are in brackets. ***, ** and * denote 1%, 5% and 10% significance levels, respectively.
The multi-hierarchical EPI brings about varing effects on air quality improvement. In detail, the AQI concentrations significantly decreased by 21.910, 18.230 and 8.289 ug/m3 with the regulation of central, provincial and municipal EPI, respectively. In terms of the robustness test, only the evaluation effect of the double bandwidth of the municipal EPI is poor, and other results passed the robustness test. This suggests that the tertiary EPI can effectively improve air quality, and the governance effect presents the phenomenon of central>provincial>municipal. The result validate hypothesis 3 holds true with the central EPI exerting the strongest regulatory effects and the municipal EPI exerting weakest regulatory effects.
In terms of improvement effects on single pollutants’ concentrations, this study finds that the central and municipal EPI can significantly reduce concentrations of PM2.5, PM10 and NO2, while have little improvement effect on other pollutants. The provincial EPI is less effective than the municipal EPI in reducing PM10 and NO2 concentrations.
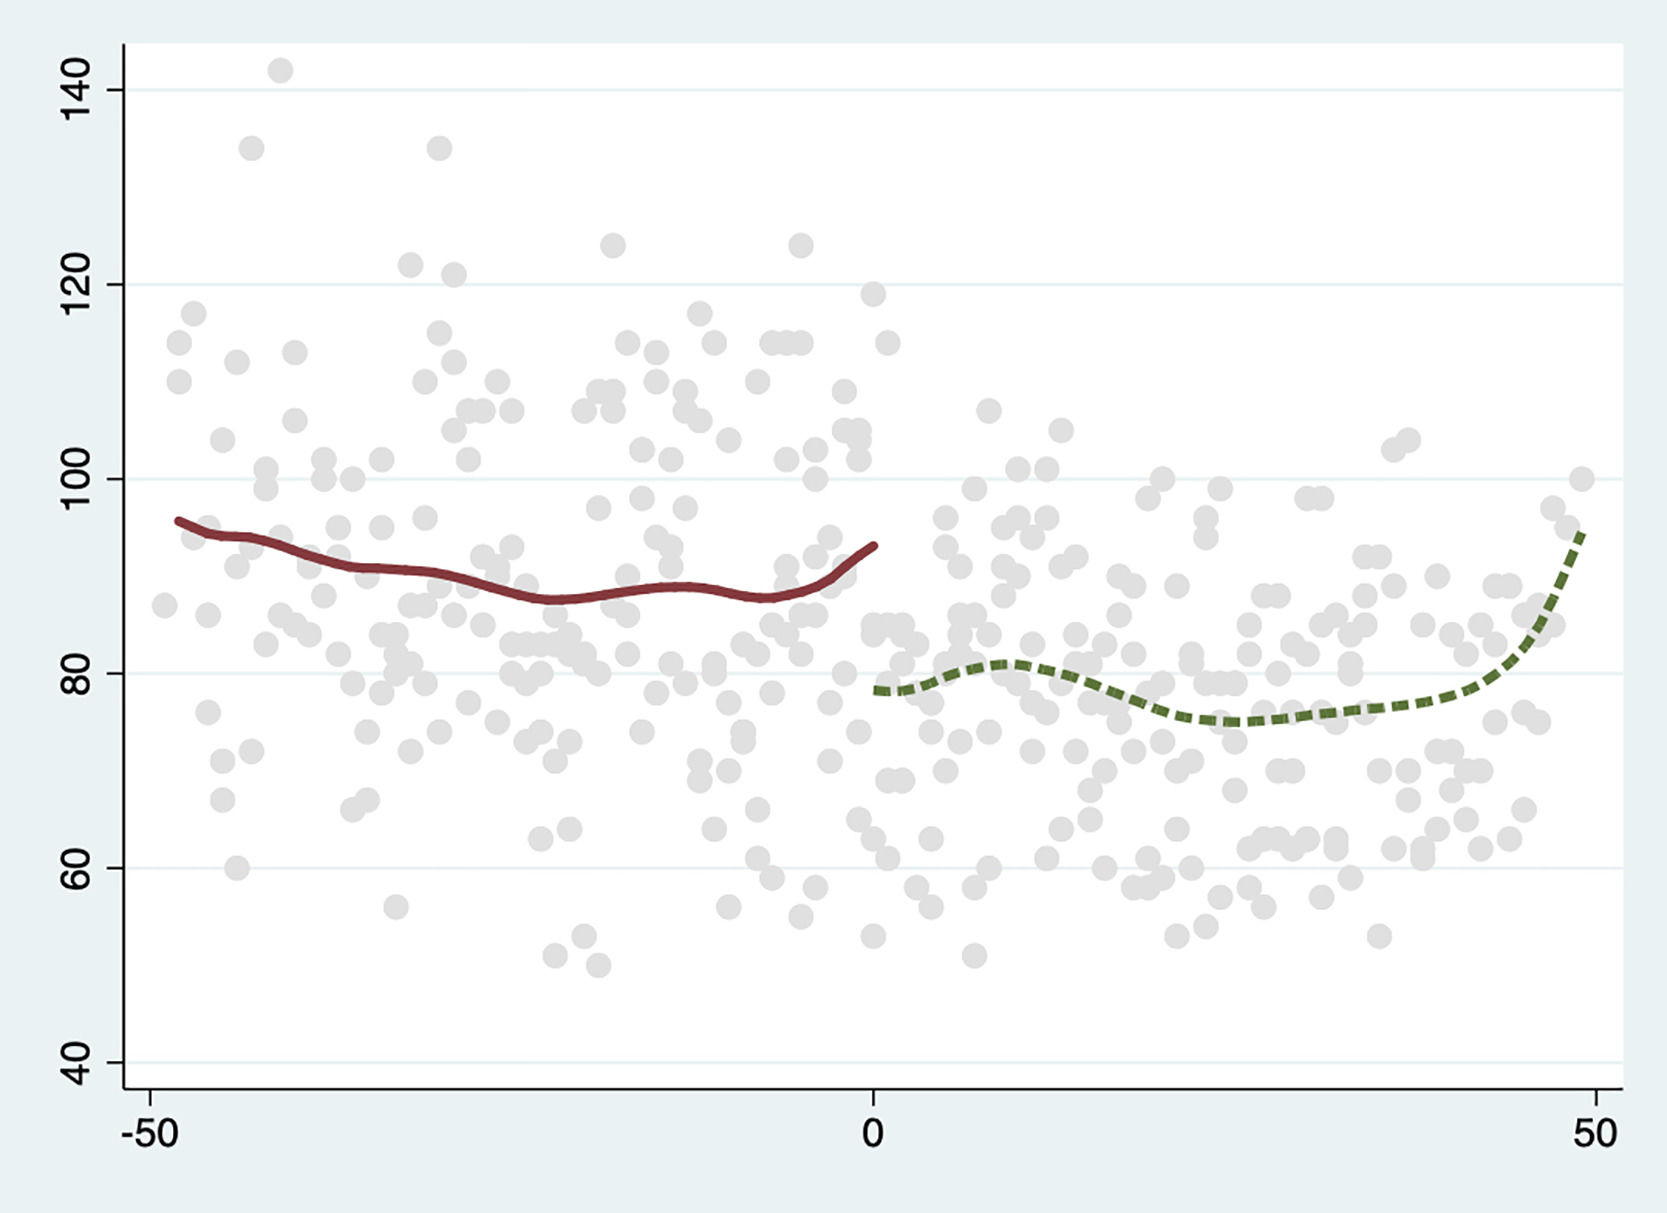
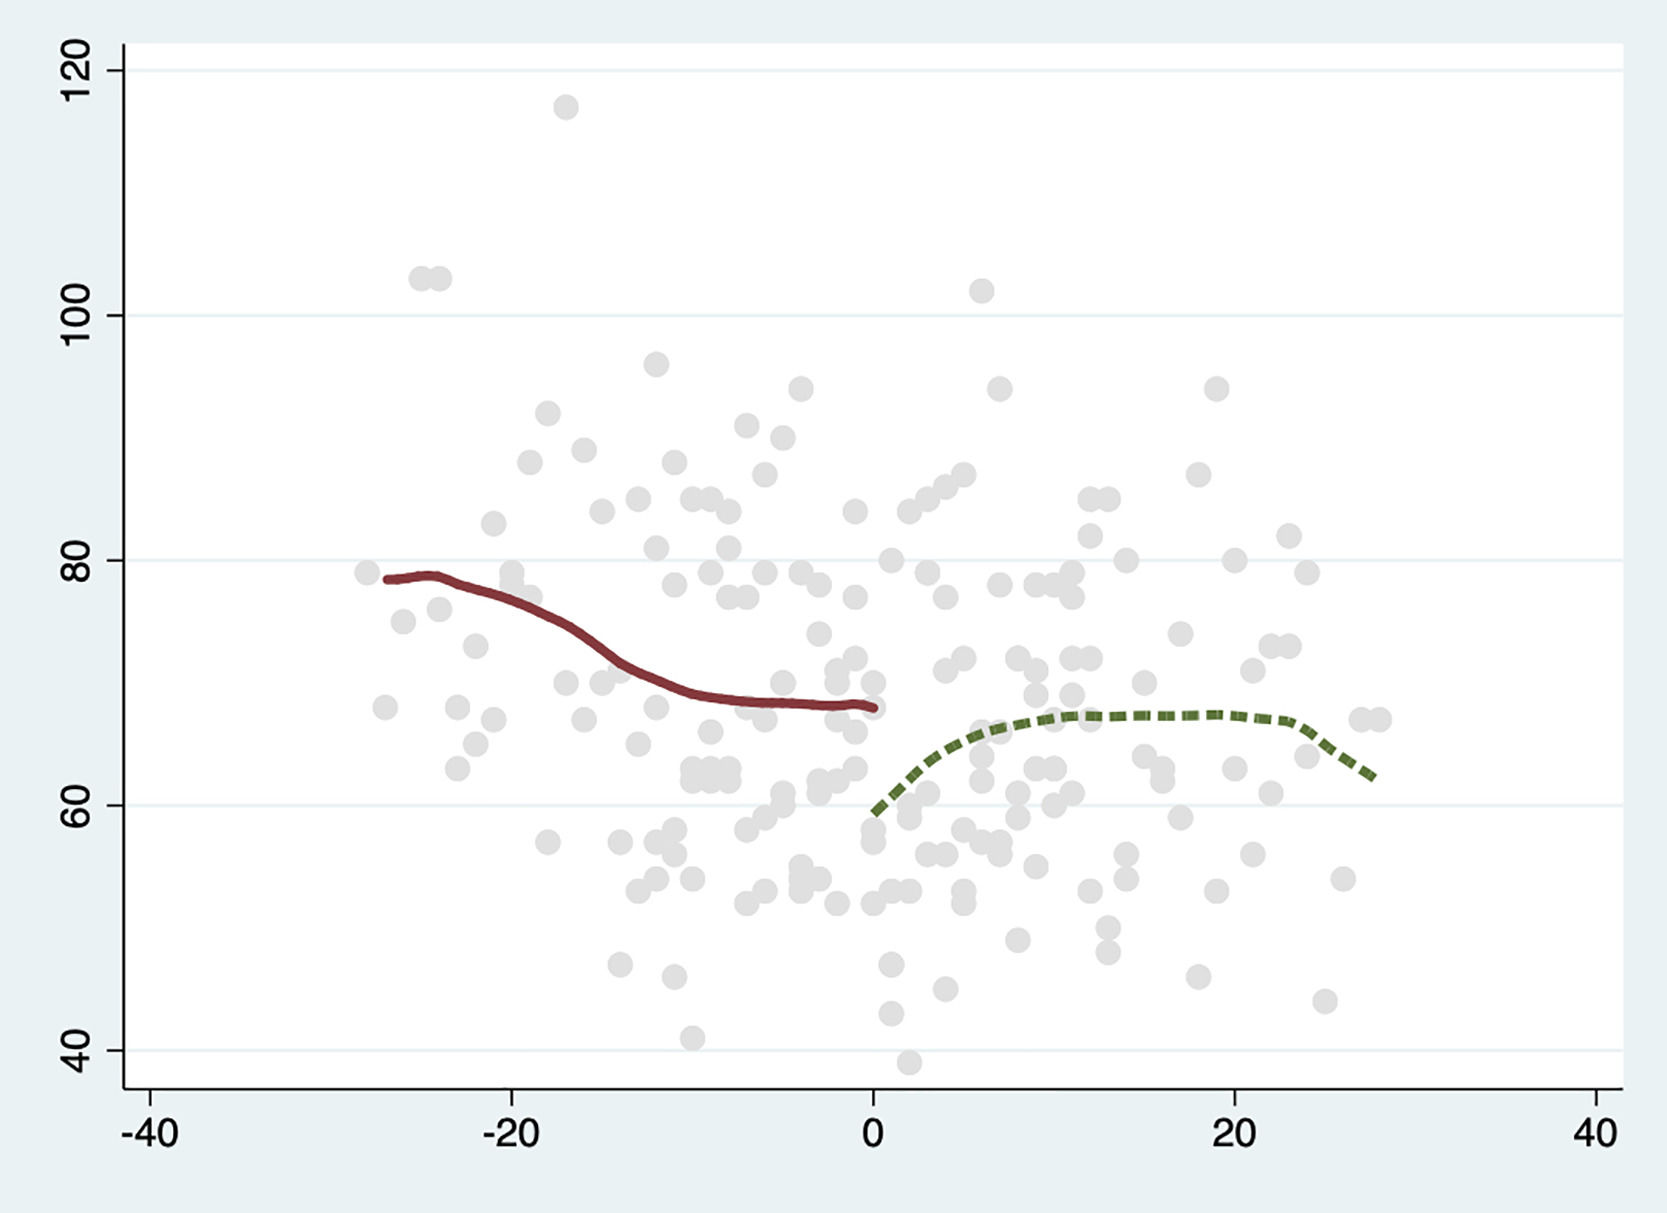
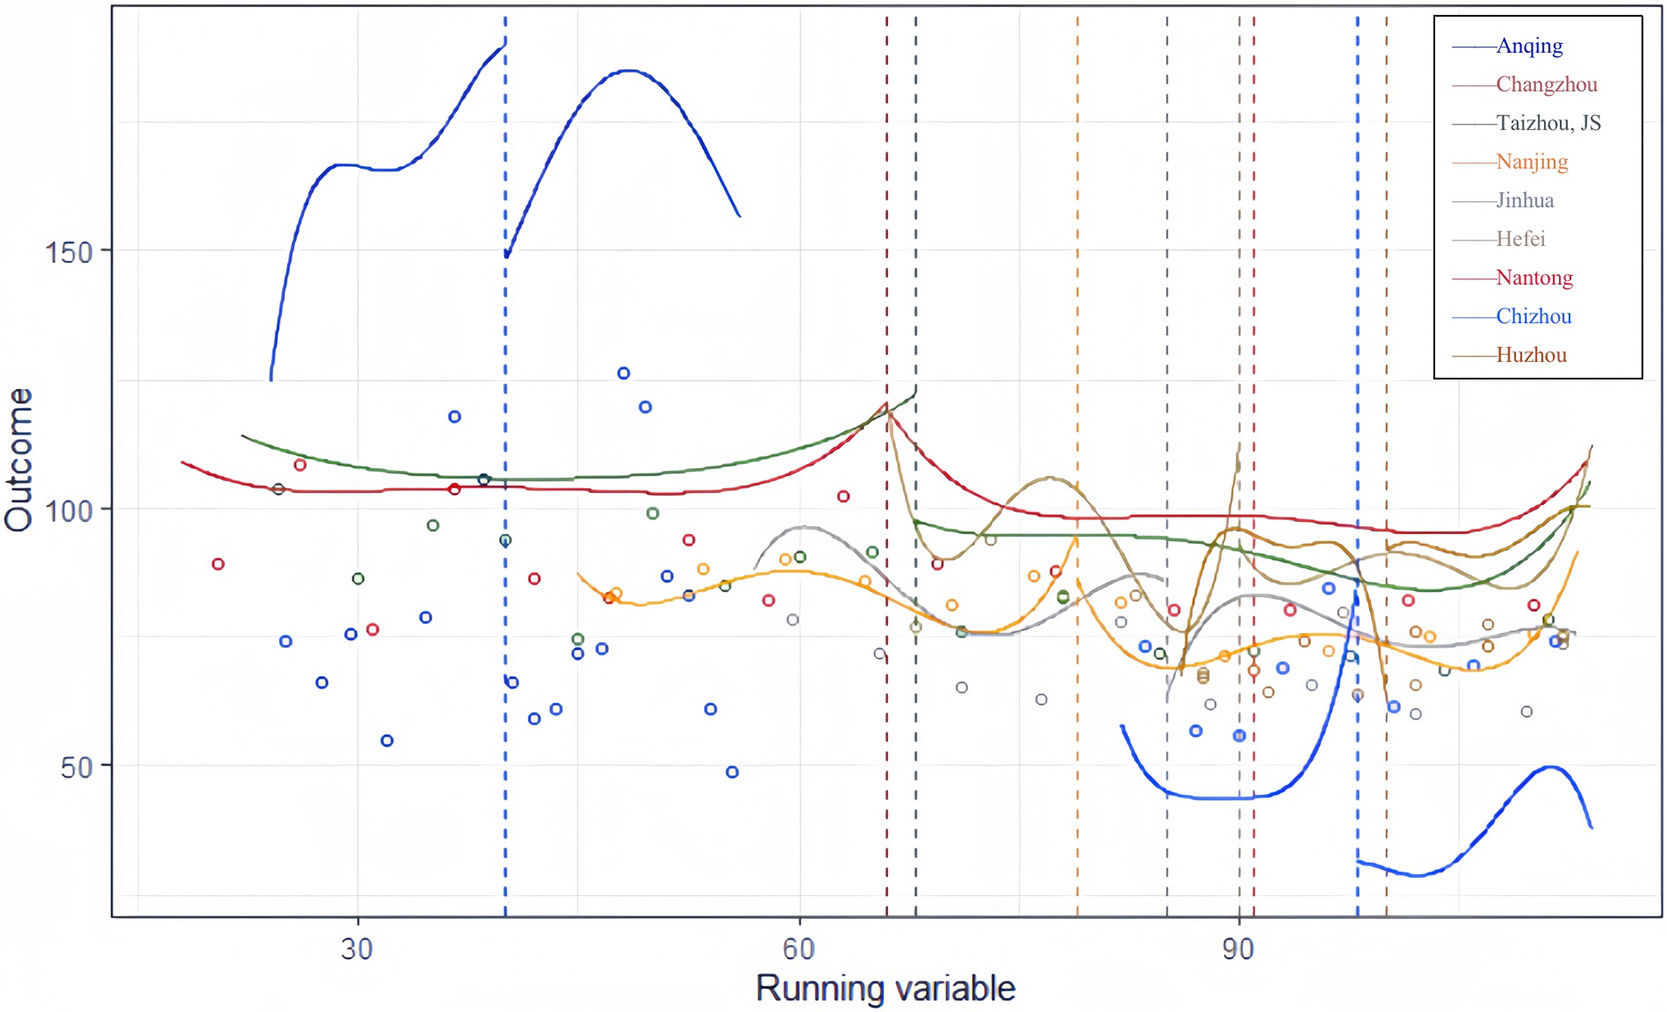
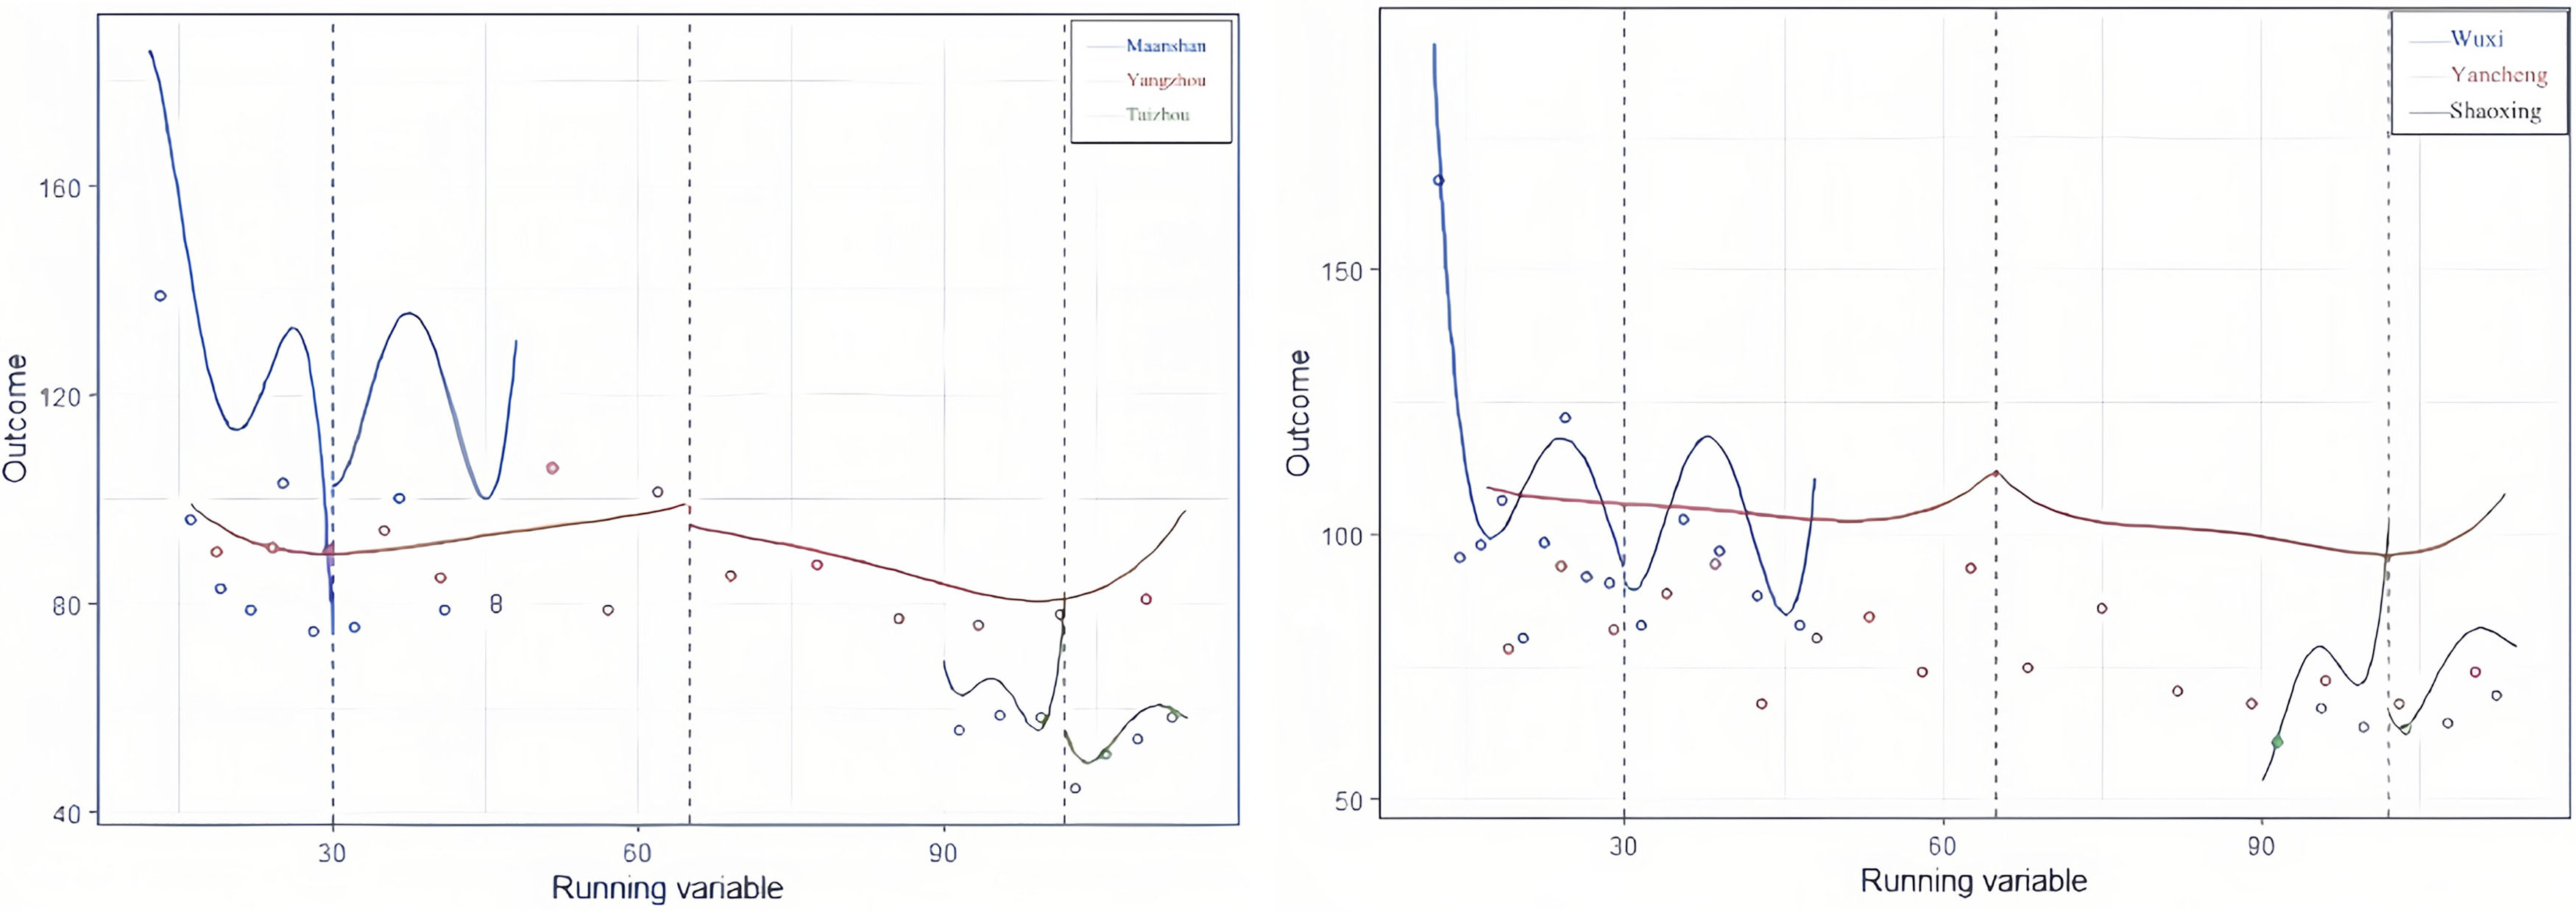
Policy effects of EPI with non-cumulative multi-cutoff RD designPrevious sections clarify the multi-hierarchical EPI amongst cities do have overall varying effects on air quality improvement. Even under the varying levels of EPI, the individual city in YRD pursues to reach the best environmental regulation effect. It is natural to raise the question that have some cities broken the hierarchical features of EPI regulation with the lower level EPI realising the stronger EPI regulation effect than the effects for cities that have been interviewed by higher-level governments. Furthermore, the EPI implementation time for each city also varies according to its interview or regulation schedule. The non-cumulative multi-cutoff RD design (Cattaneoet al., 2020) could consider the multi cutoffs of multi-hierarchical EPI implementation for YRD cities and reach a more reliable conclusion. It can simultaneously process the cities surveyed at different points in time, yielding the cutoff regression plot shown in Fig. 6 (including 9 cities with non-overlapping cutoffs). The EPI implementation time for Maanshan and Wuxi, Taizhou (ZJ) and Shaoxing and Yancheng and Yangzhou are the same. This leads the overlapping of the two cutoffs in the non-cumulative multi-cutoff RD estimation and affects the results. Therefore, the study divides the 6 cities (Maanshan, Yangzhou, Taizhou (ZJ) and Wuxi, Yancheng, Shaoxing) with the same EPI implementation time into two groups for a detailed additional multi-cutoff RD estimation. And Fig. 7 presents the further detailed estimation results of EPI on AQI for the two city groups.

 (left) and Wuxi, Yancheng, Shaoxing cities (right).")
The horizontal axis in Fig. 6 and 7 refers to the time span, in which Time 1 represents January 2013, and Time 2 represents February 2013, etc. The legend in Fig. 6 and Fig. 7 indicates the estimation curve for each city is expressed with different colour. The vertical dashed lines indicate the multiple implementation time of the multi-hierarchical EPI for each city, expressing as multi cutoffs in the estimation.
Figs. 6 and 7 show that there are differences in the effects of multi-hierarchical EPI on improving air quality in different cities, and most cities have a downward jump at the cutoff.
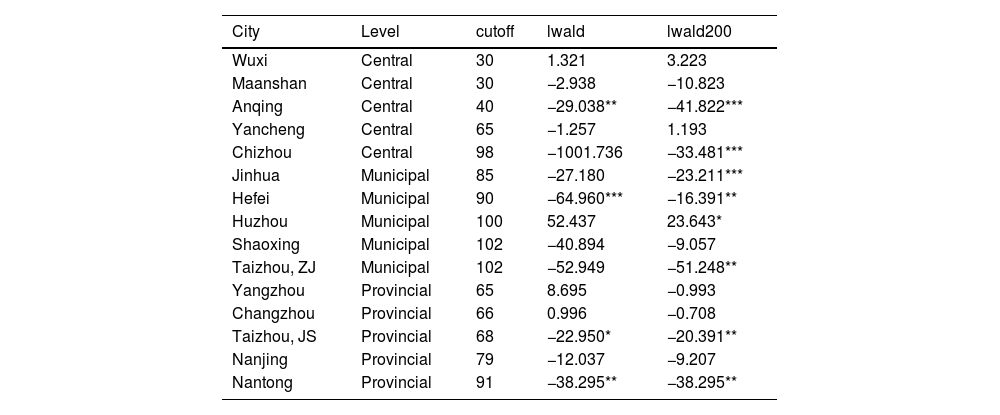
Table 6 summarises the results of multi-hierarchical EPI with multi-cutoff RD design on AQI for the 15 cities. Column 2 shows the treatment effects and Column 3 shows the RD results of the robustness test. As can be seen from Table 6, the RD results for four cities are significant and negative, indicating that EPI in these four cities can significantly improve air quality. According to the improvement effect, these four cities are ranked as Hefei (municipal)>Nantong (provincial)>Anqing (central)>Taizhou (JS) (provincial).
Treatment effects of multi-hierarchical EPI for 15 interviewed cities.
Note. *p < .1, **p < .05 and ***p < .01.
In terms of individual cities, Hefei (municipal) and Nantong (provincial) had better governance results than those interviewed at the central level. Hefei (municipal) and Nantong (provincial) have shifted from a policy of strong restraint to proactive interviews, with outstanding EPI effects. The results validate hypothesis 4 holds true that Hefei and Nantong have transformed the mandatory policies into regulatory initiative policies to realise more sustainable treatment effects and break out the EPI's hierarchical features.
In general, amongst the five cities interviewed by the central government, the treatment effects of four cities are negative, and only Wuxi is slightly greater than 0. amongst the five cities interviewed by the provincial government, the treatment effects of three cities are negative, and the other two cities are slightly greater than 0. Amongst the five cities interviewed by the municipal government, the treatment effects of four cities are negative, but Huzhou has a treatment effect of 52, which is far greater than 0. Although Huzhou is not significant at the cutoff point, this may lead to a poor overall effect at the municipal level, which could be why the municipal EPI effect is lower than provincial and central levels.
Evaluating the improvement effect of a single city reveals that the difference between the cities interviewed by the central government is small and the air quality of most cities exhibits a trend of improvement, leading to the best implementation effect at the central level. When provincial and municipal governments implement EPI, there are always some towns with governance performance that is not up to standard, resulting in poor overall results.
This section selects a single city as a sample with a small sample size, and further selection of too small bandwidth would result in a significant lack of sample size, which in turn would affect the accuracy of the estimation results. Therefore, this section chooses two-fold bandwidth for the robustness test. Cities with significant effects have all passed the robustness test.
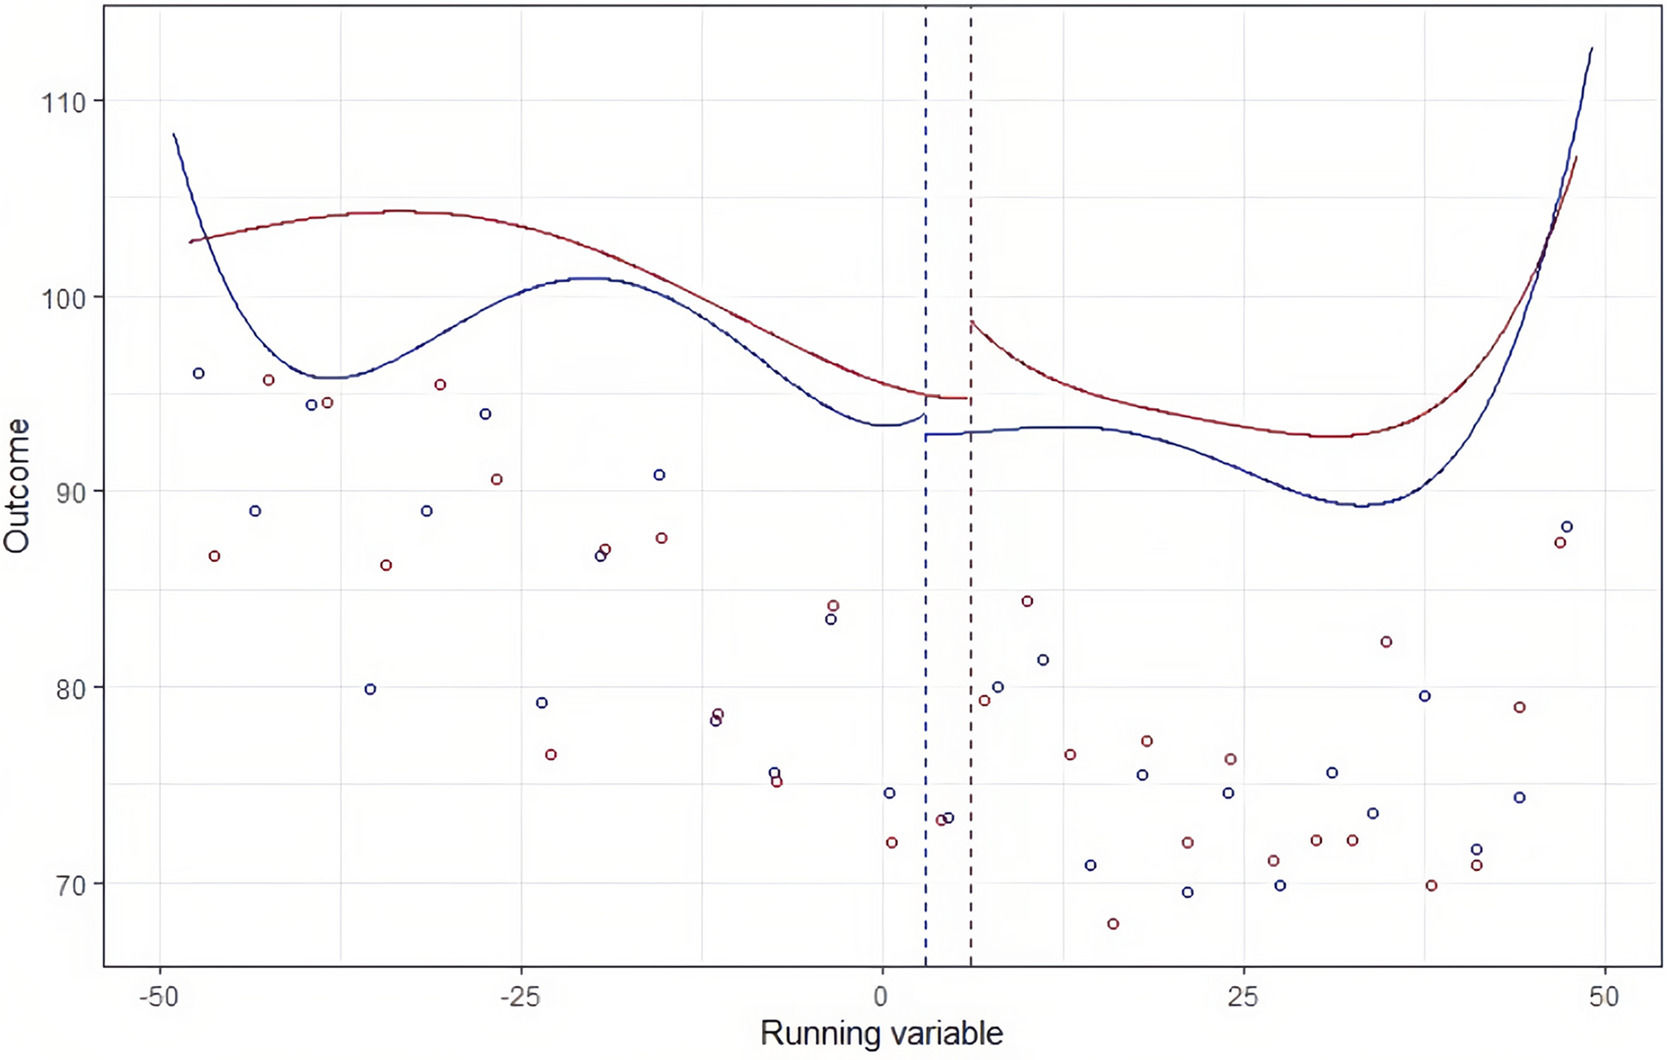
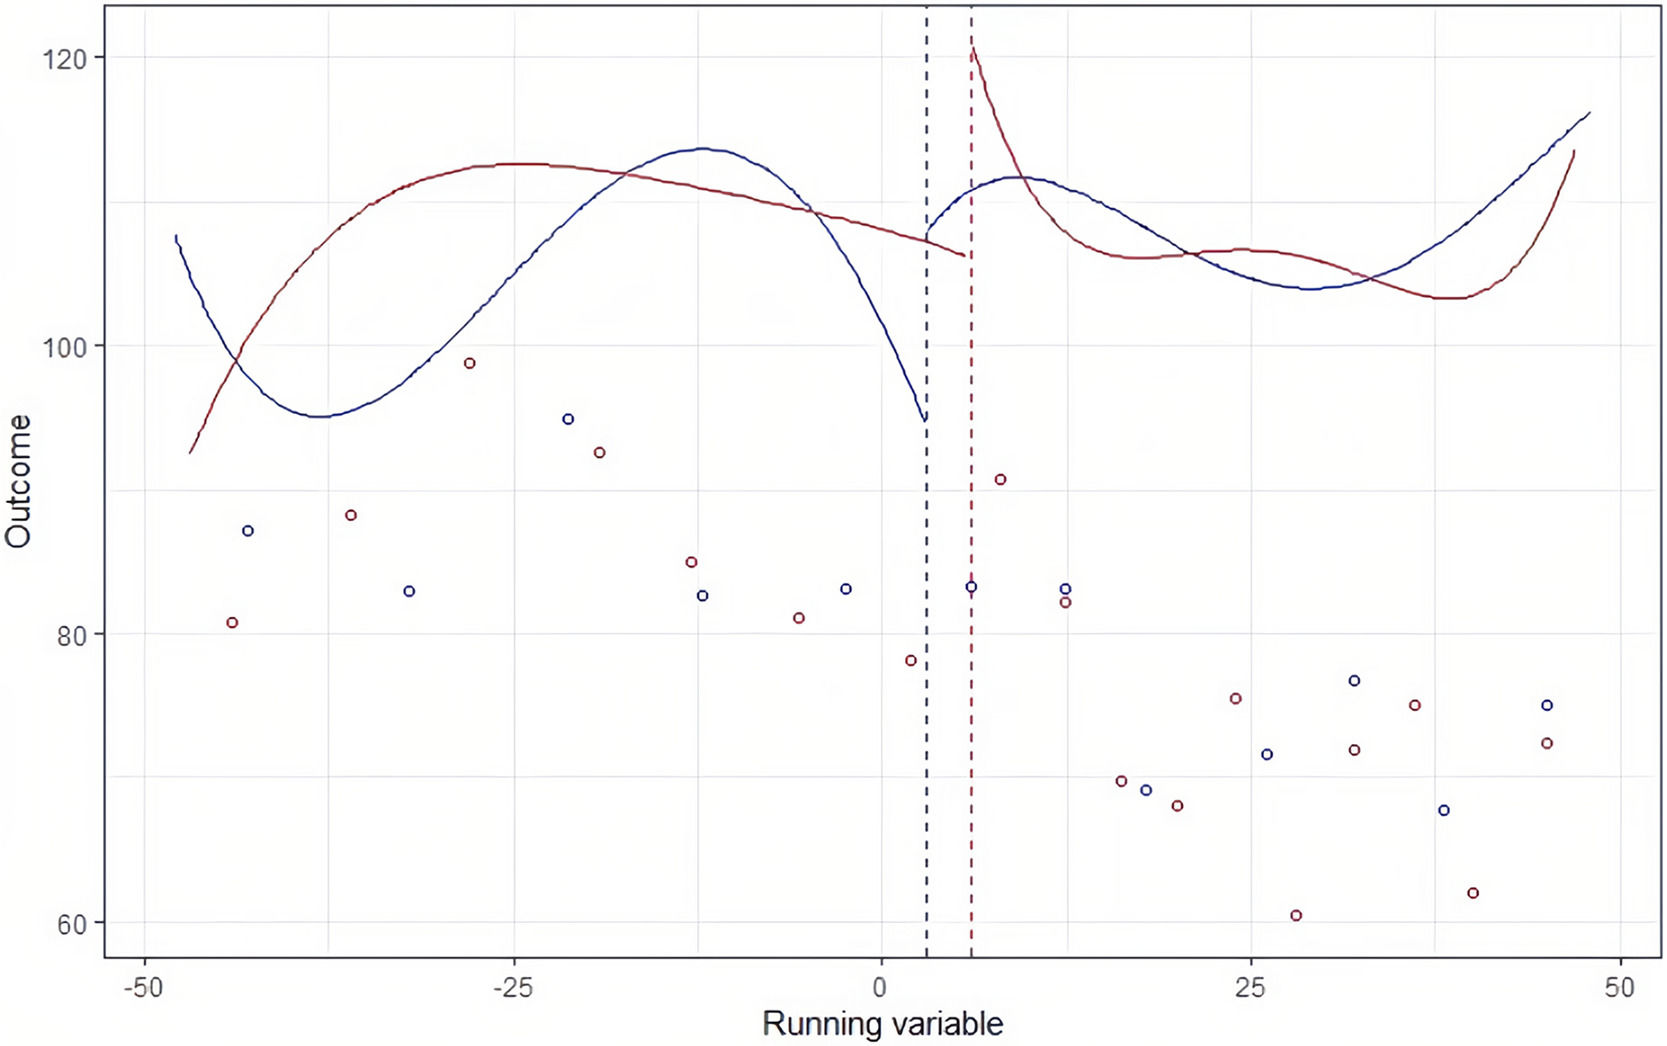
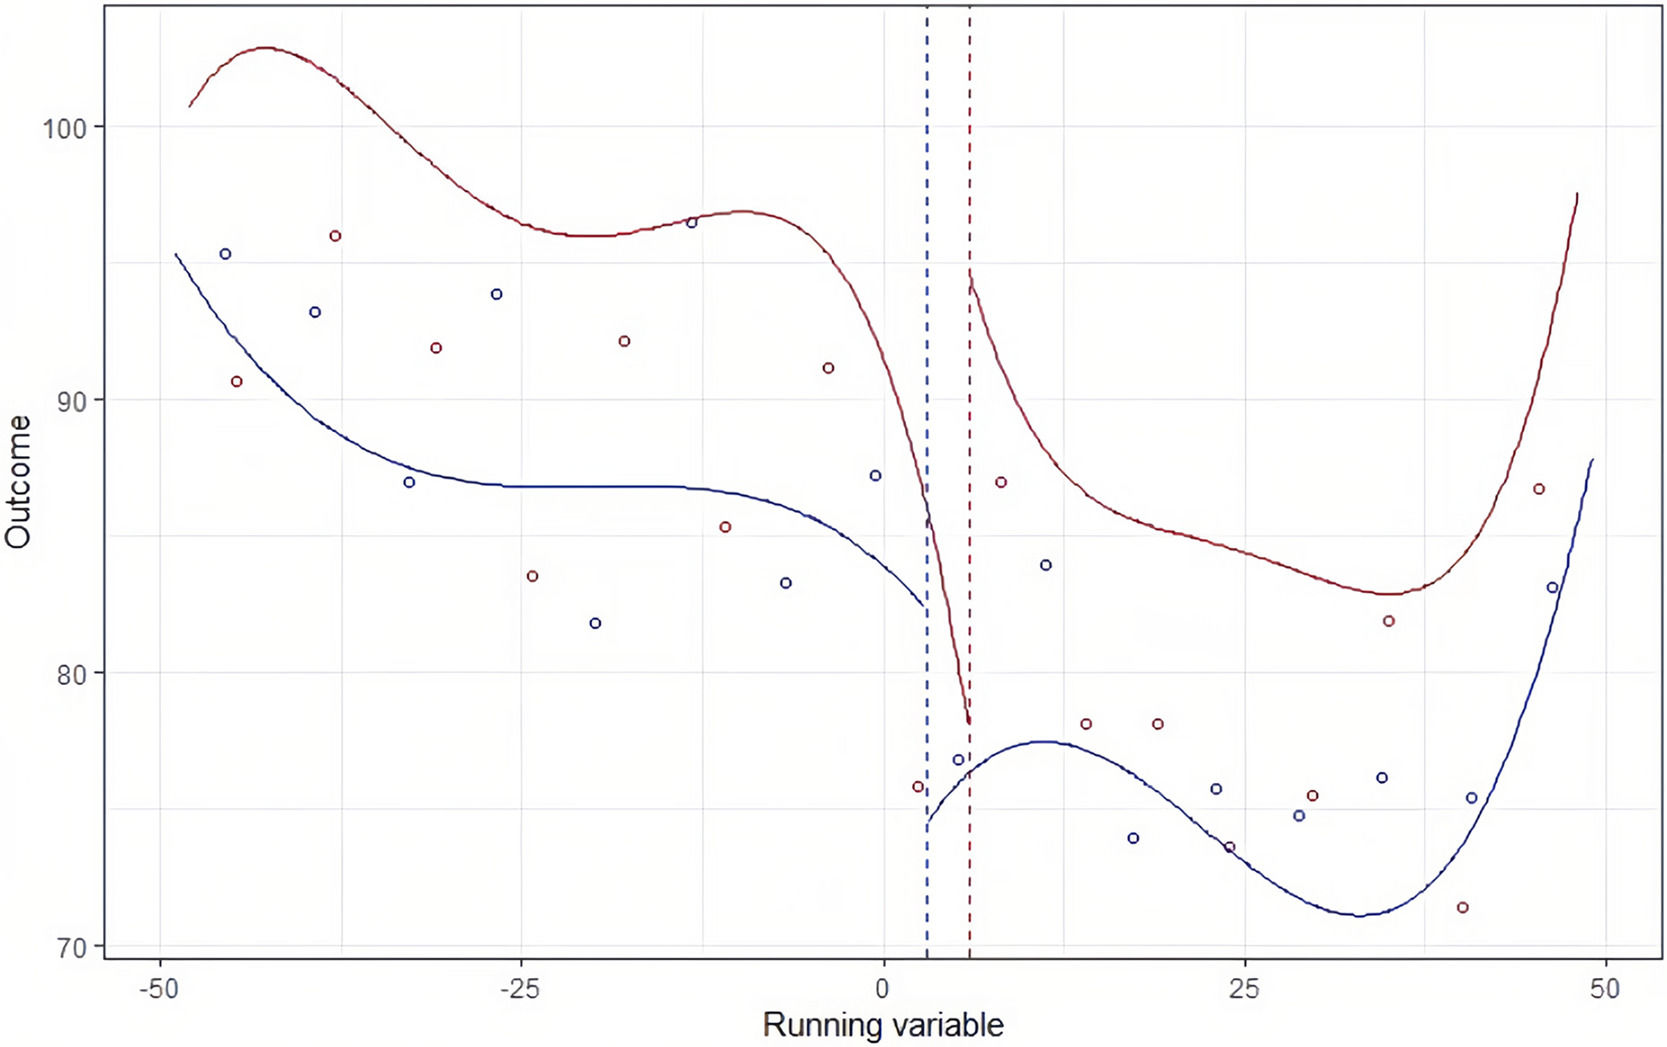
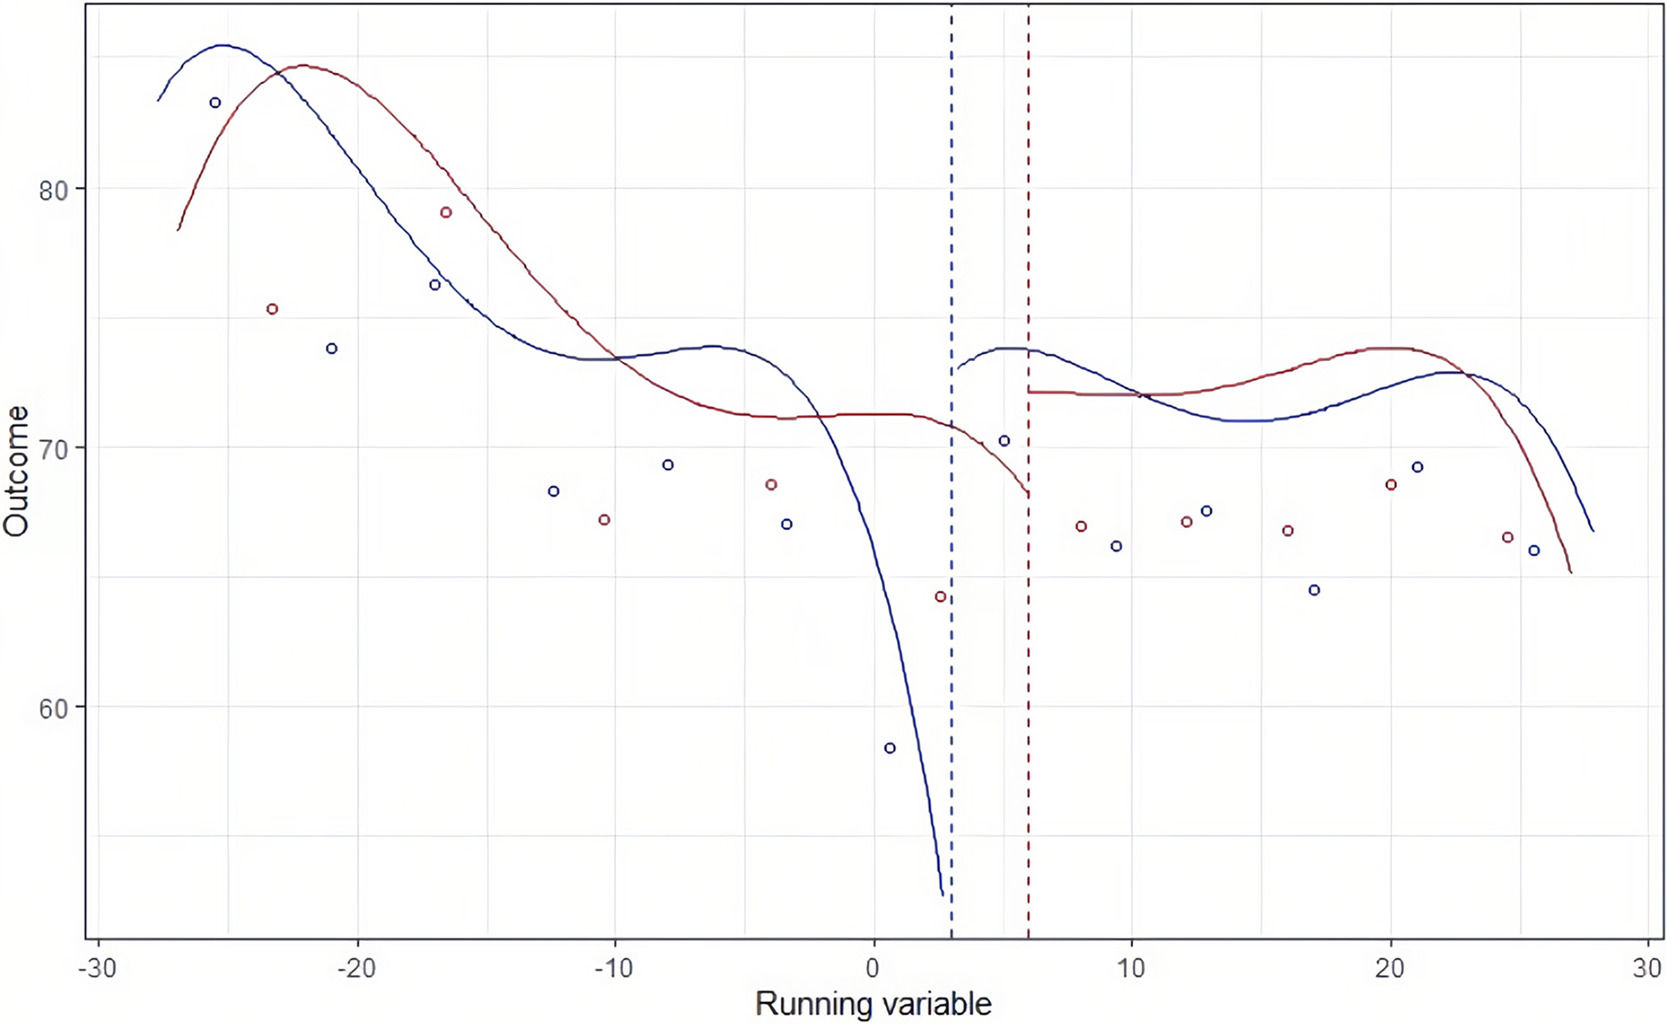
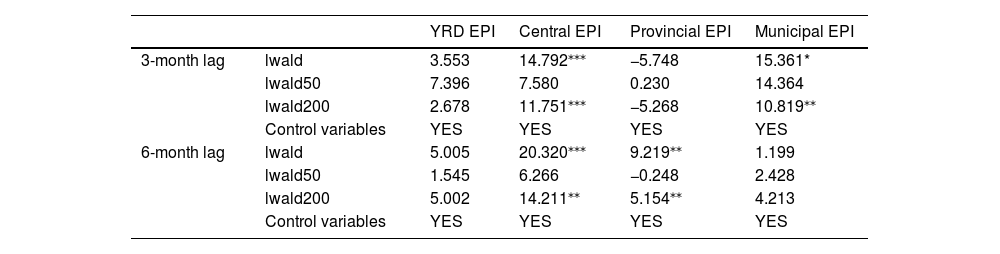
Long-term effect of with cumulative multi-cutoff RD designThe persistence of the policy effects has always been the focus of governments. This section aims to evaluate whether the instant policy effects of multi-hierarchical EPI in YRD last for a long term. Normally, EPI regulation could exert its role with a time lag, this section takes 3-month lag and 6-month lag to the multi-cutoff design to measure the persistence of the policy effects of multi-hierarchical EPI in YRD. Figs. 8-11 show the multi-cutoff effects of multi-hierarchical EPI on AQI with the blue line and the red line indicating the corresponding estimation result on AQI with 3-month lag and 6-month lag. As seen in Figs. 8-11, significant upward cutoffs on AQI are observed at almost all multi-hierarchical EPI with both 3-month lag and 6-month lag, indicating that air quality failed to improve or even deteriorated after EPI was implemented for 3 months to 6 months. The cumulative multi-cutoff RD design is used to assess the persistence of EPI in YRD and at all levels; the results are shown in Table 7.


Cumulative multi-cutoff RD results of multi-hierarchical EPI on AQI.
Note. *p < .1, **p < .05 and ***p < .01.
The values in Table 7 are the treatment effects for the cumulative multi-cutoff RD design. Column 3 shows that none of the treatment effects are significant in YRD, suggesting that EPI has negligible persistent effects on air improvement in YRD.
For the central EPI, the results in Column 4 show that the treatment effects for the best bandwidths for the 3-month lag and 6-month lag estimation are both significantly positive, implying AQI is deteriorating after a few months of the EPI implementation. And the positive effect of the central EPI with 6-month lag is greater than the effect with 3-month lag. The results indicate that the governance effect of central EPI on AQI significantly weakens over time.
For the provincial EPI, the results in Column 5 show that the treatment effects for the best bandwidths for the 3-month lag estimation are negative, while those with a 6-month lag estimation are significantly positive and highly. The results suggest that the provincial EPI also exhibits a tendency for the effect to wane over time, with a significant rebound in the following 6 months.
For the municipal EPI, the results in Column 6 show that the treatment effects for the best bandwidths for the 3-month lag estimation are significantly positive and the treatment effects for the 6-month lag estimation are insignificantly positive. The effect of the municipal EPI policy gradually weakens over time, and after a period of time, the air pollution situation intensifies again.
The above results indicate that the regulatory effects of the governments’ short-term regulatory EPI do not show a long-term feature. The investigation of the 6-month lag estimation of EPI on AQI validates Hypothesis 2 is true. In a sense, EPI has significant effects in improving air quality in the short term, while the effects decline in the long term. For example, governments will issue hard targets, military orders and other mandatory environmental governance measures (Sun et al., 2020) within a few days after the occurrence of EPI, which often lead to production reduction and enterprises’ shutdown (Shen et al., 2017); however, these mandatory environmental governance measures only last for a short time. After the environment reaches the standard, such measures will be abandoned, resulting in a rebound in poorer air quality after improvement.
Discussion and implicationsUsing the sample data for the 15 YRD cities with the impact of central, provincial and municipal EPI in China, this study establishes a multi-cutoff RD design to accurately measure the policy effects of the multi-hierarchical EPI on air quality improvement in YRD. It aims to validate the mechanism innovation in multi-hierarchical environmental regulation towards air quality improvement. The results demonstrate that the overall EPI at all levels improves the air quality for interviewed cities in the short term. The effect of EPI on air quality improvements is primarily reflected in controlling pollutant concentrations of PM2.5, PM10 and NO2. Generally, EPI with higher administrative level significantly exerts policy effects on environmental improvement. Still, some cities under the provincial and municipal EPI could break through the hierarchical constraints and shift to stronger air quality improvement effects.
Theoretical implicationsThis study makes several contributions to the literature on effect evaluation of EPI policy. The study takes the multi-hierarchical EPI as the mechanism innovation for precise environmental regulation, which is also of great significance for future governance in other areas. This investigation provides evidence that the provincial and municipal EPI are likely to involve the initiative regulation and produce greater effects than the central EPI, providing new insights for mechanism innovation of China's precise environmental governance. The results also demonstrate that as the pioneer in environmental regulation, there are very few cities in YRD that could transform mandatory policies into initiative regulation policies to realise more sustainable treatment effects. All these conclusions validate that the multi-hierarchical EPI could present a mechanism innovation of precise environmental regulation (Hypothesis 1).
From an evaluation perspective, previous research has largely used a sharp RD design to estimate the policy effects of EPI. Taking consideration of the fact that the multi-hierarchical EPI for various cities is implemented at different times, this study innovatively constructing a multi-cutoff RD design to measure the detailed policy effects of the multi-hierarchical EPI. The application of multi-cutoff RD design could have crucial theoretical significance. The study presents an extensive application of multi-cutoff RD design in estimating the detailed policy effects for a series of social, economic and environmental policies for multiple objects.
Practical implicationsThis study also has three important practical implications concerning the mechanism innovation of precise regulation for environmental improvement.
First, local governments should refine the rules of EPI at each level and improve the associated detailed measures. More importantly, it is essential to clarify the objectives and responsibilities of central, provincial and municipal levels to avoid overlapping, exaggeration or no practical significance from the policies despite having many details (Zhang, 2022).
Second, local governments should strengthen the local EPI system's information disclosure and could effectively mobilise local residents to understand the regional pollution level, reduce cognitive bias against pollution and maintain reasonable and appropriate sensitivity to pollution (Tian et al., 2022). Micro-enterprises’ information disclosure could exert a supervisory mechanism to motivate the implementation of environment-friendly components in production, emissions and related activities, stimulating enterprises to rectify polluting behaviours and promote innovation. In summary, information disclosure and other multiple measures could facilitate the transition from a mandatory regulation to enterprises’ active involvement in environmental regulation, amplifying regulatory effects and long-term sustainable development.
Finally, both the central and local governments should upgrade EPI to an ‘early-prevention interview’ rather than a ‘post-regulation interview’. The governments should increase oversight, implementing strict controls on waste discharge and the closure of polluting factories. Governments must encourage companies to treat their own waste and bear their social responsibility to sustainable development. In addition, local governments should accelerate the transformation process of sustainable economic structure in the long term rather than implementing mandatory measures to reduce environmental pollution in the short term.
Limitations and directions for future researchThe results of this study provide suggestions for optimising EPI and improving environmental quality. This study uses sample data for YRD from 2013 to 2022 for analysis. However, the outbreak of COVID-19 in 2019 caused governments at all levels to gradually shift focus to pandemic control, revealing enormous fluctuation in the observed sample data. Future research should clarify and refine the sample data for EPI policy to evaluate the policy effects more precisely.
Precise regulation is still at a very initial stage and requires further investigation in multiple aspects. Future research could extend the efforts in extracting the perspective of the specific precise regulation scenario to more general regulations. Future efforts could include the investigation of the social community in actively participating in precise environmental regulation.
This work is supported by the Project of National Social Science Foundation in China (20BTJ029).