


Edited by: Abbas Mardari
Last update: July 2022
More infoThe Porter hypothesis predicts that the win-win goals of environmental improvement and economic performance can be achieved though technological innovation, but it remains to be tested in elaborated ways. Explicitly identifying the role of environmental regulation and finely clarifying the scope of technological innovation have become two important prerequisites for accurately testing the “Porter hypothesis”. Taking China's Low-carbon Pilot Policy as a quasi-natural experiment, this paper constructs a difference-in-difference-in-differences (DDD) strategy to identify the environmental regulation, and selects the low-carbon technological innovation which may be more dependent on Low-carbon Pilot Policy as the explanatory variable, to reexamine the “Porter hypothesis” in China. Based on the data of listed companies in China from 2007 to 2016, this paper conducts substantial empirical studies on effect estimation, robustness test and heterogeneity analysis. The results show that the Low-carbon Pilot Policy significantly promotes the low-carbon technological innovation of enterprises in high-carbon emission industries in pilot cities. The robustness test also verifies the reliability of those results which confirms the validity of “Porter hypothesis”. However, the heterogeneity analysis finds that the testing results of “Porter hypothesis” may vary depending on firms’ characteristics. The Low-carbon Pilot Policy has a positive and significant effect on the enterprises in eastern regions or in the cities with higher R&D investment, it can also promote non-state-owned enterprises’ innovation significantly. This paper may contribute to understand more about “Porter hypothesis” in China and offer strategies for more accurately testing on “Potter hypothesis”.
In response to the ever-deteriorating environmental pollution, governments worldwide tend to adopt various environmental regulations to encourage industrial firms to save energy and reduce emissions. Whether the technological innovation can be stimulated by environmental regulation in firms has always been a concern especially in the ecologic economist community. Before 1990s, the conventional wisdom suggests that tightening environmental regulation will increase enterprises’ costs of decision-making and operating, squeeze out the R&D investment, inhibit the innovation behavior and ultimately reduce the competitiveness (Walter, 1982). While since the 1990s, the conventional view has been challenged by some scholars. Porter and Van Linde (1995) argues that properly designed environmental regulation can improve enterprises’ competitiveness in the market by stimulating enterprises’ technological innovation, which may incompletely or even entirely counteract the costs incurred to comply with the environmental regulation (Porter and Van Linde, 1995). This proposition is well known as the “Porter hypothesis”.
The “Porter's hypothesis” has been vastly tested in literature, but no consistent conclusions have been reached. Many studies support the “Porter hypothesis” (Qiu et al., 2018; Chen et al., 2022), and most of them confirm that environmental policy is an important external driving force for enterprises’ technological innovation (Yu et al., 2022), especially for the properly designed environmental regulations. While some scholars hold the opposite. Zhang (2021) and Zhao et al. (2022) claim that excessive environmental regulations may exert strong pressure to follow the policy but hinder the technological innovation. Some other studies also show that the effect of the environmental regulation on enterprises’ technological innovation is uncertain, which may be due to different time limit (Zhao et al., 2022), geographic locations (Chen et al., 2022), and other external factors.
We believe that two factors must be considered in order to properly test Porter's hypothesis: explicitly identifying the role of environmental regulation and finely clarifying the scope of technological innovation. Some studies select a specific proxy variable to measure the effect of environmental regulations, such as the proportion of industrial emitted water that meets the standards (Yu et al., 2021) and the expenditure on pollution control (Zhou and Qi, 2022); Some other studies regard a certain environmental regulation policy as quasi natural experiment to capture the effect, such as the carbon emission rights trading pilot(Yu, et, al.,2021), the “12th Five-Year Plan” for air pollution control in key areas, and so on. When it comes to the econometric strategy, there are also plenty of methods, such as the panel fixed effects model, instrumental variable, system generalized method of moments, the difference-in-differences (DID) based on the quasi-natural experiments, synthetic control method (Du et al., 2022), et al. Base on those different measurements of environmental regulation effect and methods of econometric strategy, studies testing “Porter hypothesis” within the same time frame and geographic area still have not came to an agreement conclusion, which indicates that the identification strategy of environmental regulation may affect the accuracy of testing results.
Scholars also understand the implication of technological innovation in different ranges. Many studies regarded it as the overall technological innovation which includes all aspects directly related to innovation in a firm and is usually measured by the total R&D investment or the total patents (Gu, 2022). Some researchers pay more attention to technological innovation related to environmental improvements, such as ecological technological innovation or green technological innovation (Shahzad et al., 2022). There are still some other literature that defines technological innovation as highly related to the specific environmental regulation policy (Fang et al., 2022). Yu et al. (2017) uses renewable energy technological innovation to test the renewable energy support policy. Similarly, a different understanding of the connotation of technological innovation will also lead to different testing results of the “Porter hypothesis” even given the same limit of the time frame and geographic area.
To address those issues, this paper aims to re-examine the “Porter hypothesis” in China by more accurately identifying environmental regulations and understanding the connotation of technological innovation. In terms of identifying environmental regulation, we first take the advantage of China's LCPP as a quasi-natural experiment for analysis. In an attempt to achieve the goal for controlling greenhouse gas emissions in 2020, Chinese government has issued the low-carbon pilot cities (LCPC) in 2010, 2012 and 2017 respectively. The policy requires each city to implement a low-carbon economy-oriented developing model. Compared to other environmental regulation policy in China, the LCPP has announced three batches of pilot cities so far, which may provide more sufficient temporal and spatial changes to observe the effects of environmental regulations. Many literature have assessed the effect of China's LCPP using the difference-in-differences (DID) quasi-natural experiment approach and proved the its effectiveness (Zhu & Lee, 2022).
In this paper, the difference-in-difference-in-differences (DDD) approach has been applied to more precisely capture the effects of environmental regulations. In the last few years, the DDD method has been vastly used in economic policy evaluation by some researchers instead of the DID method (B Yu et al., 2022). By conducting a DDD strategy, we can not only measure the differences within time and differences within cities, which exactly the DID method usually does, but also capture the differences within industries. Based on the three differences among time, cities, and industries, we can distinguish the impact of environmental regulations over time and regional changes on different industries and figure out the precise policy effect on firms, which may contribute to a more reliable estimation. In addition, since the LCPC were established in batches, we further constructed a time-varying DDD model to deal with the differences in the policy implementation time in different cities.
In terms of a detailed understanding of the implication of technological innovation, we tend to select the LCTI which is more closely related to the LCPP instead of the general technical innovation. The LCTI mainly refers to the development, diffusion and application of the low-carbon technologies for the purpose of reducing carbon emission. Although the concept is very similar to environment-related technological innovation, the low-carbon technological innovation is a specific category of environmental technological innovation with main goal of reducing carbon emissions while with less efforts to reduce emissions of other environmental pollutants. Since we choose LCPP as the environmental regulation policy in this paper, the LCTI would be more adequate to reflect the causality between environmental regulation and innovation in firms compared to other categories of technological innovations.
The main contribution of this paper may be to reexamine the “Porter hypothesis” in more accurate strategies by identifying the role of environmental regulation and clarifying the scope of technological innovation. First, we use the DDD approach instead of DID method to capture the precise effect of environmental regulation on firms’ innovation based on the LCPP. Compared with the DID method, the DDD strategy can further control the industrial and regional factors varying with time, as well as the industrial factors varying with regions, which can eliminate more non-observable factors and make the estimation results more reliable. Second, the definition of technological innovation is clarified and the link between environmental regulation and technological innovation is discussed from the perspective of LCTI which is more directly related to the LCPP. We estimate the impact of LCPP on the LCTI rather than the effects on the general technology innovation, which means that the effects is more targeted on the policy. Third, although we verify the validity of “Porter hypothesis” in China, we find that “Porter hypothesis” may also vary depending on firms’ characteristics. In particular, “Porter hypothesis” is not aimed at the general technology innovation, but only for some specific innovations. Our work in this paper may contribute to understanding more about the “Porter hypothesis” in China and provide strategies for more accurately testing of the “Potter hypothesis”.
The following is the structure of our study. The second part introduces the background of the LCPP in China; the third part is the appropriate method and puts forward the data; the fourth part gives the results; the fifth part discusses the robustness of results; the last two parts are the heterogeneity and conclusion respectively.
Background of the low-carbon pilot policy in ChinaFor the past decades, global warming has received widespread attention from governments worldwide. In order to halt global warming, many countries have began to concentrate on the measures of effectively reducing CO2 emission. China, the biggest developing economy and one of the biggest producers of carbon dioxide, is crucial to the fight against global warming. In July 2010, the Chinese government officially determined the first batch of LCPC in five provinces and eight prefecture-level cities. However, due to the inefficiency of the provincial pilots, the Chinese government issued the second batch in April 2012, which is dominated by cities and supplemented by provinces, including 1 province and 28 cities. The third batch of low-carbon pilot projects was published in 2017, mainly involving 45 cities. Low-carbon pilot work has been carried out across the country.
China's LCPP promotes the low-carbon development of pilot cities including strengthening strategic planning, improving the implementation system and the supporting policies, advancing the low-carbon industrial evolution, accelerating formulating the greenhouse gas inventories, and advocating the sense of low-carbon living (Zhou and Qi, 2022). The specialized duties of each pilot city include changing the industrial structure, modernizing low-carbon sectors through technical advancement, and fostering the growth of emergent low-carbon industries by creating a number of environmental regulatory systems and incentive programs; building a low-carbon transportation system, establishing an environmentally friendly public transportation network, actively developing new energy transportation such as electric vehicles and hydrogen energy vehicles; promoting the utilization of renewable energy in buildings; popularizing the sense of low-carbon living, guiding residents to change their lifestyles and consumption patterns. In implementing the policy, each pilot city is also required to represent the characteristics of adapting to local conditions. Different from other environmental regulation policies like the carbon emission rights trading system, carbon emission quota policy, and carbon tax policy, the LCPP is a more stringent and full-scale environmental regulation aiming at reducing CO2 emission.
Methods and dataModelWhen evaluating environmental policies using quasi-natural experimental methods, the DID strategy is frequently employed in literature. The policy effects are estimated by measuring the differences within time and within cities, which also excludes invisible factors that do not vary over time. However, the control group and experimental group must have similar characteristics, which is the premise of the application of DID approach, i.e. the parallel trend assumption; otherwise, the analysis results will be biased. In this paper, cities that initiatively apply to become LCPC may tend to adopt more targeted regulatory policies because they will be more concerned about initiatives by local businesses to reduce carbon emissions, which may lead to the failure of the parallel trend assumption.
The bias caused by the failure of the parallel trend assumption above can be mitigated by the DDD approach, which can make the estimation more reliable by introducing a new control group to control the interference of differences in trend on the effect identification. Existing studies based on the DDD method generally use industry characteristics as the third difference to evaluate economic policy (B Yu et al., 2022). Given that the LCPP is directly related to enterprises’ energy consumption and emission, we choose the high/low energy consumption industry divided by the relevant Chinese authority as the third differential structure to construct a DDD model to further eliminate other factors that are invariant over time and unobservable.
In this paper we adopt the time-varying DDD model. The difference between Time-varying DDD and general DDD is that the policy impact of general DDD is at the same point, while the policy shock of time-varying DDD will be at different points.The time frame of the data in this paper is 2007–2016; during this period, the LCPC were established in two batches in 2010 and 2012, which affect the enterprises' LCTI gradually. To address this issue, we build a time-varying DDD model to account for the distinguish among policies in various cities are implemented in different time. Since the policy was implemented at the end of 2010 and 2012, we take 2011 and 2013 as the time points of the policy shocks. The time-varying DDD model is depicted below.:
where i,t,j,r represent the enterprise, the year, the industry, and the city respectively, and εitjr is the error term. LCTIitjr is the explained variable, measured by the LCTI of firms that directly related to the LCPP. The LCC, Post,HCare dummy variables. LCC equals 1 if the city where the enterprise is located in a LCPC; otherwise, equals 0. Post equals 1 if it is after the pilot implementation year; otherwise, equals 0. In detail, for pilot cities that were established at the end of 2010, LCC×Post equals 0 for 2007–2010 and 1 for 2011–2016. For pilot cities that were established at the end of 2012, LCC×Post equals 0 for 2007–2012 and 1 for 2013–2016. While for non-pilot cities, LCC×Post is always equal to 0. HC is 1 if the enterprise belongs to a high-carbon emission industry1; otherwise, it's 0. Xit is a cluster of control variables that related to enterprises’ technological innovation or carbon emission. We also control interaction fixed effects of the city-year (γrt), the industry-year (θjt) and the industry-city (δjr) for those possible time-varying city characteristics, time-varying industry characteristics, and differences for industries in different cities.
We cluster the robust standard errors at the city-industry level. LCCir×Postit×HCij is term of our DDD estimator, and β1 is the interest coefficient in this paper, which indicates the effects of the LCPP on the LCTI of enterprises in high-carbon emission industries in pilot cities.
Variables and dataLow-carbon technological innovations (LCTI)Many literature examines the “Porter hypothesis” focused on the general technological innovation or the total green technological innovation. However, here we choose LCTI for a precise measurement. It is generally believed that the low-carbon technology is an important way for enterprises to achieve energy conservation and emission reduction which includes carbon reduction technology, carbon-free energy technology, and decarbonization technology. The LCPP requests improving the low-carbon technological innovation system, strengthening the development and application of new energy technologies and low-carbon technologies, and encourage enterprises to develop low-carbon technologies and invest in low-carbon projects by improving financial and subsidy policies. It's obvious that the LCTI is more directly related to LCPP.
Although it is believed that the concept of LCTI is very similar to overall environment-related technological innovation, the differences are also obvious. Unlike overall environment-related technological innovation that aimed at achieving harmonious development between man and nature, including solving the shortage of resources, environmental pollution and damage to ecological balance, the LCTI is mainly focused on reducing greenhouse gas emissions by optimizing and improving energy consumption structure and efficiency. To summarize, the LCTI is a concept with a smaller scope and a clearer goal. Therefore, it is more directly related to the LCPP and can reflect the impact of the policy better.
We use the amount of authorized low-carbon patent of listed companies to measure the level of enterprises’ LCTI, denoted by Pat. When investigating the technological innovation that related to the environment, a detailed patent classification system could be more helpful, and the amount of authorized patent is a better reflection of the enterprise's innovation ability. Industrial Design patent refers to new designs that are applied to industrial products on the shape, pattern or color. Generally, there are few low-carbon innovation activities in Industrial Design patents. The CPC-Y02 patent classification system also does not clearly classify low-carbon design patents. So in this paper, we use the amount of authorized low-carbon invention patent (Fam) and the authorized low-carbon utility model patent (Shiy) to investigate the effect of the LCPP on different patent types. The invention patent refers to a new technical solution proposed for a product, a method, or an improvement thereof, and a utility model patent refers to a new technical solution for a product's shape, structure, or combination thereof that is suitable for practical use.
Control variablesWe choose firm-level micro-economic characteristics that affect enterprises’ innovation behavior as control variables. Size, the scale of enterprises’ assets, is determined by the logarithm of the enterprise's total assets. The “Schumpeterian hypothesis” proposed that enterprises with larger scales usually have a stronger incentive for innovation. Lev is an enterprise's debt-to-asset ratio, which is an important indicator of an enterprise's capability of undertaking debt and risk. Roa represents the return on assets of the enterprises, which is equal to net profit after tax divided by total assets. Return on assets is commonly used to measure enterprises’ profitability. Cap is the enterprise's capital intensity. An enterprise with a higher capital intensity usually has a smaller proportion of wage in the total cost then will be more willing to pay high wages to motivate employees (Zhao et al., 2022). Also, the increase in the real wage can improve labor productivity and induce enterprise innovation. lnage is the time period since the enterprise was established. Young companies want to improve the success rate of innovation, so they often choose to invest more in innovation, (Yu et al., 2017). Invest is enterprises’ investment rate. Financial investment can improve an enterprise's capital revenue and capital utilization efficiency and then affect the enterprise's innovation behavior. The sample data is processed as follows: (1) Excluding samples of enterprises in financial, education and comprehensive industries; (2) Excluding samples of enterprises with debt to asset ratio less than 0 or greater than 1; (3) To eliminate the effects of extreme values, the main continuous variables including the number of employees are winsorized at the 1% level; (4) Excluding samples with missing values during 2007 and 2016 to obtain balanced panel data. After screening, 1303 cross-section data and 13,030 sample data were obtained.
DataWe use the sample data from China's listed companies during 2006–2017. The patent data are collected from the database of the National Intellectual Property Administration of the People's Republic of China, and the economic characteristics data are collected from the China Stock Market and Accounting Research database (CSMAR). The division of high-carbon emission industries is refer to the “China Carbon Emissions Trading Report”, and industries that accounted for more than 2% of carbon emissions in 1995 are classified as high-carbon emissions industries.
The CPC-Y02 patent classification system, which is jointly created by the European Patent Office (EPO) and the United States Patent and Trademark Office (USPTO), is the basis for this study's analysis of the number of low-carbon patents. In this system of categorization, the LCTI related to buildings is designated as Y02B, while the LCTI related to greenhouse gas capture, storage, or disposal is designated as Y02C. The LCTI related to energy generation, transmission, and distribution is designated as Y02E, while the LCTI related to transportation is designated as Y02T. Based on the aforementioned criteria, we determine the low-carbon patents held by the enterprise each year, compute their number, and further differentiate between low-carbon invention patents and low-carbon utility model patents. The descriptive statistics of variables are shown in Table 1.
The statistics of variables.
| Variate | Obs | Mean | Std. Dev. | Min | Max |
|---|---|---|---|---|---|
| Pat | 13,030 | 0.378 | 6.209 | 0.000 | 331.000 |
| Fam | 13,030 | 1.026 | 15.563 | 0.000 | 725.000 |
| Shiy | 13,030 | 0.155 | 1.317 | 0.000 | 57.000 |
| Size | 13,030 | 22.111 | 1.381 | 15.376 | 28.509 |
| Lev | 13,030 | 0.502 | 0.196 | 0.000 | 0.996 |
| Roa | 13,030 | 0.033 | 0.071 | −2.746 | 1.992 |
| Cap | 13,030 | 12.621 | 1.185 | 6.078 | 19.639 |
| Lnage | 13,030 | 2.741 | 0.330 | 1.609 | 3.401 |
| Invest | 13,030 | 0.258 | 0.183 | 0.000 | 0.971 |
In this paper, we investigate the impact of the LCPP on enterprises’ LCTI. Table 2 shows the results. In column 1, after controlling all of the two-way fixed effects, the LCPP could promote the number of authorized low-carbon patents of enterprises in high-carbon emission industries in pilot cities by 0.394, and the coefficients are significant. In column 2, we further control the firm fixed effect and year fixed effect and the result is still significant.In columns 3 and 4, we use the use the logarithm form of the number of authorized low-carbon patent per capita and the dummy variable that equals 1 if the enterprise obtained authorized low-carbon patent before as dependent variables for estimating respectively. The results also show that the coefficients is positive at the significant of 5%, which indicates that the LCPP has a positive effect on the LCTI of enterprises in high-carbon emission industries in pilot cities.
Impact of the LCPP on enterprises’ LCTI.
| (1) | (2) | (3) | (4) | |
|---|---|---|---|---|
| LCC×Post×HC | 0.394⁎⁎ | 0.426⁎⁎⁎ | 0.348⁎⁎ | 0.395⁎⁎ |
| (0.153) | (0.087) | (0.159) | (0.172) | |
| Firm control | YES | YES | YES | YES |
| Firm FE | NO | YES | NO | NO |
| Year FE | NO | YES | NO | NO |
| City-year FE | YES | NO | YES | YES |
| Industry-year FE | YES | NO | YES | YES |
| City-industry FE | YES | NO | YES | YES |
| N | 12,250 | 13,030 | 12,250 | 12,250 |
| r2 | 0.294 | 0.536 | 0.291 | 0.286 |
Notes:
(1) *, **, and *** indicate 10%, 5%, and 1%, respectively.
(2) Control variables include size, lev, roa, cap, lnage and invest.
We identify the effects of China's LCPP on enterprises’ LCTI by the Time-varying DDD method and our estimation results confirm the “Porter hypothesis” and are consistent with Shi et al. (2022), Shi and Yu (2020)and Zhao et al. (2022); while other scholars hold the opposite. This may be due to the differences in the identification of the environmental regulation and the understanding of the implication of the technological innovation. Compared to the overall technological innovation and the overall environment-related technological innovation, the LCTI in this paper has a clearer goal with a smaller scope which can be more easily affected by the LCPP.
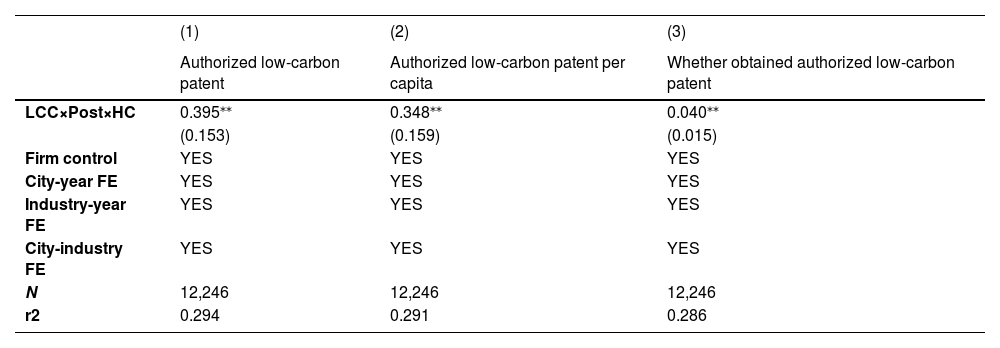
Robust testsPSM-DDD methodEach province or city must first submit an application in order to be considered for the LCPC, which is then chosen by the government after taking into account the local conditions in each area. As a result, the pilot cities are not chosen at random and the initial circumstances for LCPC and non-LCPC areas are not with high similarities which will lead to a biased estimation. In order to overcome the sample selection bias, we introduce the propensity score matching method (PSM). We first conduct some necessary tests on the validity of PSM-DDD method. Since the LCPP is targeted at cities and we set the treatment groups and the control groups based on whether the cities is a low-carbon pilot city or not, we use the variables related to the city characteristics for matching, including GDP, population, ratio of industrial value, and the urbanization rate. Fig. A1 shows that the probability density curves for the tendency score values of the treatment and control groups are closer to one another after matching, indicating the effectiveness of the matching procedure. Fig. A2 shows that after matching, the standard deviation between those covariates is closer to 0 than before matching, and Fig. A3 suggests that the common support assumption holds.


Table A1 shows the PSM-DDD estimation results and we can find that these results are consistent with the baseline regression results, which indicates that the LCPP effectively increase the number of authorized patent of enterprises in high-carbon emission industries in pilot cities, proving the robustness of the conclusion above.
PSM-DDD estimation.
| (1) | (2) | (3) | |
|---|---|---|---|
| Authorized low-carbon patent | Authorized low-carbon patent per capita | Whether obtained authorized low-carbon patent | |
| LCC×Post×HC | 0.395⁎⁎ | 0.348⁎⁎ | 0.040⁎⁎ |
| (0.153) | (0.159) | (0.015) | |
| Firm control | YES | YES | YES |
| City-year FE | YES | YES | YES |
| Industry-year FE | YES | YES | YES |
| City-industry FE | YES | YES | YES |
| N | 12,246 | 12,246 | 12,246 |
| r2 | 0.294 | 0.291 | 0.286 |
Notes:
(1) *, **, and *** indicate 10%, 5%, and 1%, respectively.
(2) Control variables include size, lev, roa, cap, lnage and invest.
The prerequisite for the validity of our estimation results in this paper is to satisfy the common trend assumption between control groups and treatment groups. We apply the event study approach, and the model setting of the common trend for Time-varying DDD is similar to that of standard DDD estimation.
where the preitk is a set of dummy variables, which indicates the k year after the implementation of the policy if k>0, or the k year before the implementation of the policy if k<0. preit0 is the specific time when the policy is imposed in the city where enterprise i located in.
In this paper, we set the range of k as [−4,5] for the pilot cities established in 2010 and [−6,3] for the pilot cities established in 2012. We set the value range of k to [−4,5] and let k that is less than −4 be unified as −4+. The parameter β reflects the impact of k years of implementation of the LCPP on enterprises’ LCTI. Our common trend assumption will hold if coefficients of interactions for k<0 are insignificantly or opposite to the baseline regression coefficients. Table 3 demonstrate that the coefficients of interest are insignificant for k<0 and become significant and positive for k>0, which validates the common trend assumption.
Common Trend Test.
| (1) | |
|---|---|
| LCC×HC×pre−3 | −0.104 |
| (0.140) | |
| LCC×HC×pre−2 | 0.016 |
| (0.105) | |
| LCC×HC×pre−1 | −0.127 |
| (0.126) | |
| LCC×HC×pre0 | 0.229 |
| (0.142) | |
| LCC×HC×pre1 | 0.680⁎⁎ |
| (0.264) | |
| LCC×HC×pre2 | 0.457⁎⁎ |
| (0.224) | |
| LCC×HC×pre3 | 0.654⁎⁎⁎ |
| (0.155) | |
| LCC×HC×pre4 | 0.351⁎⁎ |
| (0.164) | |
| LCC×HC×pre5 | 0.114⁎⁎ |
| (0.055) | |
| Firm control | YES |
| City-year FE | YES |
| Industry-year FE | YES |
| City-industry FE | YES |
| N | 13,030 |
| r2 | 0.194 |
Notes:
(1) *, **, and *** indicate 10%, 5%, and 1%, respectively.
(2) Control variables include size, lev, roa, cap, lnage and invest.
(3) LCC×pre−3+_LCC×pre5, LCC×HC, HC×dummy2007-HC×dummy2016 are all controlled in the model.
(4) The interaction LCC×HC×pre−4 was dropped because of the col-linearity.
Table 4 shows the results of other robustness tests that we further conduct. If there is a correlation between the time trends in the LCPP deficiency and the technological innovation behavior of the firms, our estimation results may be biased. We examine the preexisting trend in column 1 in order to address this concern, and we find that the coefficient of interest is significant, which verifies our baseline estimation. Since the determination of LCPC requires a long period of preparation time, enterprises could have expected the event under study and may take some actions before the policy implemented. To address this, we include interactions that represent the year before the impose of the policy into the baseline regression model, column 2 shows that after controlling the expected effect of the policy, the coefficient of interest is still significant at 5% level.
Other robustness tests.
| (1) | (2) | (3) | (4) | (5) | (6) | (7) | |
|---|---|---|---|---|---|---|---|
| LCC×Post×HC | 0.394⁎⁎ | 0.329⁎⁎ | 0.436* | 0.401⁎⁎ | 0.394⁎⁎ | 0.423⁎⁎⁎ | 0.417⁎⁎⁎ |
| (0.153) | (0.150) | (0.220) | (0.144) | (0.154) | (0.086) | (0.099) | |
| Firm control | YES | YES | YES | YES | YES | YES | YES |
| Industry control | NO | NO | NO | NO | NO | YES | YES |
| City control | NO | NO | NO | NO | NO | NO | YES |
| Firm FE | NO | NO | NO | NO | NO | YES | YES |
| Year FE | NO | NO | NO | NO | NO | YES | YES |
| City-year FE | YES | YES | YES | YES | YES | NO | NO |
| Industry-year FE | YES | YES | YES | YES | YES | NO | NO |
| City-industry FE | YES | YES | YES | YES | YES | NO | NO |
| N | 12,250 | 12,250 | 2790 | 12,110 | 12,250 | 13,030 | 13,030 |
| r2 | 0.294 | 0.294 | 0.277 | 0.249 | 0.294 | 0.536 | 0.536 |
(1) *, **, and *** indicate 10%, 5%, and 1%, respectively.
(2) Control variables include size, lev, roa, cap, lnage and invest.
(3) Column 1 includes the interaction LCC×trend, where trend is a series of time dummies for 2007–2016.
(4) Column 2 includes interactions LCC×d2010×HC, LCC×d2010 and HC×d2010, d2010 is a dummy variable that equals 1 if it is 2010, and 0 otherwise.
In China, governments in cities with different hierarchy usually have different rights, so the impact of the environmental regulation on local enterprises will also be different. Generally, the government in a city with a higher hierarchy usually has greater power, and can obtain more policy support from the higher-level governments. Therefore, in column 3, we drop the sample data with provincial capital cities and vice-provincial cities. Then in column 4, we exclude the sample with the number of authorized patents above 99% quantile, and in column 5, the model is clustered to the province-industry level, the results are still significant.
We include control variables at industry level in column 6. Industry concentration is one of the main factors that affect enterprises’ level of R&D investment (Wang et al., 2022). In this paper, we use the Hirschman-Herfindahl Index (HHI) to measure the level of industry concentration. The HHI index is the sum of the squares of the percentages of the total income or total assets of each enterprise in an industry. The higher the index, the higher the level of industry concentration. After considering the industry-level control variables, the coefficient is 0.423 and still significant at 1% level. In column 7, we further include city-level control variables that will influence enterprises’ technological innovation, including the number of urban environmental protection laws and regulations, total urban population, urban GDP per capita, urban FDI as a percentage of GDP, the number of college students per 10,000 in the city, and urban science and technology expenditure as a percentage of GDP. The coefficient is 0.417 and still significant, which further proves the robustness of our estimation.
The impacts of other policies in the same periodSome other policies during the same period may interfere with the effects of LCPP on the LCTI of firms. We will test the robustness by controlling other relevant government regulations during the same period. In December 2013, Chinese government issued “Notice on Printing the Construction Plan on National Ecological Civilization Demonstration Zone (Trial)”, which aimed at enhance the level of ecological civilization construction by the approach of promoting green, circular, and low-carbon development; in 2011, China began to implement the "Twelfth Five-Year Plan", of which the green development indicator as an indicator of performance evaluation became the top priority of the plan; in September 2013, Chinese government issued “Action Plan of Air Pollution Control”, including ten action requirements; China's “Two Control Zones” policy has proposed a phased goal of improving the acid rain and sulfur dioxide pollution conditions significantly by 2010; finally we include the logarithm of the number of environmental regulations in column 5. The policies above are in parallel with China's LCPP and may have an impact on enterprises’ LCTI. In Table 5, the interactions of policy dummy variable and year dummy variable are included as control variables, the results show that after controlling the impact of other policies in the same period, the LCPP still has a significant impact on the LCTI of enterprises in high-energy-consumption industries in pilot cities, and the coefficients of the interest are similar to the baseline regression, without any significant decrease, proving that the conclusions of this paper are robust.
The effects of other policies in the same period.
| (1) | (2) | (3) | (4) | (5) | |
|---|---|---|---|---|---|
| LCC×Post×HC | 0.398⁎⁎ | 0.391⁎⁎ | 0.380⁎⁎ | 0.385⁎⁎ | 0.394⁎⁎ |
| (0.150) | (0.167) | (0.159) | (0.153) | (0.153) | |
| Firm control | YES | YES | YES | YES | YES |
| City-year FE | YES | YES | YES | YES | YES |
| Industry-year FE | YES | YES | YES | YES | YES |
| City-industry FE | YES | YES | YES | YES | YES |
| N | 12,250 | 12,250 | 12,250 | 12,250 | 12,250 |
| r2 | 0.294 | 0.295 | 0.295 | 0.294 | 0.294 |
Notes:
(1)*, **, and *** indicate 10%, 5%, and 1%, respectively.
(2)Control variables include size, lev, roa, cap, lnage and invest.
(3) In column 1 we include dt2013×NEC, where dt2013 is a dummy variable that equals 1 if it is after 2013 and 0 otherwise, NEC is a dummy variable that equals 1 if the city is a Ecological Civilization Demonstration Zone and 0 otherwise; Column 2 includes dt2011×city fixed effect, dt2011 is a dummy variable that equals 1 if it is after 2011 and 0 otherwise; Column 3 includes dt2013×city fixed effect, dt2013 is a dummy variable that equals 1 if it is after 2011 and 0 otherwise; Column 4 includes time fixed effect×tcz, tcz is a dummy variable that equals 1 if the city is two control zone.
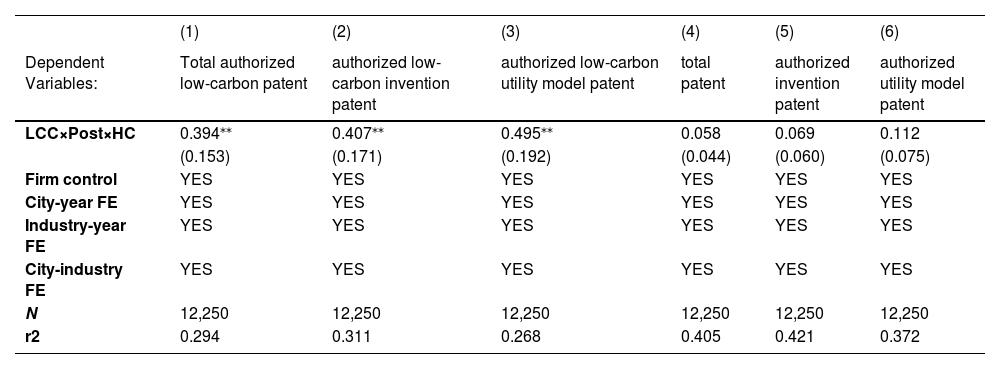
In order to study the heterogeneity of various patent types, we replace the authorized low-carbon patent by the invention patent and utility model patent for estimations. The column 1 to column 3 in Table 6 show the regression results. It implies that China's LCPP can induce an increase in the authorized low-carbon invention patent and authorized low-carbon utility model patent by high-carbon emission enterprises in pilot cities simultaneously.
Effects on various patent types.
| (1) | (2) | (3) | (4) | (5) | (6) | |
|---|---|---|---|---|---|---|
| Dependent Variables: | Total authorized low-carbon patent | authorized low-carbon invention patent | authorized low-carbon utility model patent | total patent | authorized invention patent | authorized utility model patent |
| LCC×Post×HC | 0.394⁎⁎ | 0.407⁎⁎ | 0.495⁎⁎ | 0.058 | 0.069 | 0.112 |
| (0.153) | (0.171) | (0.192) | (0.044) | (0.060) | (0.075) | |
| Firm control | YES | YES | YES | YES | YES | YES |
| City-year FE | YES | YES | YES | YES | YES | YES |
| Industry-year FE | YES | YES | YES | YES | YES | YES |
| City-industry FE | YES | YES | YES | YES | YES | YES |
| N | 12,250 | 12,250 | 12,250 | 12,250 | 12,250 | 12,250 |
| r2 | 0.294 | 0.311 | 0.268 | 0.405 | 0.421 | 0.372 |
Notes:
(1) *, **, and *** indicate 10%, 5%, and 1%, respectively.
(2)Control variables include size, lev, roa, cap, lnage and invest.
Then we focus on the effects of the LCPP on total patent instead of low-carbon patent. The findings in columns 4 to 6 imply that the LCPP can only contribute to the LCTI of high-carbon emission firms, which has a smaller scope and a clearer goal, while it cannot promote enterprises’ overall innovation. Our findings also demonstrate that the LCPP is more effective in promoting enterprises’ technological innovation in reducing greenhouse emissions.
Then we investigate the heterogeneity from the perspective of enterprises’ ownership, local R&D investment and location, the results are reported in Table 7. Column 1 and 2 report the results for SOEs and non-SOEs, and we can see that the LCPP can promote non-SOEs’ LCTI but have no significant effect on SOEs. A possible explanation is that in China, SOEs can get more financial or legal support from the government (Qiu et al., 2018), the preferential treatment received from the government often leads to the inefficiency of SOEs, especially in the lack of innovation. Column 3 and 4 investigate the difference for enterprises in low R&D investment regions and those in high R&D investment regions, it suggests that the LCPP have significant effect on the LCTI of enterprises in high R&D investment regions, but have insignificant effect on those in low R&D investment regions. Finally, we investigate the impact of the LCPP on enterprises in different regions. Column 5 to 7 report the impact on enterprises in the eastern, central and western regions, the results suggest that the LCPP have significant effect on enterprises in eastern region. In China, there exists obvious imbalance in regional development, and our result suggests that relying on its location and resource advantages, the effect of the policy will be significant for enterprises in the eastern region.
Analysis of heterogeneity.
| (1) | (2) | (3) | (4) | (5) | (6) | (7) | |
|---|---|---|---|---|---|---|---|
| SOE | Non-SOE | H_R&D | L_R&D | East | Mid | West | |
| LCC×Post×HC | 0.362 | 0.213⁎⁎ | 0.462⁎⁎⁎ | 0.403 | 0.417⁎⁎ | −0.185 | 0.624 |
| (0.283) | (0.098) | (0.143) | (0.223) | (0.170) | (0.353) | (0.484) | |
| Firm control | YES | YES | YES | YES | YES | YES | YES |
| City-year FE | YES | YES | YES | YES | YES | YES | YES |
| Industry-year FE | YES | YES | YES | YES | YES | YES | YES |
| City-industry FE | YES | YES | YES | YES | YES | YES | YES |
| N | 6680 | 4920 | 7722 | 4505 | 5350 | 2340 | 1720 |
| r2 | 0.365 | 0.233 | 0.283 | 0.366 | 0.271 | 0.365 | 0.385 |
Notes:
(1) *, **, and *** indicate 10%, 5%, and 1%, respectively.
(2) Control variables include size, lev, roa, cap, lnage and invest.
Financing constraint is one of the main factors that restricting enterprises' innovation. Enterprises are more likely to fall into financing dilemmas when conducting R&D activities since it requires a long return period and large sunk cost. It is difficult for them to obtain external loans because of the insufficient value of tangible collateral and information asymmetry. Much literature have confirmed that there is a significant negative correlation between financing constraints and enterprises’ innovation (Zhao et al., 2022).
While the implementation of environmental regulations can help improve the institutional environment, promote the urban financial system as well as the development of financial markets, then release enterprises’ financing constraints. In 2016, the Chinese government proposed to actively explore financing support policies related to low-carbon development at the 2nd China-US Climate Smart/Low Carbon Cities Summit, which may be helpful to reduce enterprises’ external financing costs and ease their financing constraints.
In order to explore the impact mechanism of environmental regulations on enterprise innovation, we first take enterprises’ financing constraints as the dependent variable:

There are several measurement methods for enterprises’ financing constraints, including KZ index, WW index and SA index, among which SA index only using two variables, the size and age of the enterprise, that nearly change over time and are highly exogenous, so that SA index can avoid endogenous interference better. Therefore, the SA index is adapted in this paper. The specific calculation formula is: SA index = −0.737Size+0.043Size2–0.04Age, where Size is logarithm of enterprises’ total assets, and Age is the time period since enterprise established. The larger the absolute value of the SA index, the more severe the financing constraints. The regression results are shown in Table 8. It can be seen from column 1 that the coefficient of the interest is negative and significant at 5% level, indicating that the Low-carbon Pilot Policy can release enterprises’ financing constraints.
Mechanism test.
| (1) | (2) | (3) | |
|---|---|---|---|
| Dependent variables: | SA index | Authorized low-carbon patent | |
| H_SA | L_SA | ||
| LCC×Post×HC | −0.026⁎⁎ | 0.400 | 0.511⁎⁎ |
| (0.013) | (0.339) | (0.250) | |
| Firm Control | YES | YES | YES |
| City-year FE | YES | YES | YES |
| Industry-year FE | YES | YES | YES |
| City-industry FE | YES | YES | YES |
| N | 12,250 | 5726 | 5937 |
| r2 | 0.396 | 0.375 | 0.294 |
Notes:
(1) *, **, and *** indicate 10%, 5%, and 1%, respectively.
(2) Control variables include size, lev, roa, cap, lnage and invest.
Then column 2 in Table 8 shows the effect of the policy for enterprises with low financial constraint and column 3 applies to those with high financial constraint. The results indicate that the Pilot Policy has no significant effect on enterprises with high financing constraints, but can significantly promote the technological innovation of enterprises with low financing constraints. In other words, the Low-carbon Pilot Policy can promote enterprises low-carbon technological innovation by improving the financial market and releasing the financing constraints.
Conclusions and policy implicationsWe take China's LCPP as a quasi-natural experiment to construct a Time-varying DDD to investigate the impact of the LCPP on the LCTI of enterprises in high-carbon emission industries in pilot cities based on the enterprises’ authorized low-carbon patent data and economic characteristics data during 2007–2016. The empirical results show that China's LCPP has effectively promoted the LCTI of enterprises in high-carbon emission industries in the pilot cities, and the policy only plays a role in enterprises’ LCTI while has no significant effects on enterprises’ overall innovations. The LCPP has a positive and significant effect on the enterprises in eastern regions or in the cities with higher R&D investment, as well as the non-state-owned enterprises.
Based on the conclusions above, we can draw some policy implications. First, the validity of the “Porter hypothesis” that focused on the low-carbon technological innovation may be a better guide to China's environmental regulatory design and the choice of regulatory tools. Second, the positive effect of China's LCPP on LCTI provides an empirical support for the approval of the third batch of pilot cities in 2017 as well as the popularization of pilots nationwide in 2020. Finally, when developing specific policy initiatives, more attention should be paid to the heterogeneity of enterprises’ economic characteristics. It is also necessary to consider the differences in enterprises’ ownership and propose targeted initiatives to develop the low-carbon cities.
Due to the lack of data on the classification of firms’ technological innovation, this paper cannot go further on the effects testing for different categories of technological innovations. Future research can examine the validity of the "Porter hypothesis" for more types of technological innovations.
FundingThis paper was financially supported by the National Social Science Foundation of China(Grant No. 20BJL131, No.19ZDA083), National Natural Science Foundation of China(Grant No. 72004170), National Outstanding Youth Science Fund Project of China (Grant No. 71725007), the Fundamental Research Funds for the Central Universities(Grant No. 2020SK040), and the Collaborative Innovation Center for Emissions Trading system Co-constructed by the Province and Ministry(Grant No. 22CICETS-YB013).
XXXX
Hongwei Yu (PhD) is an associate professor at the Institute of Quality Development Strategy in Wuhan University in China. He graduated from Wuhan University in 2013 with a doctoral degree (management science) and visited the Stanford Institute for Economic Policy Research in Stanford University from 2017 to 2018 as a post-doctor. His research interests include low-carbon economics, energy management and environment economics.
Fei Peng is a research fellow at the Energy Development Research Institute of China Southern Power Grid; graduated from Jinan University in 2003 with a bachelor's degree. Research interests: energy economy.
Taiping Yuan is a senior research fellow at the Energy Development Research Institute of China Southern Power Grid; graduated from Guangzhou University in 2006 with a master degree of engineering. His research interests is carbon market.
Dandan Li (PhD) is a associated professor in the School of Low Carbon Economics of Hubei University of Economics and she also severs as a research fellow in the Collaborative Innovation Center for Emissions Trading system Co-constructed by the Province and Ministry. She graduated from Wuhan University in 2015 with a doctor's degree of management and her research interest is low-carbon economics.
The high carbon emission industries are usually high energy industries. In this paper, we use the classification standard of high energy industries to define the high carbon emission industries which mainly include petrochemical industry, chemical products manufacturing industry, non-metallic mineral manufacturing industry, ferrous metal smelting and calendering industry, non-ferrous metal smelting and calendering industry, and power and heat production industry.