


This study focuses on how optimism translates into innovation outcomes. While the link has been established at a microeconomic level, its translation to an aggregate economic effect is still an open question. Empirical analysis draws from a yearly sample of 42 (mainly OECD) countries between 2000 and 2020 to test the effect of economic optimism on R&D measures from both the consumer's and producer's points of view at the aggregate level. Using modern econometric techniques that address potential endogeneity issues, the results suggest that economic optimism supports an increase in innovation activity and economic performance but not an increase in innovation outcomes, such as more patent production. The implication is that an economically optimistic environment is an important contribution to a nation's entrepreneurial ecosystem. This novel insight shows that firms need not specifically recruit optimistic individuals to reap the benefits of the optimism effect. Policies that encourage economic optimism can orchestrate an environment in which the benefits of the optimism effect are realized, independent of the individual personality traits of its citizens.
Productivity, innovation and the entrepreneurial ecosystem are crucial for an economy's long-term growth (Aghion and Howitt, 1992; Solow, 1956; Swan, 1956; Opute et al., 2021). While the managers of economies are always in search of ways to increase their productivity and innovativeness, productivity has become particularly important because of the current trend of low productivity growth in advanced economies (Bergeaud et al., 2016; Bloom et al., 2017; Fernald et al., 2015; Kokkinen et al., 2021). One such driver is optimism, for which the individual's level of optimism has been shown to enable creativity (Hsu et al., 2011; Icekson et al., 2014; Rego et al., 2012; Revilla & Rodríguez-Prado, 2018), productivity (Kluemper et al., 2009; Medlin & Green, 2009; Schulman, 1999), innovativeness (Li & Wu, 2011) and entrepreneurism (Anglin et al., 2018).
However, most studies on optimism approach the subject from a psychological standpoint and thus focus on the recruitment of individuals with more productive traits (Schulman, 1999), lacking further analysis to understand whether this translates into an overall effect on the economy (see, for example, Daugaard et al., 2024; Puri & Robinson, 2007). Furthermore, at the aggregate level, interest has focused mostly on short-term effects in financial markets (e.g., Bonaparte et al., 2022; Byun et al., 2023; Fernandes et al., 2016; Pok et al., 2023) or business cycles (Seppecher & Salle, 2015). Little attention has been given to whether optimism can help a nation's productivity and entrepreneurial ecosystem in the long term (Baldwin et al., 2024). Since an individual's optimism level depends on personality traits (i.e., dispositional optimism), assessing the positive effects of optimism at the aggregate level can help identify new policy avenues for encouraging productivity and R&D through greater economic optimism. While it is interesting to extrapolate from the individual to an aggregate level, in-depth reasoning and theoretical elaboration are needed to be certain that the inferences are valid when scaled.
This study's central question is as follows: does the link between optimism, productivity, and innovation hold in aggregate terms? Can macroeconomic and institutional policies that promote a more optimistic environment drive more productivity and innovative activities in an economy? How does the level of development of the country moderate this effect? To address these questions, an empirical model of economic optimism and innovation outcomes is developed, and the hypotheses are tested using a panel sample of 42 mostly OECD countries from 2000-2020, distinguishing between the effects of producer and consumer optimism.
The results suggest that the link between economic optimism and productivity holds in the aggregate; however, only producer optimism is associated with innovative actions, according to the measures analysed in this paper. Producer optimism (as measured by a business confidence index) is associated with more researchers per capita involved in R&D activities and higher total factor productivity increments (TFP). In contrast, consumer optimism (measured by a consumer confidence index) affects only TFP. Moreover, producer optimism has a 33 % greater effect on a country's aggregate productivity level than does consumer optimism. The implication is that policy interventions aimed at increasing producers’ optimism are likely to have the greatest impact. When the sample is separated by income level, in high-income economies, the results show that greater producer optimism increases productivity and the number of researchers. This suggests diminishing returns to increases in consumer optimism as a country's income increases. Moreover, for middle-income countries, while consumer optimism increases spending on R&D, both optimism measures affect TFP more, although with a greater effect from producers. In summary, the results provide evidence that a higher level of optimism supports more innovative actions and that the channel of optimism and innovative results is through increased TPF, resulting in improved economic performance.
This study contributes to the current literature on the relationship between optimism and innovation/productivity in three ways: (1) It distinguishes between consumer optimism and producer optimism, focusing particularly on OECD countries, which represent close to half of the world's GDP, where the data availability and quality are high. This allows the exploration of a potential causal relationship between optimism and innovation/productivity by using state-of-the-art identification strategies that utilize iterated system GMM to address endogeneity. (2) This study explores the potential impact of innovation from both an input and output perspective by measuring innovation from various aspects such as per capita research personnel, R&D expenditure as a share of GDP, and patents. (3) The findings from TFP further confirm endogenous growth theory (see, e.g., Aghion & Howitt, 2009) and establish a potential link between optimism and productivity growth through the channel of innovation.
Theoretical frameworkOptimism, defined as “the extent to which people hold generalised favourable expectancies for their future” (Carver et al., 2010:879), has been shown to improve work performance, educational attainment, and human health (Carver et al., 2010; Rasmussen et al., 2009; Scheier & Carver, 1993; Solberg Nes et al., 2009). Consequently, optimistic people are also more successful entrepreneurs (Crane & Crane, 2007; Hmieleski & Baron, 2009; Lindblom et al., 2020; Wood et al., 2015). For example, Amore et al. (2022) show how entrepreneurs who scored high in optimism were more likely to be innovative and make organisational changes to their firms during the COVID-19 outbreak. Moreover, optimistic entrepreneurs experienced greater revenue growth during the pandemic.
The following sections present evidence of how an individual's optimism level can increase their productive and innovative capacities. It is then argued that the macroeconomic environment, via its effect on an economy's collective optimism, can influence an economy's productivity and the entrepreneurial ecosystem. Consequently, hypotheses are developed regarding the mechanisms or channels through which optimism can affect innovation at an aggregate level.
Optimism increases individual productive and innovative capacityOptimism can improve productivity and innovation in several ways. First, research suggests that optimists cope with stressful situations more adaptively than pessimists do and are more likely to take direct and timely action to solve their problems (Hanssen et al., 2015). Furthermore, they are more focused on their coping efforts and are more likely to accept the reality of the situations they encounter than pessimists are (Scheier & Carver, 1993). They are more likely to view problems as solvable rather than insurmountable barriers. This perspective can lead to more effective problem-solving and creative thinking, which is essential for being more productive and innovative. Furthermore, optimism has been linked to better physical and mental health. Healthy individuals are more productive, as they have the energy and focus needed to complete tasks efficiently. A longer health span also increases the potential time a person is in the workforce over their lifetime, directly increasing a person's productive capacity. Moreover, there is some evidence of a positive link between individual innovativeness and life satisfaction (Ali, 2019). Another avenue is that optimism fosters positive relationships that contribute to productivity and innovation, as optimistic people tend to have better interpersonal skills and develop positive relationships with colleagues (Carver et al., 2010). This can lead to better collaboration and a more supportive work environment, which leads to productivity and innovative activities (Tjosvold & Tsao, 1989).
Another potential channel for which optimism can impact innovation is through risk preference. The economic psychology literature documents that economic optimism can drive risk-taking behaviours. For example, optimists can engage in more risk-taking activities because they can create clearer mental pictures of positive occurrences (Carver & Scheier, 2014), and these imaginative positive occurrences drive their decision to adopt more risk-taking behaviours. (Dohmen et al., 2023). On the other hand, it is also widely understood in the innovation and economics literature that risk-taking behaviours drive at least higher innovation activities, if not higher innovation outcomes. For example, Bénabou et al. (2015), using five waves of world value survey data, show that certain religions drive risk aversion behaviours, which in turn are associated with more negative perspectives on innovation and, subsequently, less willingness to innovate. Other studies on the relationship between risk preference and innovation address this question from more specific settings, such as in the context of family firms (see, e.g., Meroño-Cerdán et al., 2018) or from a particular industry (e.g., Arundel, 2017; Knight et al., 2003). These studies generally agree that there is likely a causal relationship between risk preference and innovation and that the magnitude of the effect of risk on innovation may differ across different industries or types of firms. Therefore, it is also interesting to determine whether optimism may impact R&D via the risk preference channel.
The macroeconomic environment influences productivity and the entrepreneurial ecosystemAn entrepreneurial ecosystem refers to the interconnected network of individuals, organizations and institutions that collectively create a supportive environment conducive to entrepreneurial activities and innovation (see, for example, Primario et al., 2024). The macroeconomic environment influences a nation's entrepreneurial ecosystem and productivity via economic stability, regulation, access to finance, sociocultural attitudes and market dynamics (Khan et al., 2023; Khatami et al., 2021).
Cultural attitudes towards risk-taking, innovation, knowledge-sharing and collaboration play a vital role in shaping the entrepreneurial landscape and innovative ecosystem. Collective optimism, defined as a society's aggregated net positive expectations, may therefore influence the innovative ecosystem through its contribution to the sociocultural environment in the macroeconomy. Supportive social norms and networks can enhance collaboration and lead to greater productivity and innovation. Collective optimism can support greater availability of venture capital and loans for startups and small enterprises (Guerrero et al., 2021).
Collective optimism has been previously documented at the team, organisational, community, and national levels (Bennett, 2011; Oettingen & Seligman, 1990). One of the few studies to look at optimism and innovation at the national level is by Oettingen & Seligman (1990), who, by observing workmen in East and West Berlin bars in 1985, reported that behaviour was more consistent with depression in East Berliners than in West Berliners. Further observation allowed them to measure pessimism in both cultures by assessing the explanatory style in newspaper reports of the 1984 Winter Olympic Games. Despite having more Olympic victories to report, East Berlin newspaper accounts were more pessimistic than West Berlin reports were. This serves as evidence of the connection between aggregate optimism and sociocultural influences in the macro environment.
Another study that treats optimism at an aggregate level comes from Anglin et al. (2018), who examine how fluctuations in collective entrepreneurial optimism, collected from small businesses in the U.S., can influence venture creation and regional economic growth. Their results suggest that optimism exhibits a curvilinear relationship with venture creation and growth, moderated by regional environmental dynamism. However, their analysis focused only on the number of new ventures and the growth of such firms, whereas their innovative capabilities as outputs were not measured. As new firms are one of the main sources of innovative outcomes (Acs & Audretsch, 1990), it can be expected that a percentage of those new firms should be innovative, but the proportion is unknown.
In sum, the literature shows a positive relationship between optimism, productivity, and innovation at the individual level and a relationship between optimism and more entrepreneurial activity at the aggregate level. Exploring the mechanism by which this translates to greater productivity and innovative outcomes at an aggregated level will be the objective of the next section.
Producer optimism leads to increased investmentIt is postulated that producer optimism, or more precisely, business confidence, leads to greater productivity and innovative activities via increased investment in capital. Producers invest more when they are confident about future returns on investment (Gennaioli et al., 2016). Business confidence has been demonstrated to have superior forecasting power relative to conventional predictors for investment (Khan & Upadhayaya, 2020). Greater investment leads to more productive capital (from better machines and technology) and more innovative activity through investment in R&D (Kancs & Siliverstovs, 2016). Evidence shows that R&D spending generally enhances firm performance during optimistic periods (Xiang, 2022). Moreover, more optimistic or pessimistic potential output forecasts can trigger short-term fluctuations in private consumption and investment, and private economic agents can learn from different sources of information about future potential output growth and adjust their current demand accordingly following the shock in expectations (Bella et al., 2018).
Furthermore, managerial optimism predicts investment growth (Khan & Upadhayaya, 2020). Optimistic individuals tend to make riskier decisions (Dohmen et al., 2018, 2023; Felton et al., 2003; Ho & Wyer, 2023; Weinstock & Sonsino, 2014). Focusing on firms in particular, managerial optimism increases the chance of firm managers starting new risky projects, such as innovations (Elgebeily et al., 2021) or novel technologies (Kriechbaum et al., 2021), while also increasing growth in riskier environments (Amore et al., 2022). Moreover, CEOs and managers play a positive role in promoting innovation in their firms (Grimpe et al., 2019; Prokop & Hajek, 2023; Xia et al., 2023; Zhang et al., 2022) and organisations, with structures that enhance or do not constrain innovation development (Heinze et al., 2009; Hirst et al., 2011; Revilla & Rodríguez-Prado, 2018; Scott & Bruce, 1994).
As greater innovation investment per unit (innovation input) leads to a greater probability of producing at least one successful product, process and/or organisational or marketing innovation (i.e., innovation output) (Sauer & Vrolijk, 2019), the first hypothesis is proposed for testing.
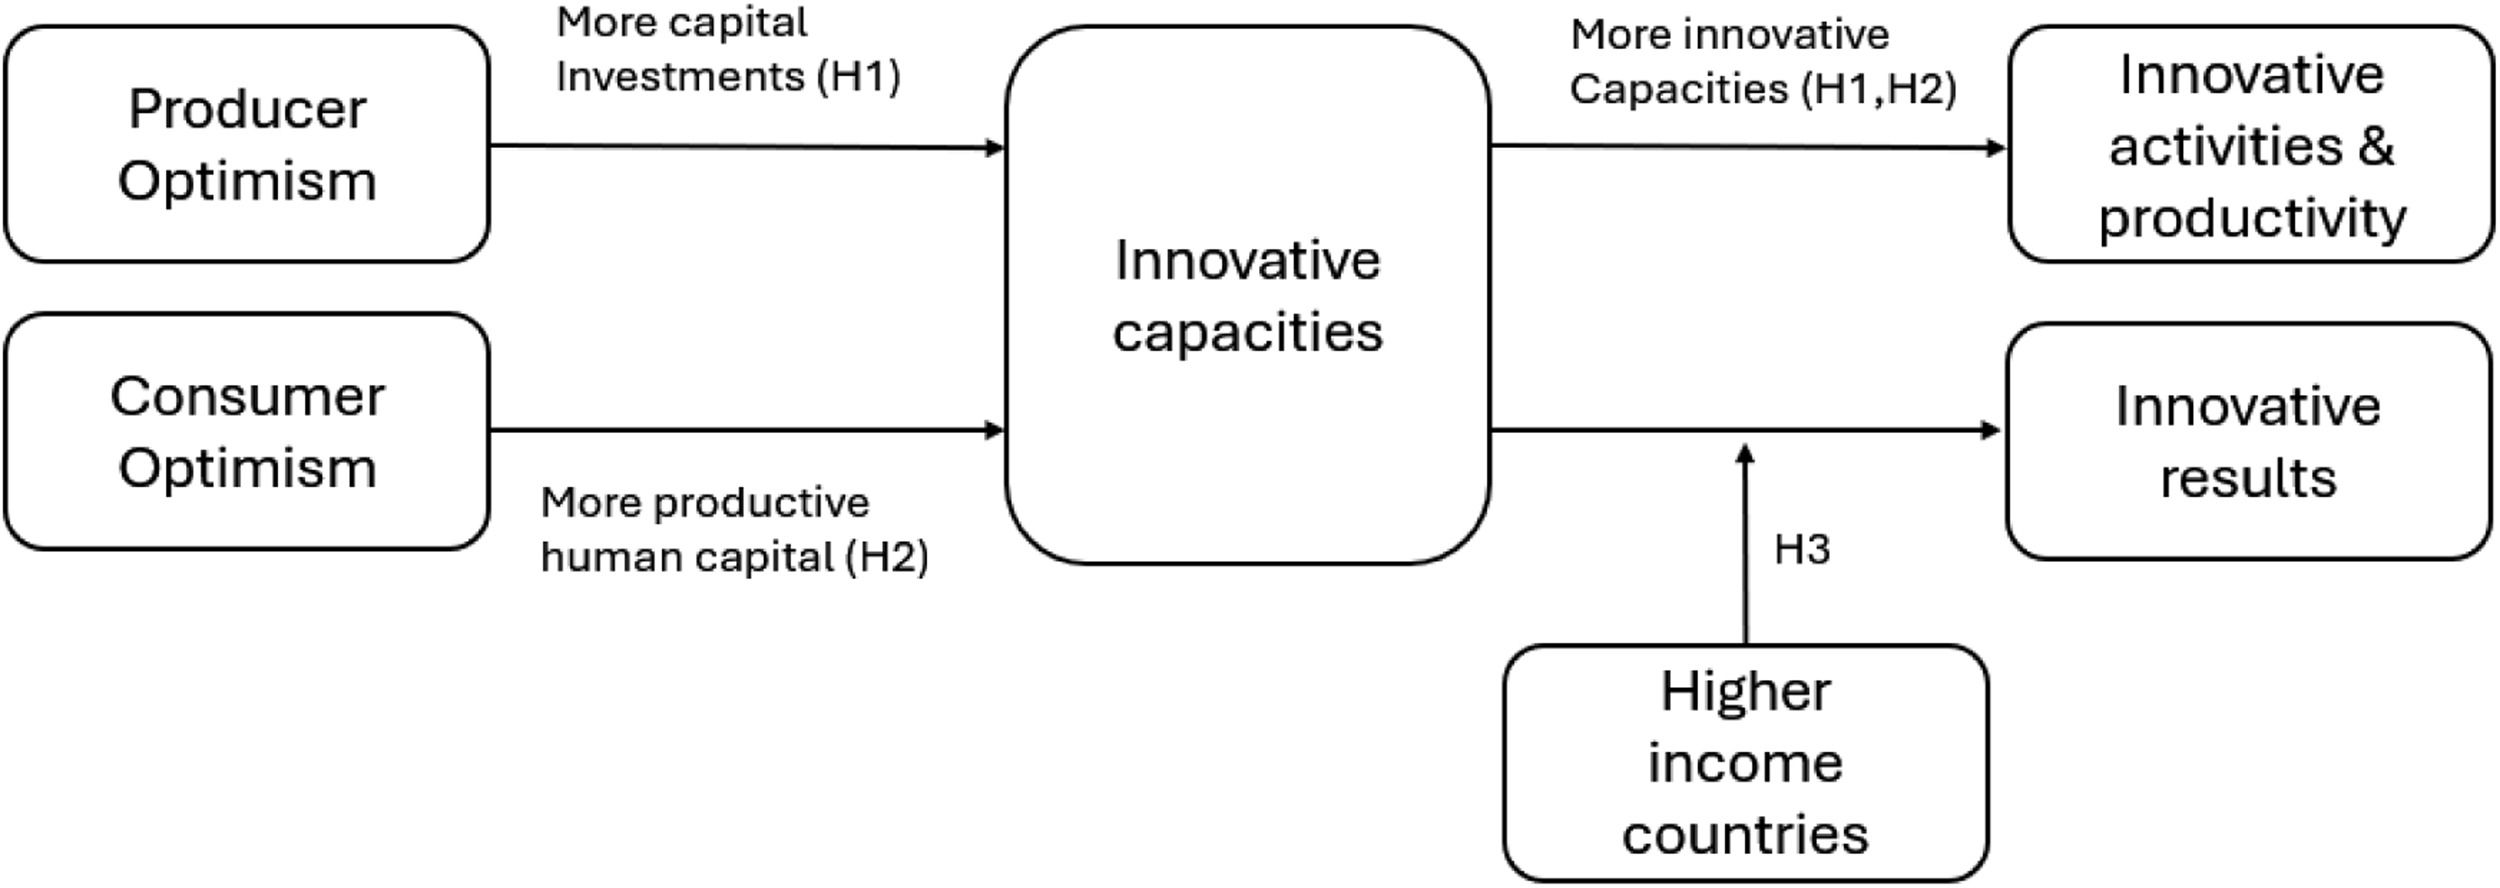
Hypothesis 1 Producer optimism leads to greater innovative activities from greater capital investment in innovative capacities.
Most consumers rely on their human capital for their earnings. When consumers are optimistic, their individual optimism leads to more innovative and adaptive behaviours via its influence on enhancing producers' and consumers' human capital (Labour) (Kluemper et al., 2009). There is a direct link between individuals’ level of optimism and their level of performance (Kluemper et al., 2009; Lester et al., 2022). They build upon the “explanatory style” theory (Carver & Scheier, 1981; Gillham et al., 2001), in which individuals can become aware of discrepancies between a goal and its present situation, leading to an assessment process. Under this logic, optimists are expected to continue to strive, work hard, and cope with any problems they encounter, whereas pessimists give up (Lee et al., 1993; Scheier & Carver, 1987; Scheier et al., 1989), which could explain why scientists are more optimistic than people in other occupational careers (Lounsbury et al., 2012). This finding complements the evidence on the effect of optimism on creativity, as it can enable creative individuals to exhibit greater innovative behaviour (Hsu et al., 2011; Li & Wu, 2011; Sarooghi et al., 2015). The evidence suggests different channels for this mechanism. On the one hand, it may reduce the negative effects of avoidance motivation, as it eases threat appraisals, anxiety, and disengagement—barriers playing a key role in undermining creativity (Icekson et al., 2014). If individuals have a high level of creative self-efficacy, optimism plays a moderating role in allowing greater innovative behaviour at work (Hsu et al., 2011).
The above research has provided great insights into both the theoretical argument and empirical evidence on the relationship between consumer optimism and innovation. Endogenous growth theory, on the other hand, suggests that innovation is the core driver of productivity growth (see, e.g., Aghion & Howitt, 1992, 2006, 2009). Therefore, consumer optimism may also drive productivity growth through its direct impact on innovation. It should be pointed out, though, that this theoretical argument also applies to the relationship between producer optimism and productivity growth. In this paper, the core focus is on the direct impact of optimism (whether it is derived from consumer or producer confidence) on innovation. And the subsequent impact on productivity growth is deduced from the endogenous growth theory.
If improvements in an individual's productivity can be expected, this should, in aggregate terms, translate into an increase in overall human capital inputs to production.
Hypothesis 2 Consumer optimism leads to greater productivity and innovative activities through more productive human capital.
In sum, it is expected that producer optimism will have a greater impact on productivity and innovation than consumer optimism. This is because while producer optimism enhances both capital and labour output, consumer optimism primarily influences labour output, as a larger proportion of consumers are workers rather than producers.
Optimism and country development level.Optimism may have a more pronounced effect on innovation and productivity in high-income countries because they have more resources to allocate towards innovations. Therefore, higher-income countries have more capacity to capitalize on any improvements because they have greater access to financial markets and capital, a more educated and skilled workforce, advanced infrastructure and a more developed and supportive institutional and policy environment (see, e.g., Lim & Morris, 2023). The opposite may also be true. Greater optimism may have less effect on higher-income countries because the gains from optimism may diminish with income. In this case, any marginal productivity gains from greater optimism may be small for high-income countries because they are already highly productive, having already addressed their greatest inefficiencies through investment and education. This is especially relevant for the economic convergence theory (e.g., Borsi & Metiu, 2015).
Hypothesis 3 Consumer and producer optimism have a greater effect on innovative results in high-income countries.
Fig. 1 shows the mechanism by which optimism affects innovation and productivity and presents the hypotheses.
Materials and methodsData
To test the hypotheses, a data panel was constructed that includes 42 countries for the years 2000–2020. This dataset comprises all 38 current OECD members, along with additional countries such as BRICS members (Brazil, China, Russia, and South Africa). Despite some countries being recent OECD members, data were available throughout the entire timeframe.
While a majority of the organization member are high income, the dataset also includes some developing countries. The OECD also consists of a diverse group of countries in terms of geography, variations in political systems, culture and development levels (see, e.g., Carroll & Kellow, 2012). Altogether, the group represents nearly half of the world's GDP, covering countries in the Americas, Asia, Europe, and the Middle East; therefore, the results from this study may be generalizable in the global context. Finally, data availability and quality from the OECD are other reasons for focusing on this group of countries, as it offers the most comprehensive coverage of countries with the highest data quality available.
The empirical analysis partially includes the COVID-19 pandemic years, a time characterized by higher levels of uncertainty and unique market conditions (Bellavitis et al., 2021). During these years, extensive government efforts were made to spur innovation, such as accelerating the development, production, and administration of COVID-19 vaccines (D'Souza et al., 2024). These interventions contradict the setting of low consumer and business confidence during those years and the general challenges faced by firms in innovating in that period (Bergami et al., 2022; Puliga & Ponta, 2022). However, the main reason for not including more recent years is a natural limitation due to data availability.
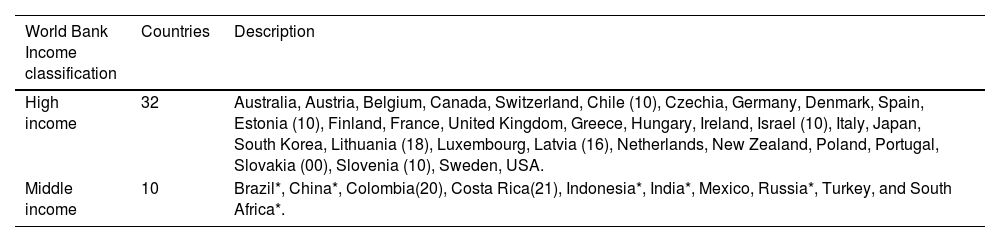
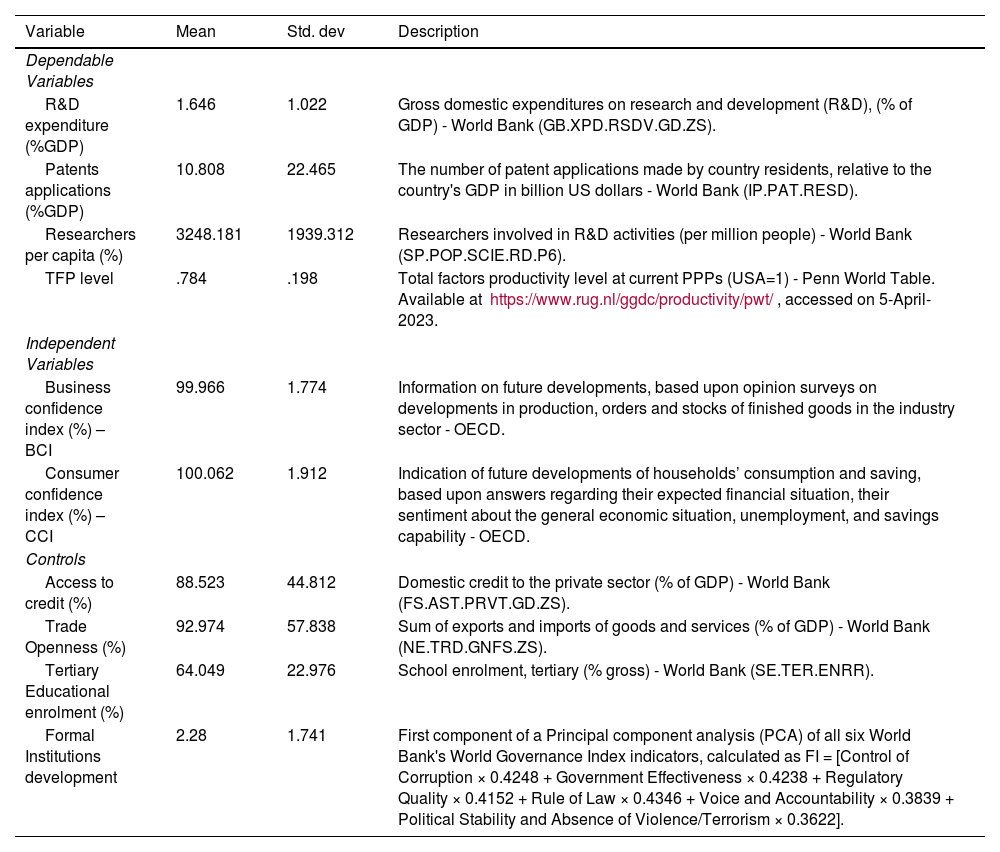
Table 1 lists the countries included in the sample, categorized by income level. Table 2 summarizes the statistics and definitions of the variables used in the analysis.
Country sample.
Details of the sampled countries, separated by the World Bank's income classification. The parenthesis indicates the year of recent admissions since 2000. Asterisks indicate non-OECD membership during any of the sampled years.
Variable and data sources summary.
World Bank data were obtained via the Azevedo's (2011) Stata module. World Bank identification codes are included in parentheses.
Four different variables are used to measure country-level innovation and productivity outcomes. Two of these capture innovative activities: R&D intensity, which reflects the resources invested in research and development (measuring capital), and the number of researchers, representing human capital. The other two variables—patent counts and total factor productivity (TFP)—measure the actual results of innovation activities. The use of multiple measures helps avoid conflating the quantity and quality of innovations, which can significantly impact the effectiveness of industrial policies (Wei et al., 2023).
First, the country's research and development expenditure as a percentage of GDP, known as R&D intensity, is used. This measure is extensively utilized in the literature to assess innovation and productivity (Audretsch & Link, 2018a, b; Bednar et al., 2019; Boles & Link, 2017; Link, 2020; Link & Ruhm, 2009; Link & Scott, 2009, 2010; Protogerou et al., 2017). It has also served as a guideline in public policy; for instance, during the 2000s, this indicator significantly influenced European research and innovation policy, with a 3 % target set by the European Commission (2002).
Second, the number of researchers per million people in the workforce is used. Researchers are professionals who conduct research and improve or develop concepts, theories, models, techniques, instrumentation, and software for operational methods. R&D covers basic research, applied research, and experimental development (UNESCO Institute for Statistics, 2022). Although a larger research budget is likely to lead to the hiring of more researchers, the difference between these proxies can reflect country-specific characteristics, such as variations in scientists’ wages or more cost-intensive R&D activities. Additionally, the literature highlights the critical role that research motivations play at different stages of the innovation value chain (Meng et al., 2024).
Third, the number of worldwide resident patent applications as a proportion of GDP is used. Patent applications are filed through the Patent Cooperation Treaty procedure or with a national patent office to secure exclusive rights for an invention—a product or process that introduces a new method or offers a novel technical solution to a problem (World Intellectual Property Organization, 2023). However, there are issues associated with using patent counts to measure innovation (Roper & Hewitt-Dundas, 2015). For example, Peeters & Van Pottelsberghe de la Potterie (2007) argue that researchers should be aware that patent-related indicators of innovation may reflect specific types of firms and sectors and particular innovation strategies. Additionally, Penin (2005) suggest that patents may contribute primarily to innovation by facilitating knowledge coordination between firms rather than through direct technological effects. Despite not all innovations being patented (Svensson, 2020) and the data being highly skewed toward productive countries (Gambardella et al., 2008), this measure has still been used in recent studies (Audretsch et al., 2023; Mahn & Poblete, 2023).
Finally, innovation is measured through productivity growth via data from the Penn World Tables (Feenstra et al., 2015), specifically total factor productivity (TFP) at constant national prices adjusted for purchasing power parity. TFP is defined as the portion of economic output that is not explained by the quantity of inputs used in production, and its level reflects how efficiently and intensely inputs are utilized (Comin, 2010). As such, it is used as a measure to investigate technological, institutional and productivity changes and their long-term effects on the economy (Kohli, 2015). When a nation improves its TFP, it produces a higher output with unchanged resources, consequently driving economic growth (Habib et al., 2019). These measures of innovation are widely used in the current literature (see, e.g., Ang & Madsen, 2013; Naveed & Wang, 2023; Wang, 2013; Jimin Wang & Wang, 2021).
One shortcoming of this measure is that TFP captures an economy's productivity increases not only from R&D activities but also from activities that do not require direct R&D effort. Some examples of this can be the acquisition of new technology; the purchase of advanced machinery, computer hardware and software; the acquisition of patents and licences; training related to the introduction of new products or processes; market research and feasibility studies; and other procedures such as design and production engineering (Lopez-Rodriguez & Martinez-Lopez, 2017). These activities, defined as performance enhancers, fall beyond the pure definition of innovation, but they could also be motivated by high levels of optimism. Furthermore, while there is some evidence on the link between optimism and TFP (Beaudry et al., 2011), understanding its different sources is still an open question.
Explanatory variablesThere are several alternatives from the literature to measure optimism from consumers and producers. For example, the Life Orientation Test-Revised questionnaire (e.g., Hmieleski & Baron, 2009) directly asks entrepreneurs (i.e., new firms) to rate their expectations for success compared with other entrepreneurs (e.g., Cooper et al., 1988), and in the U.S., the NFIB Small Business Optimism Index is commonly used (Anglin et al., 2018; Chow & Dunkelberg, 2011; Levanon, 2011). At an aggregate level, previous studies have worked with consumer confidence indexes developed for individual countries1. In contrast, this study employs a multicounty approach to account for intrinsic differences between countries. To achieve this, it draws from the OECD's Consumer (CCI) and Business (BCI) confidence indexes (OECD, 2022a, b). Although the name of the measure is “confidence”, a different construct that is usually confused with optimism (Parker, 2018, p.125), both the CCI and BCI measure future expectations rather than an assessment of current abilities, which is the usual term for optimism in the literature. Therefore, both indexes are in line with this study's constructs and have also been used previously in the literature to measure the optimism of consumers and firms (e.g., de Mendonça and Almeida, 2019; Juhro and Iyke, 2020; Khan and Upadhayaya, 2020; Zorio-Grima and Merello, 2020).
The CCI indicates future household consumption and savings on the basis of answers regarding their expected financial situation, their sentiment about the general economic situation, unemployment, and their savings capability. An indicator above 100 signals a boost in consumers' confidence in the future economic situation. In a lower number, they are less prone to save and more inclined to spend money on major purchases in the next 12 months. To measure business optimism, the BCI provides information on future developments on the basis of opinion surveys on the production, orders, and stocks of finished goods in the industry sector. It can monitor output growth and anticipate turning points in economic activity. Values above 100 suggest increased confidence in future business performance, whereas values below 100 indicate pessimism towards future performance. On average, the countries with higher consumer confidence during the time frame are Ireland, Denmark, and Belarus, and those with higher producer confidence are Latvia, Lithuania, and Russia.
Control variablesThe analysis also controls for the usual enablers of innovative and productive capacity, such as human capital, financial development, trade openness, industry composition, and formal institutional development.
The contribution of optimism to innovation involves how highly skilled individuals use their creativity to generate ideas for new products and services and plan and carry out innovative projects in the market (Weiss et al., 2022). However, their impact can differ depending on the type of firm or region in which they reside. To incumbent firms, human capital provides human resources with ‘prior related knowledge’ to decode ideas from the outside and builds around interpersonal contacts for technology transfer (Lund Vinding, 2006). They can help identify more learning opportunities from FDI technology (Bai et al., 2018; H. Li, 2020). They can also apply for many R&D grants and work to improve their technological input and innovative capabilities (Ning et al., 2017). A high level of human capital helps increase a region's absorptive capacity, which is crucial for identifying new, unused ideas for development as new firms (Kirschning & Mrożewski, 2023; Qian & Acs, 2013). Moreover, evidence has shown that a greater share of employees with postgraduate degrees (as a proxy for human capital) increases a firm's innovation output (D. B. Audretsch et al., 2021). Finally, greater intellectual capital also improves the performance of R&D activities (Strazzullo et al., 2022), which can affect innovation and productivity outcomes. To account for this, the analysis includes tertiary education enrolment as a percentage of the population.
Financial development may facilitate innovation activities by alleviating credit constraints on capital flows into its most productive projects and hence promote R&D financing and growth (M. D. Amore et al., 2013; Benfratello et al., 2008; Brown et al., 2009; Gorodnichenko & Schnitzer, 2013; P. H. Hsu et al., 2014; King & Levine, 1993a, b; Levine et al., 2017). To account for this, the analysis includes domestic credit to the private sector, measured as a percentage of GDP.
There is broad consensus that developing an open economy is a key factor to economic growth (Ács & Virgill, 2009; Giles & Williams, 2000; Gundlach, 1997). In particular, a country's open economy facilitates innovation and productivity growth through different mechanisms, such as knowledge spillovers from other trade partners (Amiti et al., 2023; Huang & Zhang, 2020) or allowing underdeveloped countries to accelerate their innovation drive by imitating leading countries (Minniti & Lévesque, 2010). Moreover, the openness or connectivity of a regional economy is an important factor that impacts the building of pipelines through which external knowledge is channelled into the region, which can aid in the development of innovation capabilities (W. Fu & Qian, 2023). This is especially relevant for emergent economies, where learning opportunities emerging from knowledge imported through FDI can benefit more laggard firms, allowing them to catch up with new technologies used by other local and foreign competitors (A. M. Fernandes & Paunov, 2012; Filippetti & Peyrache, 2017). Economic openness is then controlled by adding a measure of the sum of exports and imports of goods and services as a share of gross domestic product.
The evidence indicates that innovation outcome rates differ across industries. For example, while the service and manufacturing sectors are prone to be more innovative (Morris, 2018), the agricultural sector is the opposite (Wang & Lu, 2020). Similar results have also been reported for productivity dynamics (Fonseca et al., 2018). Moreover, when economies modernize, they tend to change their economic structure, usually from manufacturing (i.e., higher agricultural and manufacturing shares) to a knowledge-based economy (i.e., higher service shares) (Quatraro, 2009). To account for changes in innovation or productivity resulting from economic restructuring, controls are added for the annual shares of GDP from the agricultural, industrial, and service sectors.
Given that institutional quality can enhance innovation capacity (D'Ingiullo & Evangelista, 2020; Petrakis et al., 2017) and patent production (Tebaldi & Elmslie, 2008), the World Governance Index (Kaufmann et al., 2011) is used to control for this effect by constructing a composite variable. This index measures the development of formal institutions, facilitates meaningful comparisons across countries, and monitors progress over time, even accounting for margins of error (Kaufmann, 2007). Owing to the high correlation among its six institutional dimensions, principal component analysis (PCA) was employed to summarize these dimensions with fewer independent variables (Kim, 2008). Only the first component is used as a proxy, as it accounts for 84 % of the total variance in the six dimensions.
Finally, the literature also presents cultural characteristics that could moderate the effect of optimism on innovation, such as risk tolerance, individualism, or some measure of conservatism. In particular, people from individualistic societies prioritise personal achievement (Hayton et al., 2002) and tend to be more innovative (Gorodnichenko & Roland, 2017) and creative (Rinne et al., 2013). Additionally, uncertainty-accepting societies are more innovative than uncertainty-avoiding societies are (Shane, 1993). However, the literature also indicates that individualism is intertwined with economic growth and the quality of formal institutions (Gorodnichenko & Roland, 2011, 2017), as well as with risk preferences. Given that the model already controls for the level of formal institutions, it is expected that the effects of these cultural characteristics will already be accounted for in the analysis.
Identification strategyThis study models a country's innovation as a function of optimism levels and country-specific conditions related to enablers of innovation, such as human capital, market conditions and knowledge endowments.
where Inni,t is the innovation/productivity level of country i in year t, Opti,t is the optimism level in country i in year t, Xi,t is a vector of country-specific characteristics for country i in year t, and εi,t is an idiosyncratic error term that is assumed to be uncorrelated with the other right-hand-side variables. A country specific, time-invariant effect αi captures factors such as culture, geography, climate, and other factors suspected to be determinants of cross-country differences in innovation and productivity but are not explicitly measured. Additionally, a time dummy yt is included to account for factors that are common across countries but change over time (e.g., improvements in general non-patented and patented technology). Since improvements in innovation and productivity are expected to be persistent and self-reinforcing, a lag of the dependent variable is included as an explanatory variable. The importance of this was confirmed empirically, both by testing the null hypothesis that β1=0 (see Table 4) and by estimating the models without lags of the dependent variables and testing for autocorrelation via a Wooldridge test2. The sufficiency of the single lag of the dependent variable was confirmed empirically via the Arellano‒Bond test (see Table 4).
Note that the commonly used least-squares estimator is biased and inconsistent when applied to Eq. 1 because of the potential endogeneity induced by the correlation between αi and the observed explanatory variables. Furthermore, the standard approaches to estimation of panel data models are also biased and inconsistent when applied to Eq. 1 due to correlation between the country-specific means of the explanatory variables and the error term. A popular solution to this problem is to use a generalised method of moments (GMM) estimator with lags of the dependent variable used as instruments. The one- and two-step 'difference' GMM estimator of Arellano & Bond (1991) and the one- and two-step ‘system’ GMM estimator of Blundell & Bond (1998) are examples of this approach. It should be noted, however, that while these estimators have sound theoretical properties, their use in practical applications may be problematic. Hall & Inoue (2003) demonstrate that misspecification of the moments conditions in GMM estimation significantly changes the asymptotic covariance matrix, potentially resulting in substantial size distortions. Since the lag specification of Eq. (1) is merely an approximation of an unknown dynamic structure, the moment conditions implied by the use of lags of the dependent variable as instruments are likely to be misspecified. Recently, Hansen & Lee (2021) and Hwang et al. (2022) proposed a finite-sample-corrected iterated GMM estimator that is robust to mild to moderate misspecification of the moment conditions, largely avoiding the size-distortion issue raised by Hall & Inoue (2003). A further advantage of the iterated GMM estimator is that it avoids the dependence that the one-step and two-step estimators have on the arbitrary initial value specified for the covariance matrix. This paper employs the iterated GMM estimator for its analysis.
A practical issue with GMM estimation of dynamic panel models is instrument proliferation, which can lead to substantial under-rejection of overidentification tests, thus incorrectly signalling too often that the model is correctly specified when it is not (Roodman, 2009b). To reduce the number of instruments, two main approaches are typically used: curtailment, where only a limited number of lags are used as instruments, and collapse, where instruments are combined through addition into smaller sets (Kiviet, 2020; Roodman, 2009a, b). Following Roodman's guideline of having fewer instruments than units of study (countries), this study restricts the number of lagged variables used as instruments to 3 and collapses all other instruments.
Another practical issue to be considered is the effect of national culture in this model. However, as cultural traits tend to remain stable over time (Beugelsdijk et al., 2015), these characteristics should behave as static characteristics in the timeline of this model. Given the nature of panel models, to the extent that these variables are time-invariant and country-specific, they are already included in the model as part of the unobserved fixed effect.
ResultsThe study employs country-level data to investigate the impact of producer and consumer optimism on a country's innovativeness and productivity levels. The panel dataset spans 42 countries from 2000-2020. To account for the dynamic nature of the data, autoregressive terms are included in the model following the Hansen & Lee (2021) iterated GMM methodology for handling dynamic models.
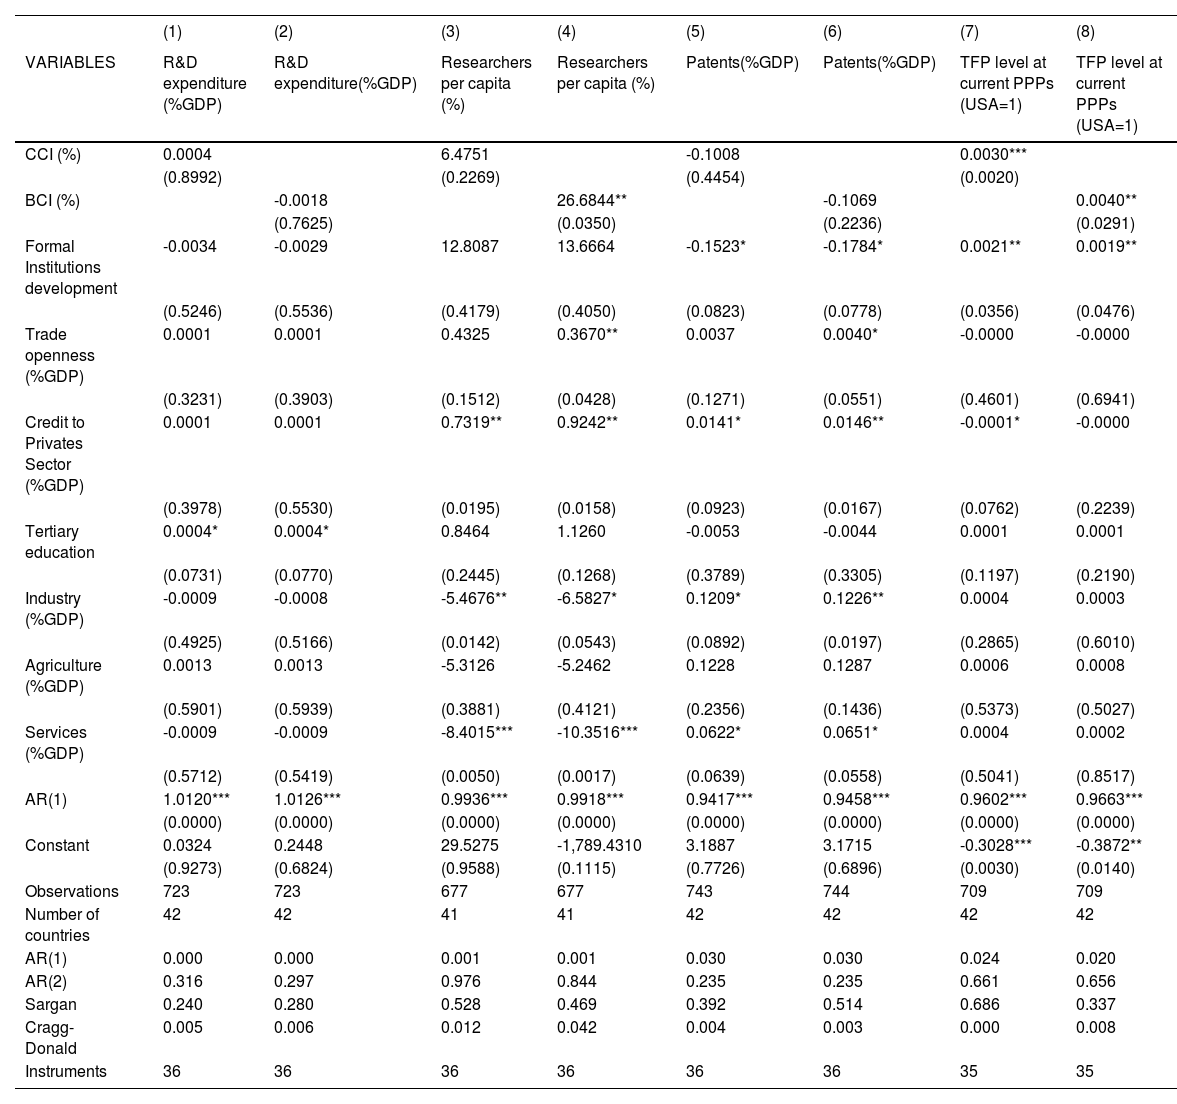
Table 3 shows that, depending on the measure of innovation or productivity changes, the effect of optimism differs. Columns (1) to (4) present the results for the effect of optimism on innovative actions. While Columns (1) and (2) fail to show any effects of optimism on R&D expenditure, in Columns (3) and (4), producer optimism positively explains an increase in researchers, whereas consumer optimism has no effect.
Iterated GMM results.
Regression results using iterated GMM of the effect of optimism proxies on innovation measures. AR(1) and AR(2) are the p values for the Arellano‒Bond test for autocorrelation of the first-differenced residuals in autocorrelation of orders 1 and 2. Sargan is the p value for the Sargan–Hansen test of the overidentifying restrictions. Cragg-Donald is the p value for the Cragg-Donald robust CUE-based (LM version) under identification test. Robust p values, using the Hwang et al. (2022) doubly corrected variance estimator, are in parentheses. *** p < 0.01, ** p < 0.05, * p < 0.1
Columns (5) to (8) report the results on the effect of optimism on innovative results. With respect to patents, the results from columns (5) and (6) show no effect of either optimism measure. Finally, columns (7) and (8) show both optimism measures' positive and significant effects on TPF. When their magnitudes are reviewed, the effect of optimism from producers on productivity is 33 % greater than that from consumers. The usual postestimation tests support the chosen model and estimation method. In particular, for all specifications, the Cragg-Donald test rejects the null hypothesis of under identification, and the Sargan-Hansen test does not reject the null hypothesis that the instruments are valid. Testing with a simple OLS model shows similar results but with less significance for the covariates (available in the appendix).
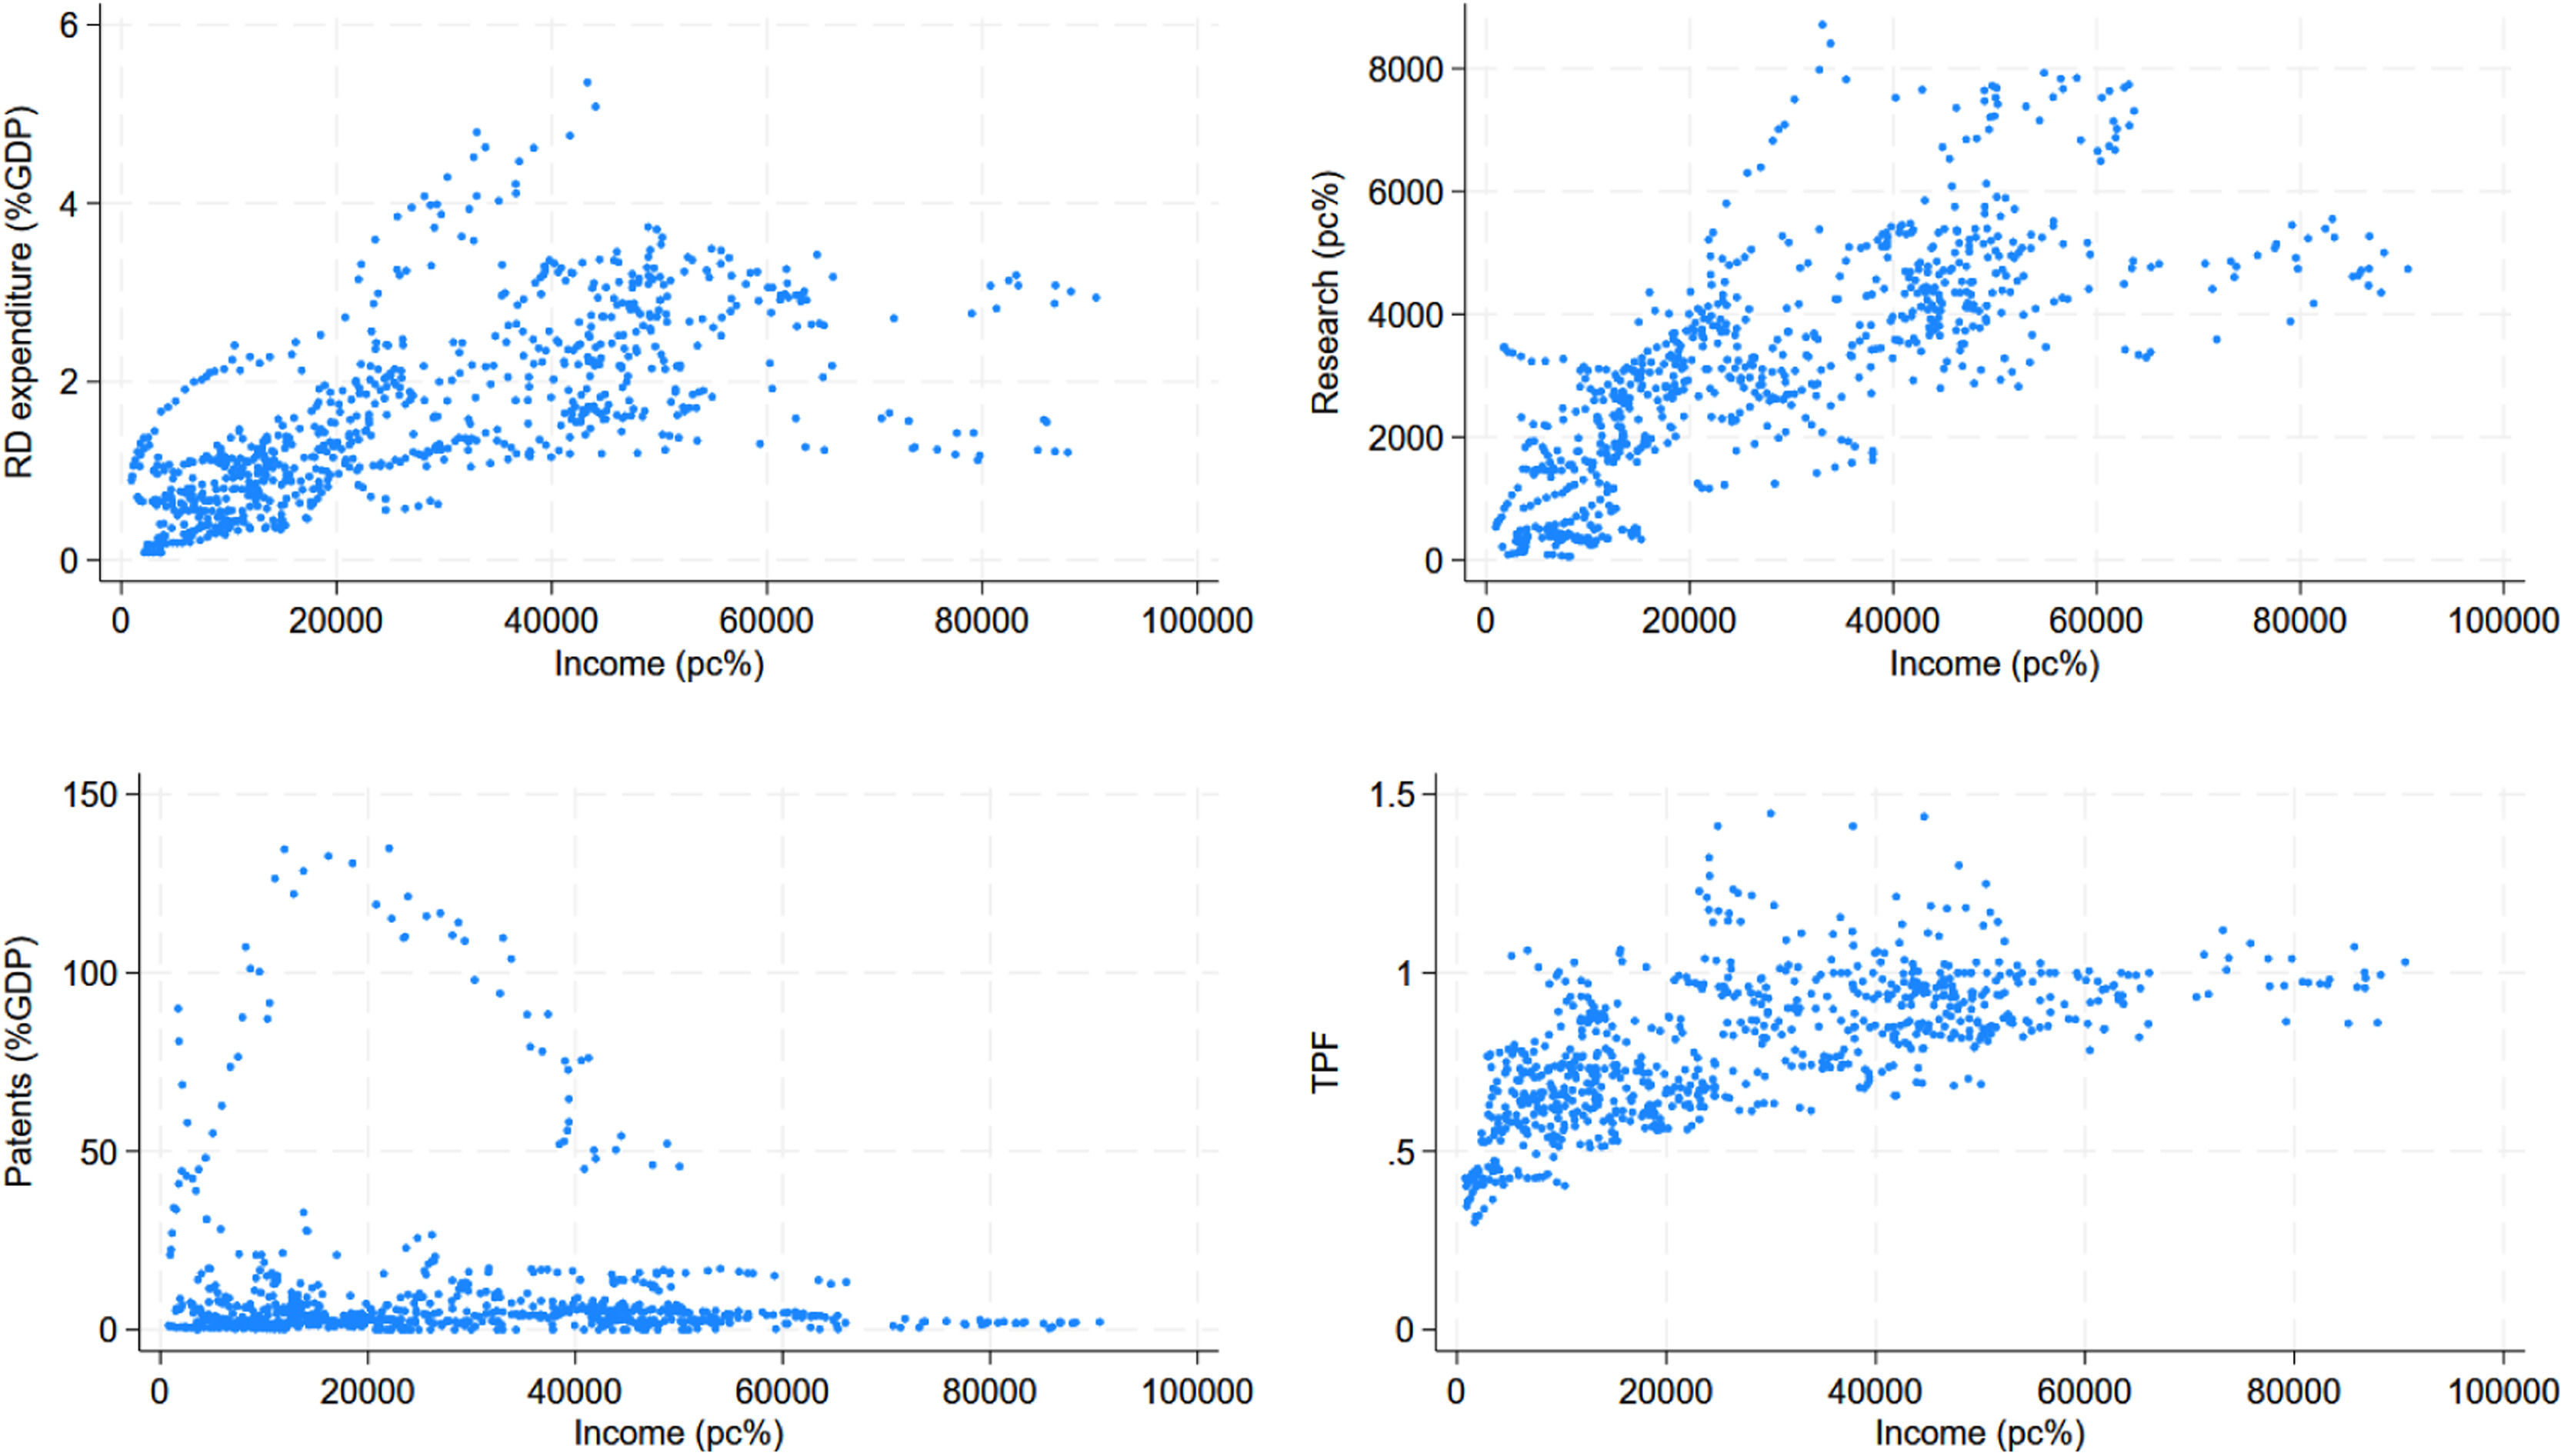
In the next analysis, the sample is divided by income levels to understand how consumer and producer optimism affect innovation, stratified by a country's level of development. The rationale is that, depending on the country's development level, how innovations and productivity outputs are developed and produced differs such that the higher the economic development level is, the greater the country's innovative capacity (Santos et al., 2020). While Fig. 2 shows the effect of income per capita on innovation proxies, Fig. 3 shows the effect of both measures of optimism on innovation proxies, separating the sample by income level.


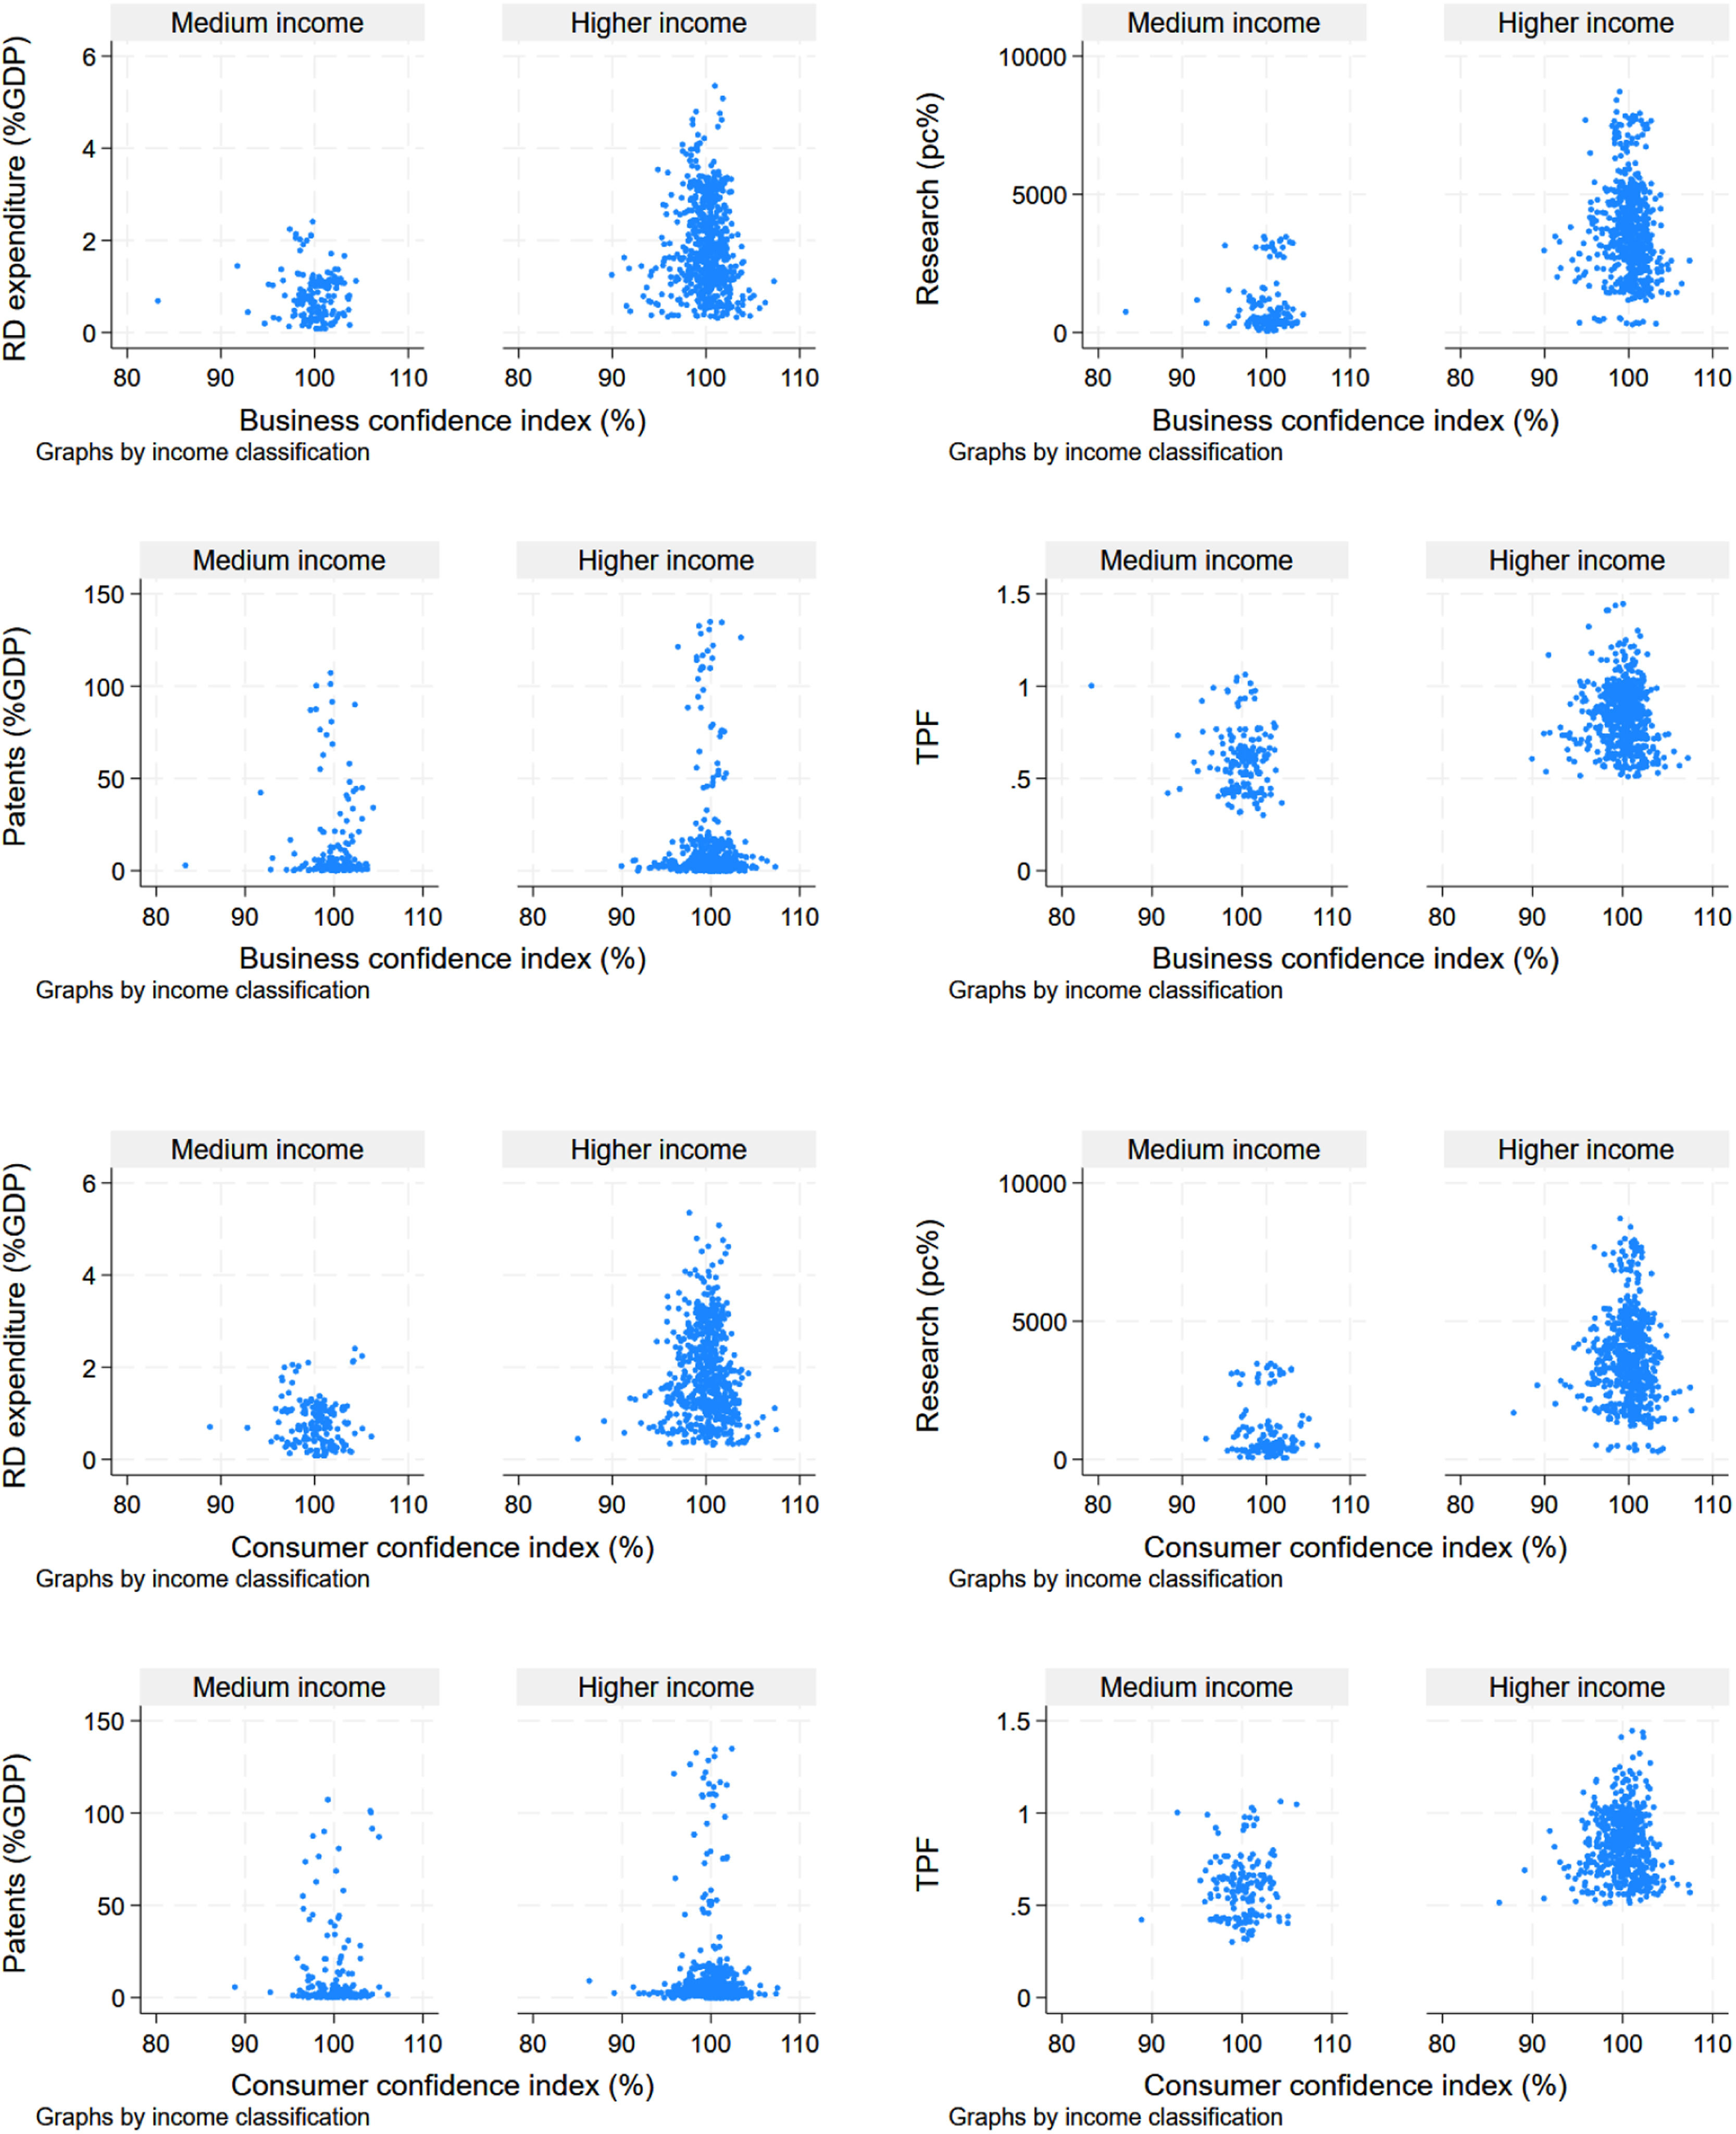
Effects of business and consumer confidence on different innovation proxies, separated by income level
Scatterplot between business and consumer confidence indexes and all four innovation and productivity outputs, separated by income categorisation. Each point represents one country-year.
While the specifications of the instruments for GMM estimation for the high-income sample are the same as those for the whole sample, for the middle-income sample, the size of the sample of countries falls under the number of years. Too many instruments relative to the cross-sectional sample size can cause biased coefficients and standard error estimates and weakened specification tests (Roodman, 2009b). To avoid this issue, the instrument count is reduced to account for the number of countries, where lag moments are reduced from 3 to 2, and time dummies are omitted.
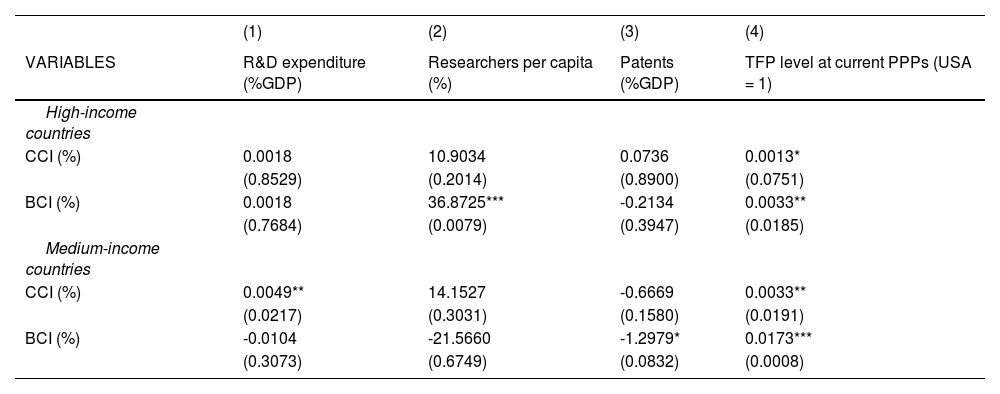
The results, reported in Table 4, differ from those of the previous analysis on the complete sample. In high-income countries, the conduit through which consumer optimism affects innovation changes from TFP to the number of researchers per capita. This suggests an effect of diminishing returns on consumer optimism as country income increases. Moreover, for middle-income countries, while consumer optimism increases spending on R&D, both optimism measures affect TFP more, although with a greater effect from producers.
Results of iterated GMM, partitioning the sample into high- and low-income countries.
Abridged results containing regressors of our two proxies for optimism (consumer and business confidence index, i.e., CCI & BCI) into innovation measures (R&D expenditure as %GDP), researchers per capita (%), patents (%GDP) and TFP level at current PPPs), using iterated GMM and separating the sample into high-income countries and the rest of the sample. All the regressors and statistics are omitted for brevity, whereas the full regressions are available in the appendix. Robust p values, using the Hwang et al. (2022) doubly corrected variance estimator, are in parentheses. *** p < 0.01, ** p < 0.05, * p < 0.1.
Alternative model specifications were explored to check the robustness of the results, and detailed tables of results are available in the supplementary material. First, drawing from the literature suggesting that excess optimism can negatively impact individual and team performance due to overconfidence bias (Amore et al., 2021; Dawson & Henley, 2013; Jian Wang et al., 2014), quadratic terms for both measures of optimism were introduced in the GMM estimation at the aggregate level. However, the results do not indicate any negative effect of overoptimism on innovative outcomes.
Second, concerns about possible longer times between the innovation invention phase and the registration of its patent (Hall et al., 1984; Wang & Hagedoorn, 2014) were also considered. In the robustness analysis, patents were forward lagged by one, two, and three years. The results mirrored those previously obtained, showing no significant effect of either optimism measure on patent production.
Finally, considering that OECD countries are predominantly Western developed economies, it can be argued that their cultural and entrepreneurial ethos emphasize individualism and risk-taking in pursuit of personal success. This cultural context is significant when examining how risk-taking serves as a pathway through which optimism influences innovation. To address these culture-specific characteristics, the main analysis was repeated on a subset comprising only OECD members. The analysis included only years when these countries were full members, accounting for those that joined during the sampled period. The results closely resembled those of the previous subset of high-income countries, with the exception of a slight positive effect observed for consumer optimism on patent production.
DiscussionThe results suggest that the link between optimism and productivity holds in the aggregate. However, the link between optimism and innovation is less straightforward than it is at the microeconomic level and depends on the measures used for the analysis. By testing different measures of innovative actions and results, each finding helps us understand a different facet of the phenomenon.
First, evidence supports the proposition that the effect of an increase in producer optimism on productivity is stronger than the effect from increases in consumer optimism. Furthermore, institutional and macroeconomic policymakers could best design policies that target producer and business confidence for the greatest impact on productivity and innovative activities. However, the positive effect on TPF, combined with a lack of evidence on the effect of any measure of optimism on patent counts, suggest that these innovations are more related to incremental innovations and not radical innovations (i.e., those that should appear more on patent counts). In other words, greater optimism supports an increase in innovative activity, not an increase in innovative performance or the quality of those innovations. It is not that more optimism leads to more innovative individuals; instead, when optimism levels are higher, either more entrepreneurs will switch careers and start new firms, or businesses will expend more R&D and hire researchers for incremental innovations. The lack of a significant effect of optimism on patent production (an effective innovation measure) supports the claim that optimism on a global scale does not lead to increases in per capita output.
Some explanations for these differences could come from firms’ size dynamics or the source of these innovations. For example, Akcigit & Kerr (2018) provide empirical evidence from the US Census of Manufacturers that large firms engage more in “exploitative” R&D, whereas small firms perform “exploratory” R&D (defined similarly to the notions of incremental and radical R&D here). Moreover, Akcigit & Goldschlag (2023a) support this finding, showing that incumbents' inventors produce lower-quality innovations, fewer citations per application, fewer independent claims, and more self-citations (i.e., more incremental). This is also concerning when they show in a recent paper a complementary fall in the share of inventors employed by young firms in the U.S. in recent years (Akcigit & Goldschlag, 2023b).
Second, when the sample is split into income groups, the difference in the effect of optimism on innovation and productivity could be explained by diminishing returns as country income increases. On the one hand, firms from developing economies have fewer incentives to invest in R&D, as they have less capacity and efficiency in terms of patent production (Fu & Yang, 2009). For Amorós et al. (2019), the difference in innovation-related activities between economies may be related to three issues: a disconnect between R&D and new venture creation, causing inappropriate mechanisms for technology and knowledge transfer; scarce use of new technologies in the majority of new business models and ventures; and a lack of consistent policy and public programs that support innovative (technology-based) new firms. In addition, for developing economies, new inventions often suffer a lack of institutional support in the early stages of the innovation development process (e.g., the ideation and conceptualisation stages)(Hyvärinen et al., 2024). This forces researchers to overcome institutional voids before even reaching prototype phases.
Whereas more optimism explains more scientists in high-income economies, this effect is not observed in middle-income economies. Two possible explanations for this are differences between economies, mainly in incentives to perform R&D and how close one economy is to its productivity frontier. On the one hand, if companies in these economies do not have incentives to invest in R&D, they will have to find other sources of innovation to maintain long-term competitiveness. These alternatives may be more common in developing countries, such as engaging in imitative innovation (Minniti & Lévesque, 2010), learning by exporting (Bravo-Ortega et al., 2014) or importing foreign intermediate goods (Kasahara & Rodrigue, 2008) and technology (González-Pernía et al., 2015; Montégu et al., 2021). These less innovative activities will likely increase productivity in the country and thus increase TFP, although they will not necessarily appear on measures such as R&D spending, scientific activity, or patent production.
On the other hand, when high-income economies are closer to the productivity frontier, underdeveloped economies (e.g., medium- or low-income) are not. In fact, fast-emerging economies can exhibit patterns of growth on the basis of a reduction in the technology gap, where the role of investment in technological capabilities is to spur productivity catch-up (Filippetti & Peyrache, 2017). As margins of productivity gains are lower in frontier economies, the positive effect of optimism would have a lower relevance than would other significant effects on other innovation measures. Moreover, while high-income countries are likely to have an economy focused on innovation (explaining more researchers in higher optimism settings), they also focus more on services instead of manufacturing, which in turn drives TPF convergence rates between countries (Boussemart et al., 2011). Furthermore, the lack of evidence on the effect of optimism on higher patent production, even in high-income economies, suggests that this increase in professionals participating in research does not translate into newly finished, registered inventions; rather, it is only an increase in activity. Moreover, high-tech firms, which are more common in high-income, complex economies (UNCTAD, 2023), are, on average, more active in all forms of intellectual property, such as patent protection, which is also related to more innovative activity (Simcoe & Timothy, 2023).
Finally, despite evidence in the literature about the negative effect of individual overoptimism on individual or team innovative capabilities, the results could not support it in aggregate terms. One possibility for this could be how an excess of optimism affects innovation. As an increase in optimism would lead to an increase in new projects, when the aggregate effect is considered, it would mean that more innovative activities would appear. Therefore, an increase in activity will counteract the possible damage to individuals' innovativeness effectiveness. One example of this is the venture capital boom between 2015 and 2020. As the world saw an increase in this type of risk investing in an economic period of high optimism, this led to an increase in projects without viable technology or even robust-sounding business models (e.g., WeWork or Theranos; see Casnici, 2021). At an aggregated level, this increase in innovation activity countered the increase in bad-quality funded projects.
ImplicationsThis work extends the understanding of the link between optimism, innovation, and productivity in several ways.
First, the results suggest that increases in optimism lead mainly to increases in innovative activity, not to increases in quality innovations. In a previous study on the effect of optimism on entrepreneurial rates, Anglin et al. (2018) discussed the dangers of efforts to increase collective optimism through policies that may effectively promote entrepreneurial activity. High optimism often hurts the performance of entrepreneurial organisations in the long run, leading to poor decision-making (e.g., Hmieleski & Baron, 2009). Moreover, artificially inflating optimism could encourage entrepreneurs to prematurely make significant resource commitments to launch or grow a venture, which would increase start-ups and firm growth in the short term but may lead to increased company failures and wasted resources in the long term. However, the increases in TPF in high-optimism settings suggest that some of these new businesses or products are translating into an increase of an economy's performance. The implication is that an economically optimistic environment is an important contribution to a nation's entrepreneurial ecosystem. This insight shows that firms need not specifically recruit optimistic individuals to reap the benefits of the optimism effect. Policies that encourage economic optimism can orchestrate an environment in which the benefits of the optimism effect are realised, independent of the individual personality traits of its citizens.
Second, by identifying the positive link between optimism and productivity, measured as TFP, it supports the literature that links market sentiment and future economic growth. Constantinides et al. (2023) shed new light on this issue by exploiting cross-country variation in sentiment and market efficiency. Their results revealed that sentiment shocks in the G7 countries increase economic activity, but only temporarily and without affecting productivity. In contrast, sentiment shocks in non-G7 countries predict prolonged economic growth and a corresponding increase in productivity. These results suggested that sentiment can indeed create economic booms, but only in less advanced economies where noisy asset prices make sentiment and fundamentals harder to disentangle. A comparison of these results with those of this study reveals a similar tale, where the magnitude of the effect of optimism on TFP in middle-income countries was tenfold greater than the effect in higher-income countries.
Third, from a policy standpoint, even though recent studies have shown that middle-income countries are more likely to have higher optimism levels than high-income developed countries (Baranski et al., 2021; Ipsos, 2018), this is not enough to unleash their innovative potential. When emerging economies seem to have innovation advantages due to their optimism, their lack of effective mechanisms for further development diminishes their ultimate impact on economic growth. Furthermore, how optimism leads to more innovation is also relevant, as an increase in innovators in quantity only and not in a rise in their creativity or quality could only lead to an increase in failed projects. This could also be worse in an underdeveloped setting, with lower human capital and worse mechanisms for entrepreneurs taking these ideas into new businesses than in developed countries (as the results from Mahn & Poblete, 2023 suggested). As the success of new products and services will depend on the ability of each economy's markets to absorb them, the optimism effect on a country's innovativeness outcomes will depend on its ability to support knowledge creation while fostering how it will transition into new businesses.
ConclusionsThe contribution of this paper is threefold. First, it distinguishes between consumer and producer optimism, focusing particularly on OECD countries, which represent close to half of the world's GDP and where the data availability and quality are high. This allows us to explore a potential causal relationship between optimism and innovation/productivity by using state-of-the-art identification strategies that utilize iterated system GMM to address endogeneity.
Second, it explores the potential impact of innovation from both an input and output perspective by measuring innovation from various aspects. By using different measures of innovative activity, productivity and innovative outcomes and country optimism, and controlling for country characteristics, this study fills a gap in understanding how some countries are more productive and entrepreneurial than others. The results suggest that greater optimism in an economy supports an increase in innovative activity but not an increase in innovative performance or the quality of those innovations. It is not that more optimism leads to more innovative individuals; instead, when optimism levels are higher, either more entrepreneurs will switch careers and start new firms, or businesses will hire researchers for incremental innovations. The lack of significance of optimism for patent production (an innovation measure) supports the claim that optimism on a global scale does not necessarily lead to increases in innovative outputs.
Third, the findings concerning TFP further confirm endogenous growth theory (see, e.g., Aghion & Howitt, 2009) and establish a potential link between optimism and productivity growth through the channel of innovation. When the sample is divided into high- and medium-income countries, the results show that the benefits of economic optimism diminish somewhat. Moreover, the differences between medium- and high-income economies can be explained by diminishing returns to income and their closeness to the productivity frontier. For example, developing economies can be more prone to replace the development of their own technologies by engaging in imitative innovation (Minniti & Lévesque, 2010), learning by exporting (Bravo-Ortega et al., 2014) or importing foreign intermediate goods (Kasahara & Rodrigue, 2008) and technology (González-Pernía et al., 2015; Montégu et al., 2021). These less innovative activities are likely to increase productivity in the country and thus increase TFP, although not necessarily through measures such as R&D spending, scientific activity, or patent production.
This study clearly has significant implications and practical applications, especially for policymakers. The results suggest that business confidence is quite important for driving innovation, especially through research personnel and productivity growth. In contrast, the impact of consumer confidence is marginal in this respect. On the one hand, intuitively, this may mean that policymakers need to focus on boosting business confidence to take advantage of this impact. On the other hand, however, they should also not neglect the fact that consumer confidence may also impact business confidence. It is difficult to imagine that an economy with low consumption due to low consumer confidence could generate greater business confidence. Therefore, in some cases, policymakers may need to boost consumer confidence first to take advantage of the positive impact of business confidence on innovation and productivity growth. Furthermore, in many cases, both consumer and business confidence are heavily impacted by macroeconomic conditions, implying that it is more important for economic policymakers to manage the macroeconomy well in the first place to boost confidence and kick-start a new wave of innovation.
This study is not without limitations. One issue is related to the use of secondary data, as the chosen measures for innovation and optimism are indirectly measured. Additionally, firms of different sizes and ages are not equally innovative, and neither is every industry the same. In addition, as the data sample comes from the OECD, the hypotheses are tested only in a sample consisting of a majority of high-income countries.
Future research can address several limitations identified in this study to advance theoretical understanding. First, conducting a more granular analysis using firm-level data would enable further exploration of how psychological states influence macroeconomic changes across diverse firms and industries. Second, expanding the sample to include countries at different economic stages, particularly those less reliant on innovation in their economic structures, could provide insights into how optimism impacts innovation in lower-middle- and lower-income countries. Finally, as the onset of the COVID-19 pandemic limits the study timeframe, future studies could investigate how post-COVID-19 world characteristics affect the conclusions drawn in this study. This includes examining phenomena such as global economic decoupling, advancements in artificial intelligence displacing labour with capital, digitalization and remote work dynamics, and assessing their potential impacts on the relationship between optimism and innovation.
Data availability statementThe data and code supporting this study's findings are available in this article's supplementary material.
CRediT authorship contribution statementDaniel Mahn: Writing – original draft, Methodology, Data curation. Cong Wang: Writing – review & editing, Supervision, Methodology. Danielle Kent: Writing – review & editing, Conceptualization. Chris Heaton: Writing – review & editing, Supervision, Methodology.
This project has been partly funded by the 'International Cotutelle Macquarie University Research Excellence Scholarship (20223972)', and the 'Agencia Nacional de Investigación y Desarrollo, Chile (21210955)'.
Daniel Mahn is a lecturer in economics and innovation at the University of Concepcion Engineering School. He holds a PhD in economics from Macquarie University. His work focuses on the intersection of the economics of entrepreneurship, innovation, public policy, and development economics. His work has been published in the Journal of Entrepreneurship in Emerging Economies (JEEE) and Entrepreneurship and Regional Development (ERD), and also practises consulting on small businesses and innovation.
Cong Wang is a graduate from Monash University, currently a senior lecturer at the Department of Economics, Macquarie University in Australia. His research area includes growth and development, institutions, innovation, technological change, and corporate finance.
Dr Danielle Kent is a Senior Lecturer in the Discipline of Finance at the University of Sydney Business School. Her area of expertise is Behavioural Finance. She has published in leading peer-reviewed journals including Management Science and Scientific Reports Nature. Danielle has worked in Papua New Guinea for the World Bank designing randomized controlled trials, before undertaking a postdoctoral fellowship under Prof Michael Hiscox from Harvard. Danielle has also worked as a Principal Behavioural Advisor in the NSW Department of Premier and Cabinet. Danielle brings a wealth of experience from industry and government in applying behavioural finance to create innovative solutions.
Chris Heaton is a Senior Lecturer in the Department of Economics at Macquarie University where works in the field of econometrics. His main theoretical contributions have been in the area of identification and estimation of latent factor models of multivariate time series. He also does applied econometric research in a number of fields including labour economics, the economics of education, forecasting and financial economics.
Some examples can be seen by Kilic & Cankaya (2016) in the US, (Malgarini & Margani (2007) in Italy or Faroque & Veloce (2010) in Canada.
F values for each test on dependable variables are: R&D expenditure F(1,41) = 126.209, researchers F(1,40) = 76.681, patents F(1,41) = 23.041 and TFP F(1,41) = 46.563. In all four cases the test rejects the null of no first-order autocorrelation with Prob>F =0.0000.