


Edited by: Abbas Mardari
More infoThe double externalities of green technological innovation and disadvantages of the traditional extensive development of manufacturing industries hinder the transformation of green technological innovation in manufacturing industries. Traditional research based on behavioral logic rarely focused on the subjective will of innovation subjects or the impact of environmental regulation. To unlock the development dilemma of manufacturing industries from the coupling perspective of dual logic of behavior and concept, the concept of function is introduced into this analysis along with the influence of behavioral logic. This helped to construct the model of system dynamics wherein green technology innovation in manufacturing is analyzed under the influence of environmental regulation. The subsystems of willingness, behavior, and benefits of green technological innovation were divided by a systematic analysis of the double impact factors inside and outside manufacturing. Based on the index data from 2011 to 2019, Vensim software was used for simulation. Unlocking paths for transforming green technological innovation in the manufacturing industry were designed. The conclusions show that environmental regulation positively improves the economic, social, and environmental performance of manufacturing industries. Additionally, manufacturing can unlock the dilemma by reducing the intensity of command-and-control, improving the intensity of market-based incentives, and actively stimulating public participation in environmental regulation.
Manufacturing is a key sector of the national economy due to the long-term use of extensive development patterns. It has characteristics such as high cost, long cycles, and uncertainty, causing it to face multiple locking of resources and the environment (Tang, Zhang, Lin & Lao, 2020). Coordinating the contradiction between economic growth and environmental protection under low-carbon and high-quality development has become the focus of the manufacturing industry. As a new means for technological innovation, green technological innovation improves the environment while upgrading technology and promoting the economy, which is essential for promoting sustainable development of manufacturing industries (Barbieri, Marzucchi & Rizzo, 2020). Green technological innovation is characterized as "environmental protection" and "innovation," showing the knowledge spillover of positive externalities and dual characteristics of negative externalities of environmental pollution (Cai & Li, 2017). Existing research mostly starts from the perspective of behavioral logic and explores how green technological innovation is a technology set transformed from a single terminal passive governance model to a comprehensive terminal governance technology, green products, and green processes (Triguero, Moreno-Mondéjar & Davia, 2013; Li, Zheng, Cao, Chen, Ren & Huang, 2017). However, green technological innovation behavior is often affected by the active will of the subject; therefore, it is not comprehensive to study it from a single perspective of behavioral logic. Additionally, the transformation of green technological innovation in manufacturing industries is difficult to achieve using solely market mechanisms. The manufacturing industry must consider the influence of policy-driven factors when weighing the pros and cons of green technological innovation (Kriechel & Ziesemer, 2009). For this reason, it is particularly important to unlock the manufacturing industry's development dilemma to systematically study the path of the transformation of green technology innovation from the logical perspective of dual coupling—behavior and concept. Environmental regulation is important for transforming green technology innovation in the manufacturing industry and is an important driving factor for governments to solve environmental pollution problems (Liu, Chen & Zhang, 2021). The current tools of environmental regulation are primarily command-and-control, which have been transformed into command-and-control and market-motivated environmental regulations, however an effective, comprehensive system of environmental regulation has not been formed (Blackman, Li & Liu, 2018). Hence, this research takes China's manufacturing industries as the research object under the dual logical coupling behavior and concept perspective. This study systematically analyzes the impacts of different environmental regulation policies on green technology innovation. This is of great theoretical and practical significance for further exploring the unlocking mechanism and designing the path of green technology innovation transformation dilemma in manufacturing industries.
Literature reviewThe dilemma of the transformation of green technology innovation in manufacturing industries is an important issue in academic research and practice (Zhang et al., 2020). To unlock the dilemma, many scholars have made useful explorations from the perspectives of technology, system, and the market (Li, Liang & Han, 2018).
The perspective of technology: Most scholars focus on the object of green technology innovation and divide its types from the perspective of behavioral logic (Qiu, Hu & Wang, 2020) to unlock the development dilemma of traditional manufacturing industries with "high pollution, high emissions, and low benefits" and promote its transformation and upgrading to achieve sustainable development. Xie, Huo and Zou (2019) studied how green product innovation and green process innovation can improve enterprise performance using a content analysis method based on data from 209 listed companies in manufacturing industries with heavy pollution. Zhang, Wang, Xue and Yang (2018) analyzed the impact of environmental regulation on green product innovation, green process innovation, and end governance technology innovation using hierarchical regression based on data from 298 high-end manufacturing enterprises. However, the theory of planned behavior believes that the subject's subjective will can directly impact their behavior (Peng, Shen, Ying & Wang, 2021). It is not comprehensive to discuss the choice of behavior and implementation effect of the transformation of green technological innovation in manufacturing industries from the perspective of a single logic of behavior. Hence, it is necessary to explore the transformation of green technological innovation in manufacturing industries driven by the dual logic of behavior and concept.
The perspective of institutions: Previous scholars have mostly focused on the impact of environmental regulations on green technological innovation and, through quantitative research, have verified that the unlocking of institutions can promote the green development of manufacturing industries (Bergek & Berggren, 2014). Moreover, the effects of environmental regulation on green technology innovation has been a topic of interest in academic discussions (Lin, Lian & Li, 2022). There are mainly three types of representative views. First, according to the positive promotion view, appropriate environmental regulation will force companies to reduce costs of pollution emissions to enhance green technology innovation to create an "innovation effect" (Ramanathan, Ramanathan & Bentley, 2018; Mitsutsugu, 2005). Second, the view of reverse inhibition holds that environmental regulations encourage enterprises to allocate funds to reduce pollutant emissions, occupy enterprises' R&D funds, increase the cost of technological innovation, and then hinder enterprises' green technological innovation, namely, the "cost compliance effect" (Cainelli, Marchi & Grandinetti, 2015). Third, the influence of environmental regulations on green technological innovation is nonlinear. Wang, Sun and Guo (2019) found that the relationship between environmental regulation and green technological innovation is U-shaped and inverted U-shaped.
Additionally, some scholars believe that the reason for the above difference in research is that the types of environmental regulations have heterogeneous impacts on green technological innovation in manufacturing (Luo, Muhammad & Lu, 2021). For command-and-control environmental regulation, Xie, Yuan and Huang (2017) pointed out that command-and-control environmental regulation promotes enterprises' behavior of green technology innovation. As for the market-oriented incentive environmental regulation, Ren, Li, Yuan, Li, and Chen (2018) studied that market-oriented environmental regulation can promote enterprises' green technology innovation activities. Sun, Wang, Liang, Cao, and Wang (2020) empirically tested whether market-oriented incentive environmental regulation has a more significant incentive effect on enterprises' green technological innovation behavior than command-and-control environmental regulation using panel data from 2012 to 2017. Zhao, Zhao, Zeng and Zhang (2015) believe that command-control and market-oriented incentive environmental regulations focus on incentive effects at different levels. The former plays a role in enterprises' green technological innovation abilities, whereas the latter contributes to their strategic planning of green development. In summary, most studies divide environmental regulation into two types: command-and-control and market-based incentives (Pan, Ai, Li, Pan & Yan, 2019), and seldom consider the role of public participation in environmental regulation in the transformation of green technological innovation. With the improvement of public awareness of environmental protection, the effect of environmental protection on public participation in environmental regulation has gradually increased (Yi, Fang, Wen, Guang & Zhang, 2019).
Green technological innovation has two external features (Shen, Li, Jin & Li, 2022). Traditional research only considers the influence of a single tool of environmental regulation on green technology innovation (Lin, Wang & Wu, 2022). Still, a single policy of environmental regulation, due to the constraints of its characteristics, makes it difficult to play the role of incentive for technological innovation and control of environmental pollution. The combinational strategies of different types of environmental regulations often offer complementary advantages. Accordingly, this study categorizes environmental regulations into command-and-control incentives, market-based incentives, and public participation. It comprehensively explores the impacts of different types of environmental regulations and their combined policies on the transformation of green technological innovations in the manufacturing industry.
The market perspective: Most existing studies unlock the dilemma of insufficient internal motivation of subjects of green technological innovation from the perspectives of the government (Wu & Hu, 2020), market (Yao, Yu & Jia, 2022), and enterprises’ (Li & Gao, 2022). It includes using an evolutionary game (Wu, Deng & Niu, 2022) to analyze the dynamic process of decision-making and strategic selection of subjects of green technological innovation, using system dynamics (SD) modelling (Chen, Yi, Chen, Peng & Yang, 2023), structural equations (Xu, Zhang, Fan & Wang, 2022), and other methods to quantify the effect of green technological innovation in manufacturing industries. For example, Wang, Li, Cheng, Zhong, and Ma (2021) explored the influence of market regulation on enterprises' green technology innovation by constructing a tripartite model of the evolutionary game for government, enterprises, and consumers. From the perspective of input and output, Luo, Miao, Sun, Meng and Duan (2019) applied data envelopment analysis (DEA) to study the improvement of technological progress and technical efficiency, which significantly promoted the improvement of industrial efficiency of green technology innovation. Naidoo (2010) constructed a structural equation model to explore the impact of market orientation, market innovation, and enterprises’ competitive advantages on their green technology innovation.
However, the transformation of green technology innovation in manufacturing industries is a complex social system with multiple feedback structures (Lu et al., 2022), and existing research lacks a relatively systematic system. In contrast, system dynamics can comprehensively reflect the causal feedback relationships among various indicators. Nevertheless, few scholars have comprehensively considered the internal and external factors influencing the transformation of green technological innovation in manufacturing industries from the perspective of systems. Additionally, existing research mainly analyzes economic, social, resource, and environmental subsystems while applying system dynamics models and seldom considers the effects of other subsystems (Liu, Li, Teng & Dai, 2022).
Therefore, starting from the coupling perspective of behavioral and conceptual logic, this study breaks through the limitation of traditional research, which focused on only the perspective of behavioral logic, and expands the research perspective using conceptual logic for green technological innovation. Through a systematic analysis of the influence of internal and external factors on the transformation of green technological innovation in manufacturing industries, the subjects’ consciousness and behavior of green technological innovation in manufacturing industries were incorporated into the system dynamics model, and the subsystems of the behavior, intention, and benefits of green technological innovation were divided. The Vensim software was used to simulate the economic, social, and environmental performance of the transformation of green technology innovation in manufacturing industries, using relevant data from 2011 to 2019. The unlocking path of the dilemma of the transformation of green technological innovation in manufacturing industries was then designed. The impact of the above path on the transformation of green technological innovation in the manufacturing industry was simulated and analyzed. It is important to recommend targeted countermeasures and suggestions for the government to formulate policies for environmental regulation and enhance the transformation of green technological innovation in manufacturing industries.
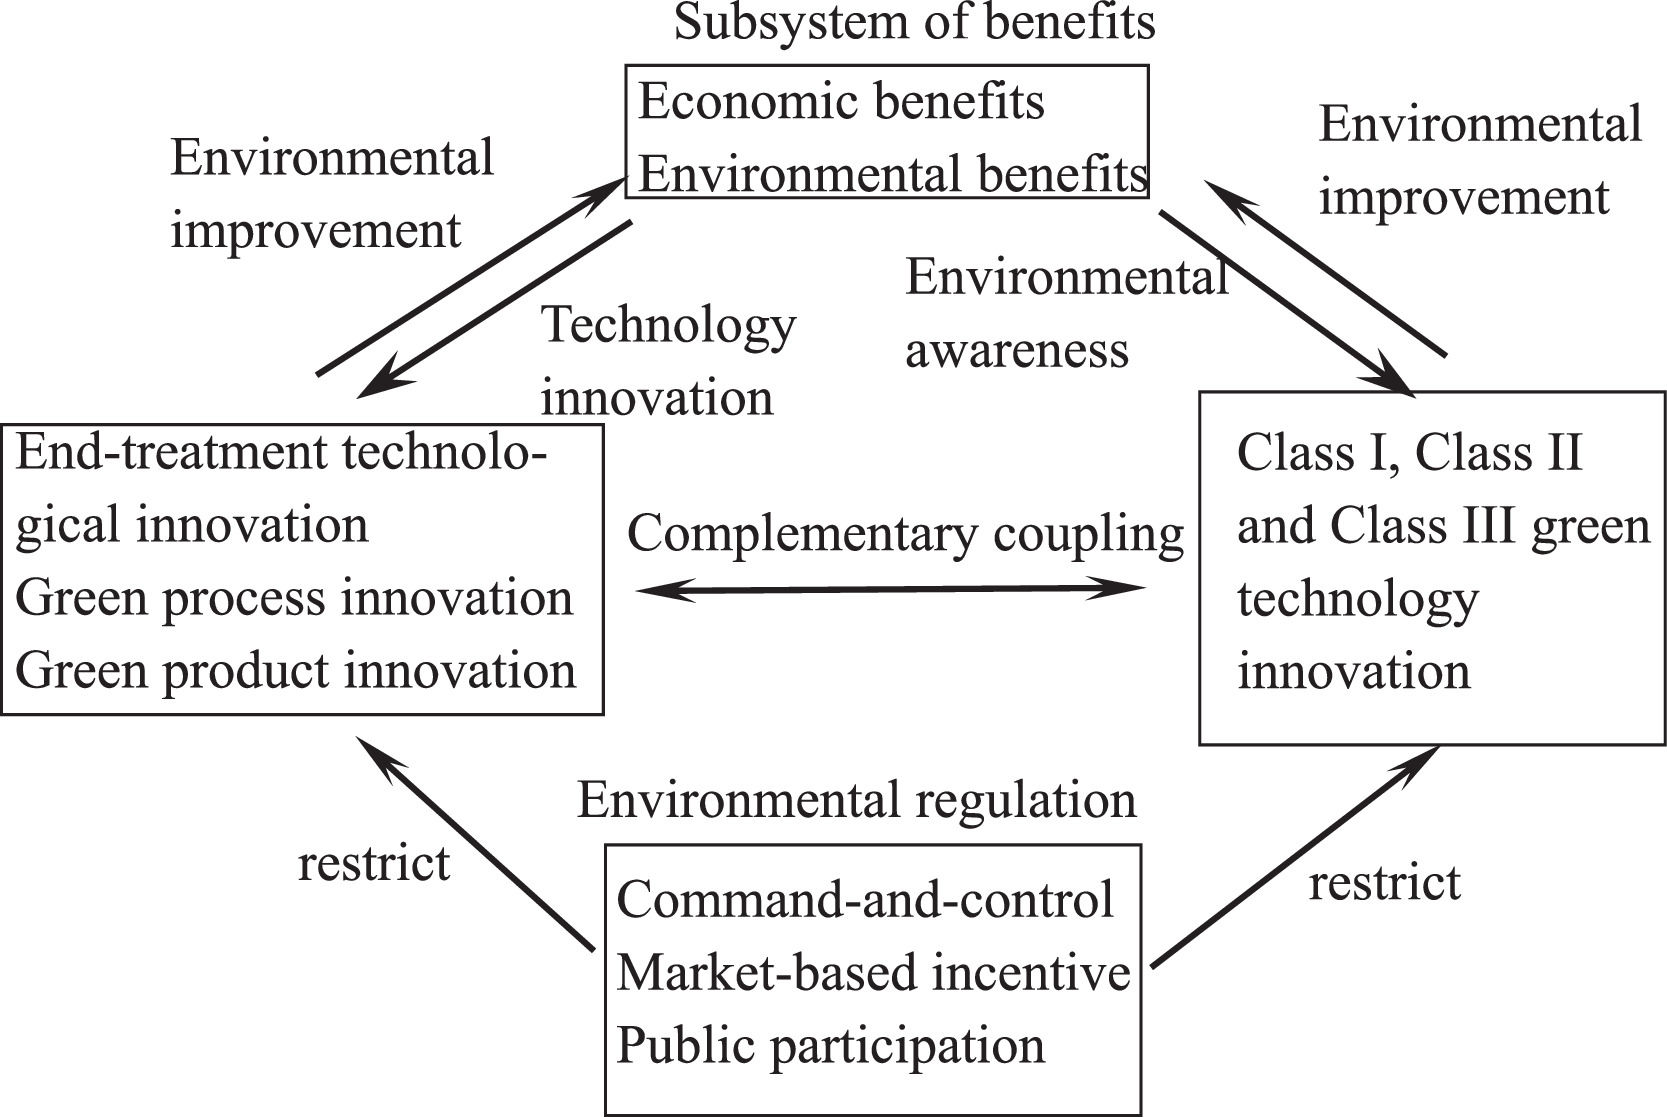
System dynamics (SD) model constructionSystematic composition of the system dynamics modelAs the green technological innovation system in manufacturing industries is a complex system with multiple feedback structures, which is comprehensively influenced by environmental regulations and the subjective will and behavior of system subjects, it can be divided into three subsystems: behavior, willingness, and benefits of green technological innovation. As an exogenous control variable in the green technological innovation system of manufacturing industries, environmental regulation plays a regulatory and controlling role in the SD model, directly or indirectly affecting other subsystems. The structure of this system is shown in Fig. 1.

It can be seen from Fig. 1 that the system of green technology innovation in manufacturing includes three subsystems: behavior, willingness, and benefits of green technology innovation. Specifically:
Subsystem of green technological innovation behavior. Li, Huang, Ren, Chen and Ning (2018) divided green technology innovation into green product innovation and green process innovation. Río, Morán and Albiñana (2010) divided it into end-treatment technological innovation and clean production technology innovation. Therefore, green technological innovation behavior mainly includes the indices of end-treatment technological innovation, green process innovation, and green product innovation. End-treatment technological innovation refers to improving terminal treatment technology and equipment at production terminals to reduce the discharge of pollutants, such as waste solids, gas, andwater. Hence, this research adopts the average value of the wastewater treatment facility disposal amount, waste gas treatment facility disposal amount, and solid waste comprehensive utilization amount to measure end treatment technology innovation. Green process innovation refers to reducing the generation of pollutants through material replacement, process equipment updates, and disposal of waste emissions (Cherrafi, Garza-Reyes, Kumar, Mishra, Ghobadian & Elfezazi, 2018). Green process innovation significantly affects manufacturing industries’ economic and environmental benefits (Huang & Li, 2017). Therefore, this study measures green process innovation using the ratio of manufacturing value-added and manufacturing pollutant emissions. Green product innovation refers to the production of environment-friendly green products that reduce resource consumption and environmental pollution in the process of design, research and development, and market entry (Hing, Rachel, Dai & Lim, 2016). Accordingly, this study uses the ratio of the sales revenue of green products to the pollutant emissions from the manufacturing industry to represent green product innovation. Additionally, to realize the comparability of three-dimensional indicators, this study adopts the min-max standardization method to deal with these three types of green technological innovation.
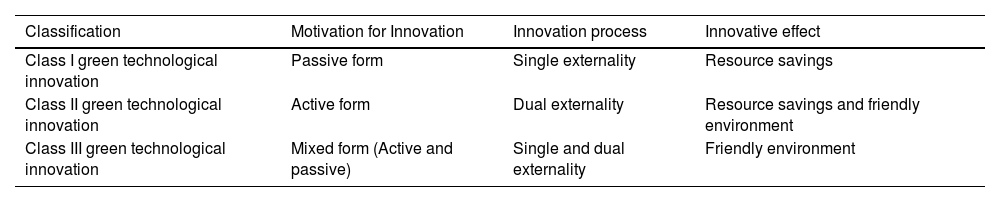
Subsystem of willingness for green technological innovation. According to the subject of green technological innovation in the pursuit of the environmental performance of active consciousness (Gao, Feng, Guan & Zhang, 2022), the subsystem of the willingness of green technology innovation is divided into Class I, Class II, and Class III green technology innovation. ClassⅠgreen technology innovation, or passive green technology innovation, refers to manufacturing industries unconsciously pursuing environmental benefits and improving the ecological environment in the process of economic development, and its process of innovation is only a single external spillover effect. Class II green technological innovation, or active green technological innovation, refers to manufacturing industries that consciously and actively pursue environmental benefits to achieve sustainable development. Its innovation process has external spillover and environmental externalities brought about by green technology innovation to reduce environmental pollution. Class III green technological innovations are also known as mixed-green technological innovations. Because green technology innovation has threats such as high research and development (R&D) risk, long cycle of return, and uncertain results, manufacturing industries need the support of external macro environment such as the social system and mechanism of economic development when pursuing environmental performance. Therefore, in low-carbon development, Class III green technology innovation manufacturing industries actively pursue environmental benefits and passively pursue environmental performance under external environmental pressure. The concepts and characteristics of Class I, Class II, and Class III green technological innovations are listed in Table 1.
The concept and classification of green technological innovation.
From Table 1, the transformation process of green technological innovation in manufacturing industries ranges from Class I to Class II green technological innovation. Class III green technological innovation is transient and Class II is the final form of green technological innovation in the manufacturing industry. Therefore, this study focuses on manufacturing industries involved in Class II green technological innovation.
Subsystem of benefits of green technological innovation. These include the economic and environmental benefits of green technological innovation. Economic benefits are mainly reflected in increased sales revenue of green products in the manufacturing industry. Environmental benefits are mainly reflected in the reduction of pollution emissions by the manufacturing industry. The combined economic and environmental benefits are conducive to the manufacturing industry and the government for increasing investment in the R&D t of green technological innovation to create a virtuous cycle.
The causal diagramThe key to the SD model is to draw a causal relationship diagram with a clear, logical structure, expressing the causal feedback relationship of various elements in the system to deeply analyze the operation mechanism of the system of green technology innovation in manufacturing industries. Before drawing a causal relationship diagram, the causal relationships within the system should be summarized. The transformation of green technological innovation in manufacturing industries is divided into subsystems of behavior, benefit, and willingness of green technological innovation. Environmental regulation is an exogenous control variable in the system, which plays a regulating and controlling role in the SD model, thus directly or indirectly affecting other subsystems. As shown in Fig. 1, the subsystem of green technological innovation behavior includes green process innovation, green product innovation, and end-treatment technological innovation. Green process innovation can effectively reduce pollutant emissions by improving the utilization efficiency of resources and energy, thus significantly impacting enterprises' economic and environmental benefits (Xie, Thao & Zhu, 2022). Green product innovation improves the production technology of green products and positively impacts the market demand and performance of enterprises (Lin, Tan and Geng, 2013). End-treatment technological innovation can effectively reduce pollutant emissions in manufacturing industries, and improve the ecological environment to promote the core competitiveness of manufacturing industries, thus improving their economic benefits (Li & Lv, 2021).
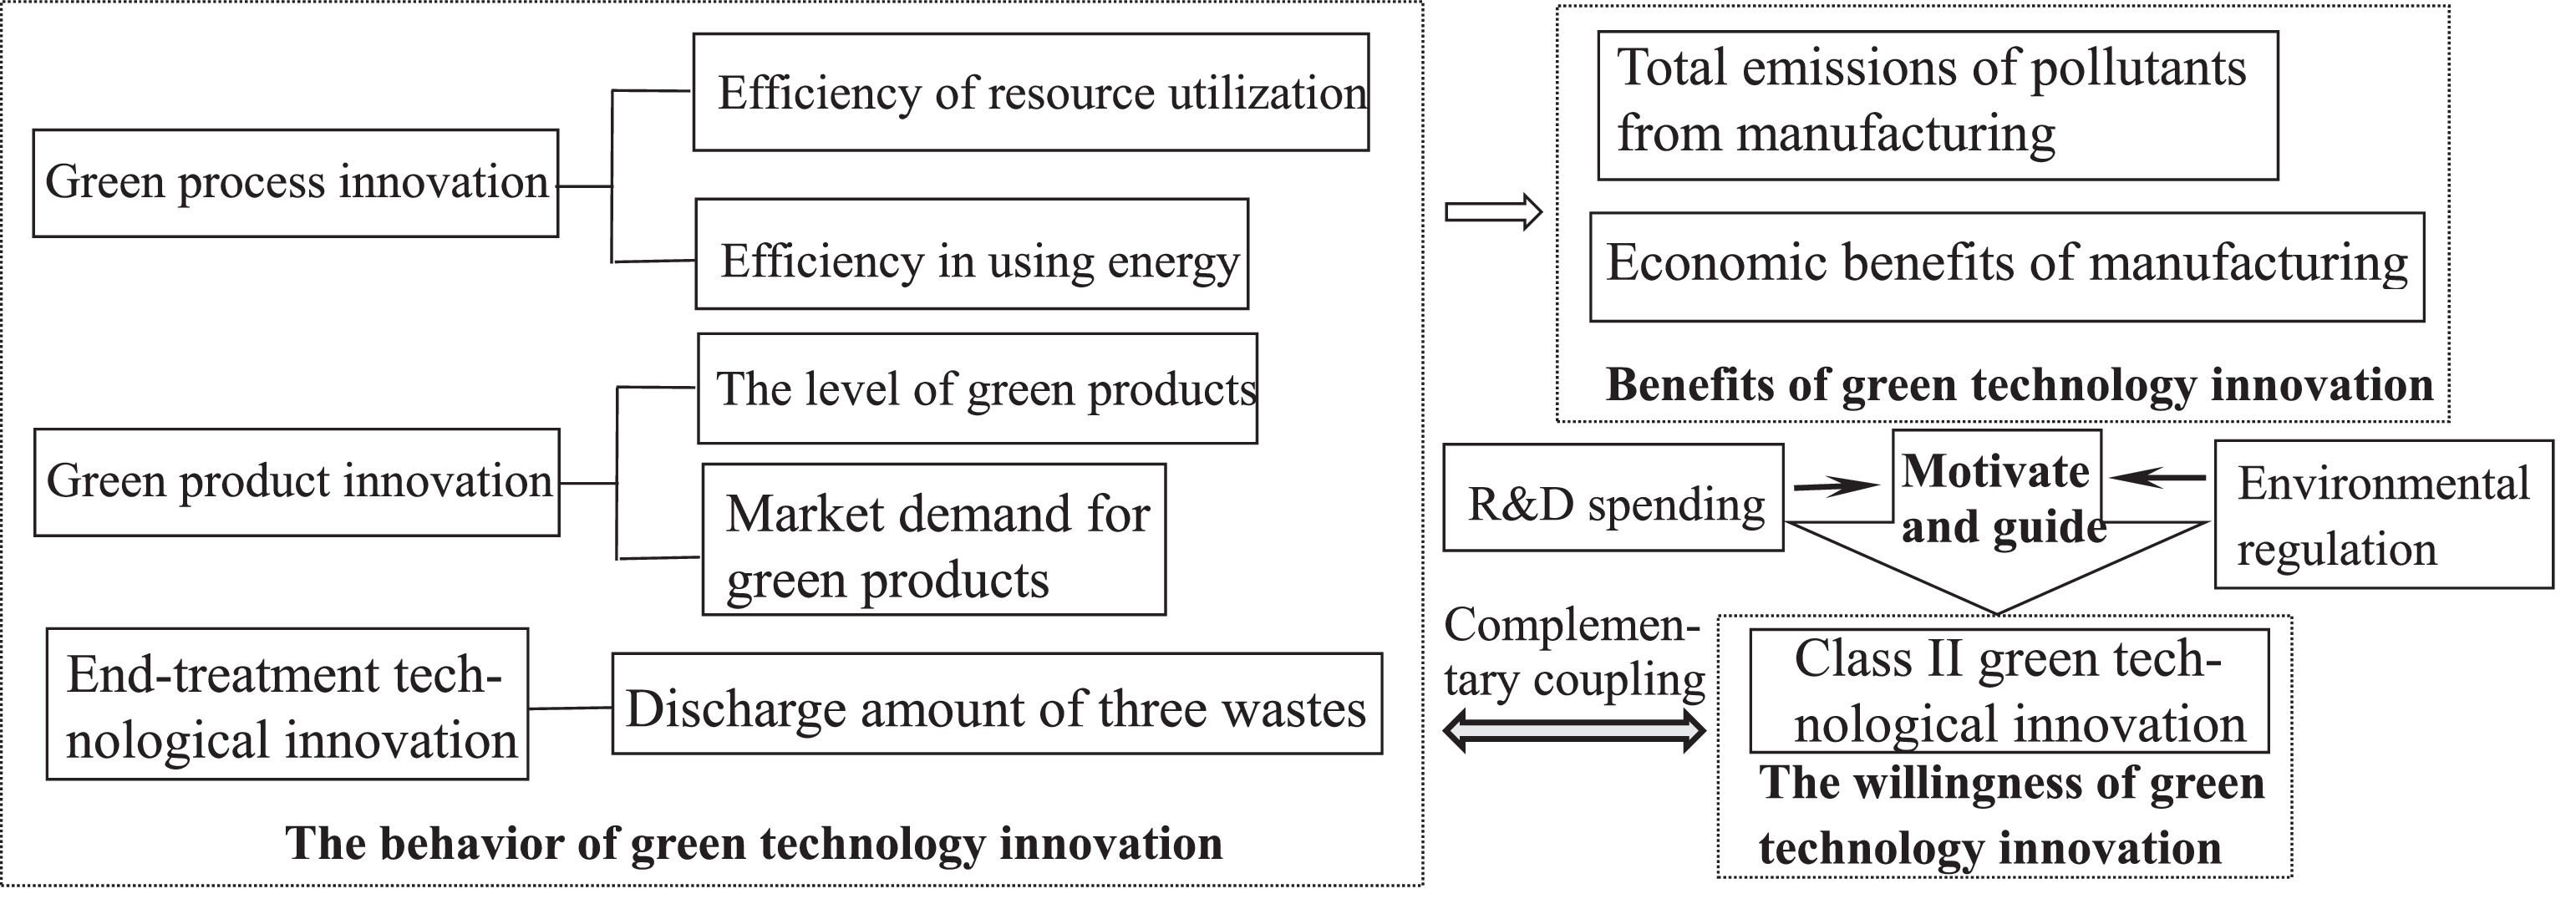
In view of this, green technological innovation will usher changes in economic and environmental benefits, and the subject's environmental awareness will have an important impact on their green technological innovation behaviors. The double externalities of green technology innovation make the consciousness of low-carbon and environmental protection in manufacturing weak, which leads to a lack of internal power in manufacturing industries to take the initiative to carry out the transformation of green technology innovation. It is necessary to stimulate and guide manufacturing industries to enhance the willingness and carry out the transformation of green technological innovation through the environmental regulations of the government, thereby increasing the R&D investment of manufacturing industries and the government (Liu, Zhang, Heather & Yan, 2021; Li, Wang & Wu, 2018). In addition, based on the existing literature, this study divides environmental regulation into command-and-control, market-based incentives, and public participation. The “three simultaneous” environmental investments reflect the input and effect of command-and-control environmental regulation, the systematical implementation of sewage charge which is carried out with the help of market mechanism, and ISO14001-certified enterprises is one of the management standards of public participation environmental regulation (Wang, Li, Lu, Wang, Jiang, & Zhang, 2020; Heras-Saizarbitoria, Boira & Junguitu, 2020). In contrast, the “three simultaneous” environmental protection investment, sewage charge and ISO14001-certified enterprises should be selected to represent the strengths of the above three types of environmental regulation. A conceptual model of the transformation of green technological innovation in manufacturing is shown in Fig. 2.

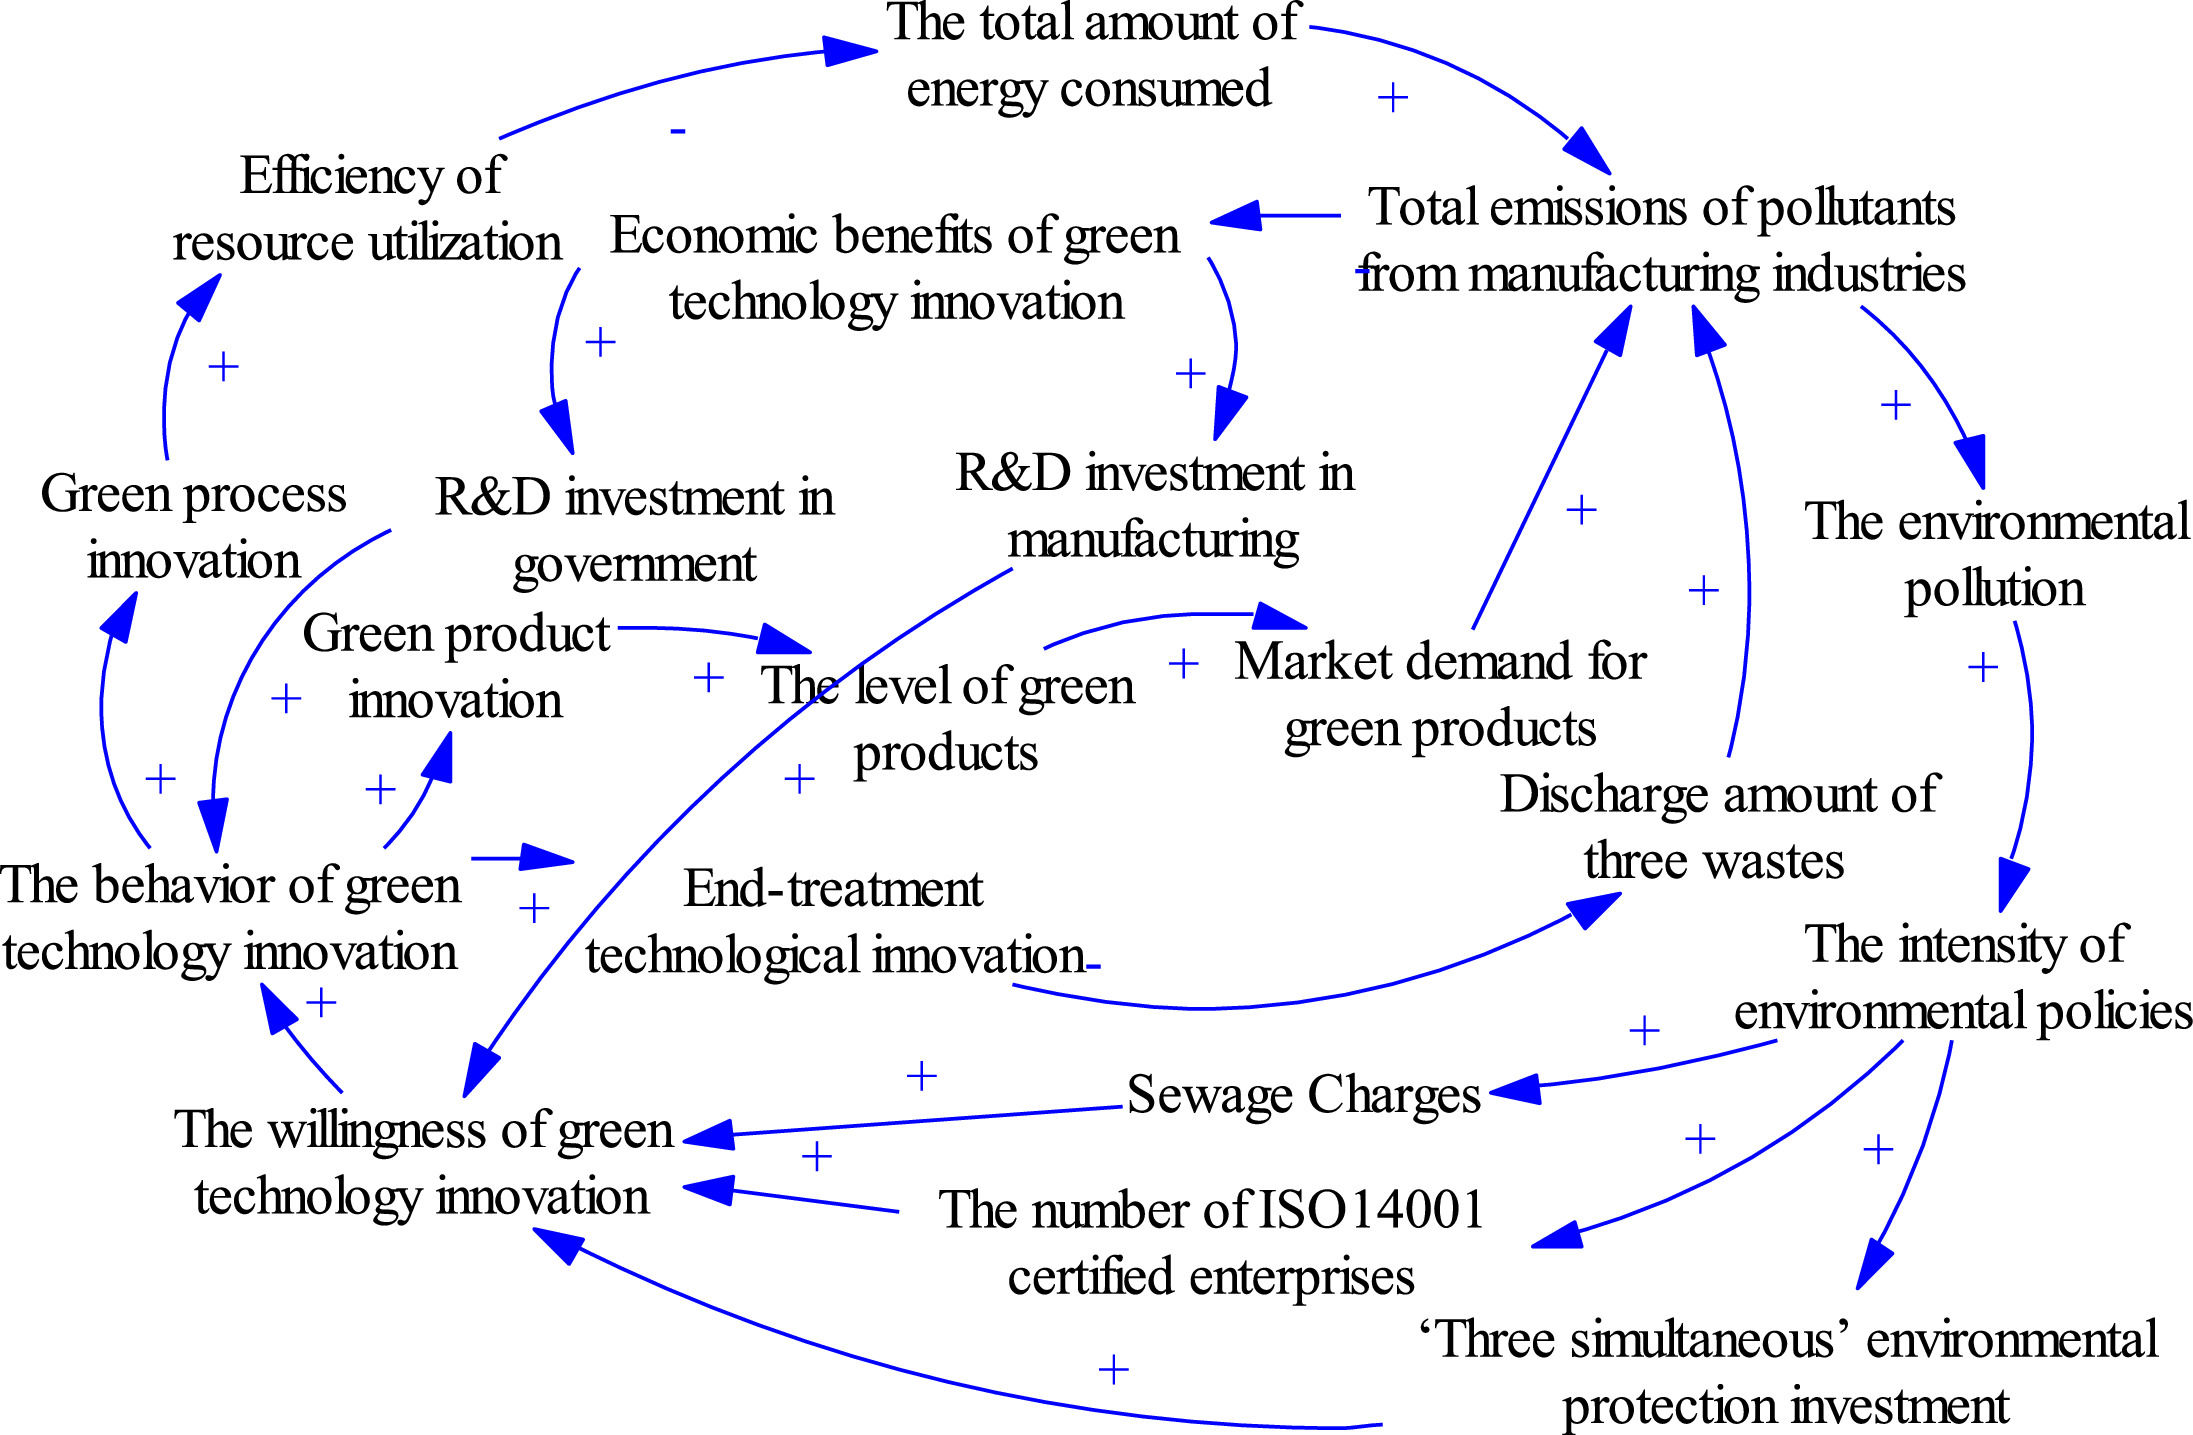
From Fig. 2, according to the coupling principle of behavioral and concept logic (Li, Huang, Ren, Chen & Ning, 2018), behavior produces results. As a result, the government will guide the behavior of green technological innovation in manufacturing industries through environmental regulation, enhance willingness, and influence the new round of behaviors of green technological innovation. Therefore, the feedback path followed by the transformation of green technological innovation in manufacturing industries is the behavior of green technological innovation → benefits of green technological innovation → environmental regulation → the willingness of green technology innovation → the behaviors of green technological innovation. Based on the above analysis, a causal relationship diagram of the system transformation of green technological innovation in manufacturing is established, as shown in Fig. 3.

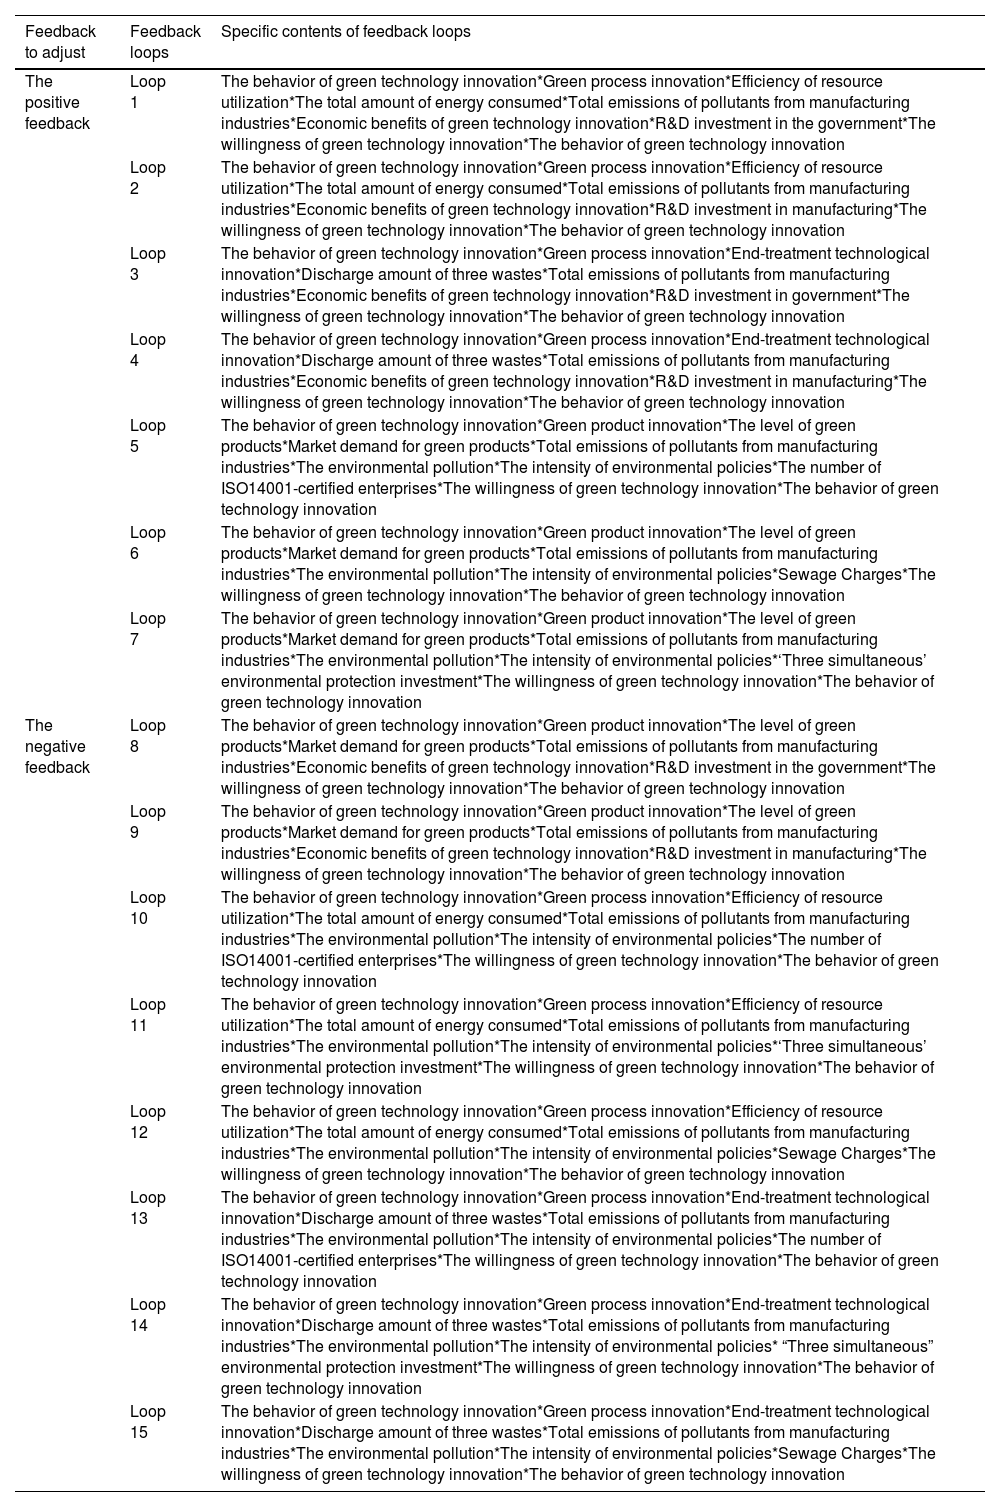
According to the analysis of components of the subsystems of green technology innovation behavior, green technology innovation invention, and innovation benefit in Section 2.1, combined with the causal diagram among variables in the system in Fig. 3, 15 causal feedback loops of the system of transformation of green technology innovation in manufacturing industries were obtained, as shown in Table 2.
Causal feedback loops of the system of green technological innovation in manufacturing industries.
As evident from Table 2, feedback loops 1–7 are positive feedback, and 8–15 are negative feedback. The loops of positive feedback indicate that increased environmental regulations can encourage manufacturing industries to reduce energy consumption, reduce pollutant emissions, improve the economic benefits of green technology innovation, and enhance its transformation to Class II green technology innovation to achieve a virtuous cycle through green products, processes, and end-treatment technology innovation. In contrast, the negative feedback loops indicate that strict environmental regulations increase the cost of pollution control in manufacturing industries, negatively affect the economic benefits of green technological innovation, and inhibit its transformation to Class II green technological innovation. Therefore, the intensity of the environmental regulations implemented by the government should be strictly controlled.
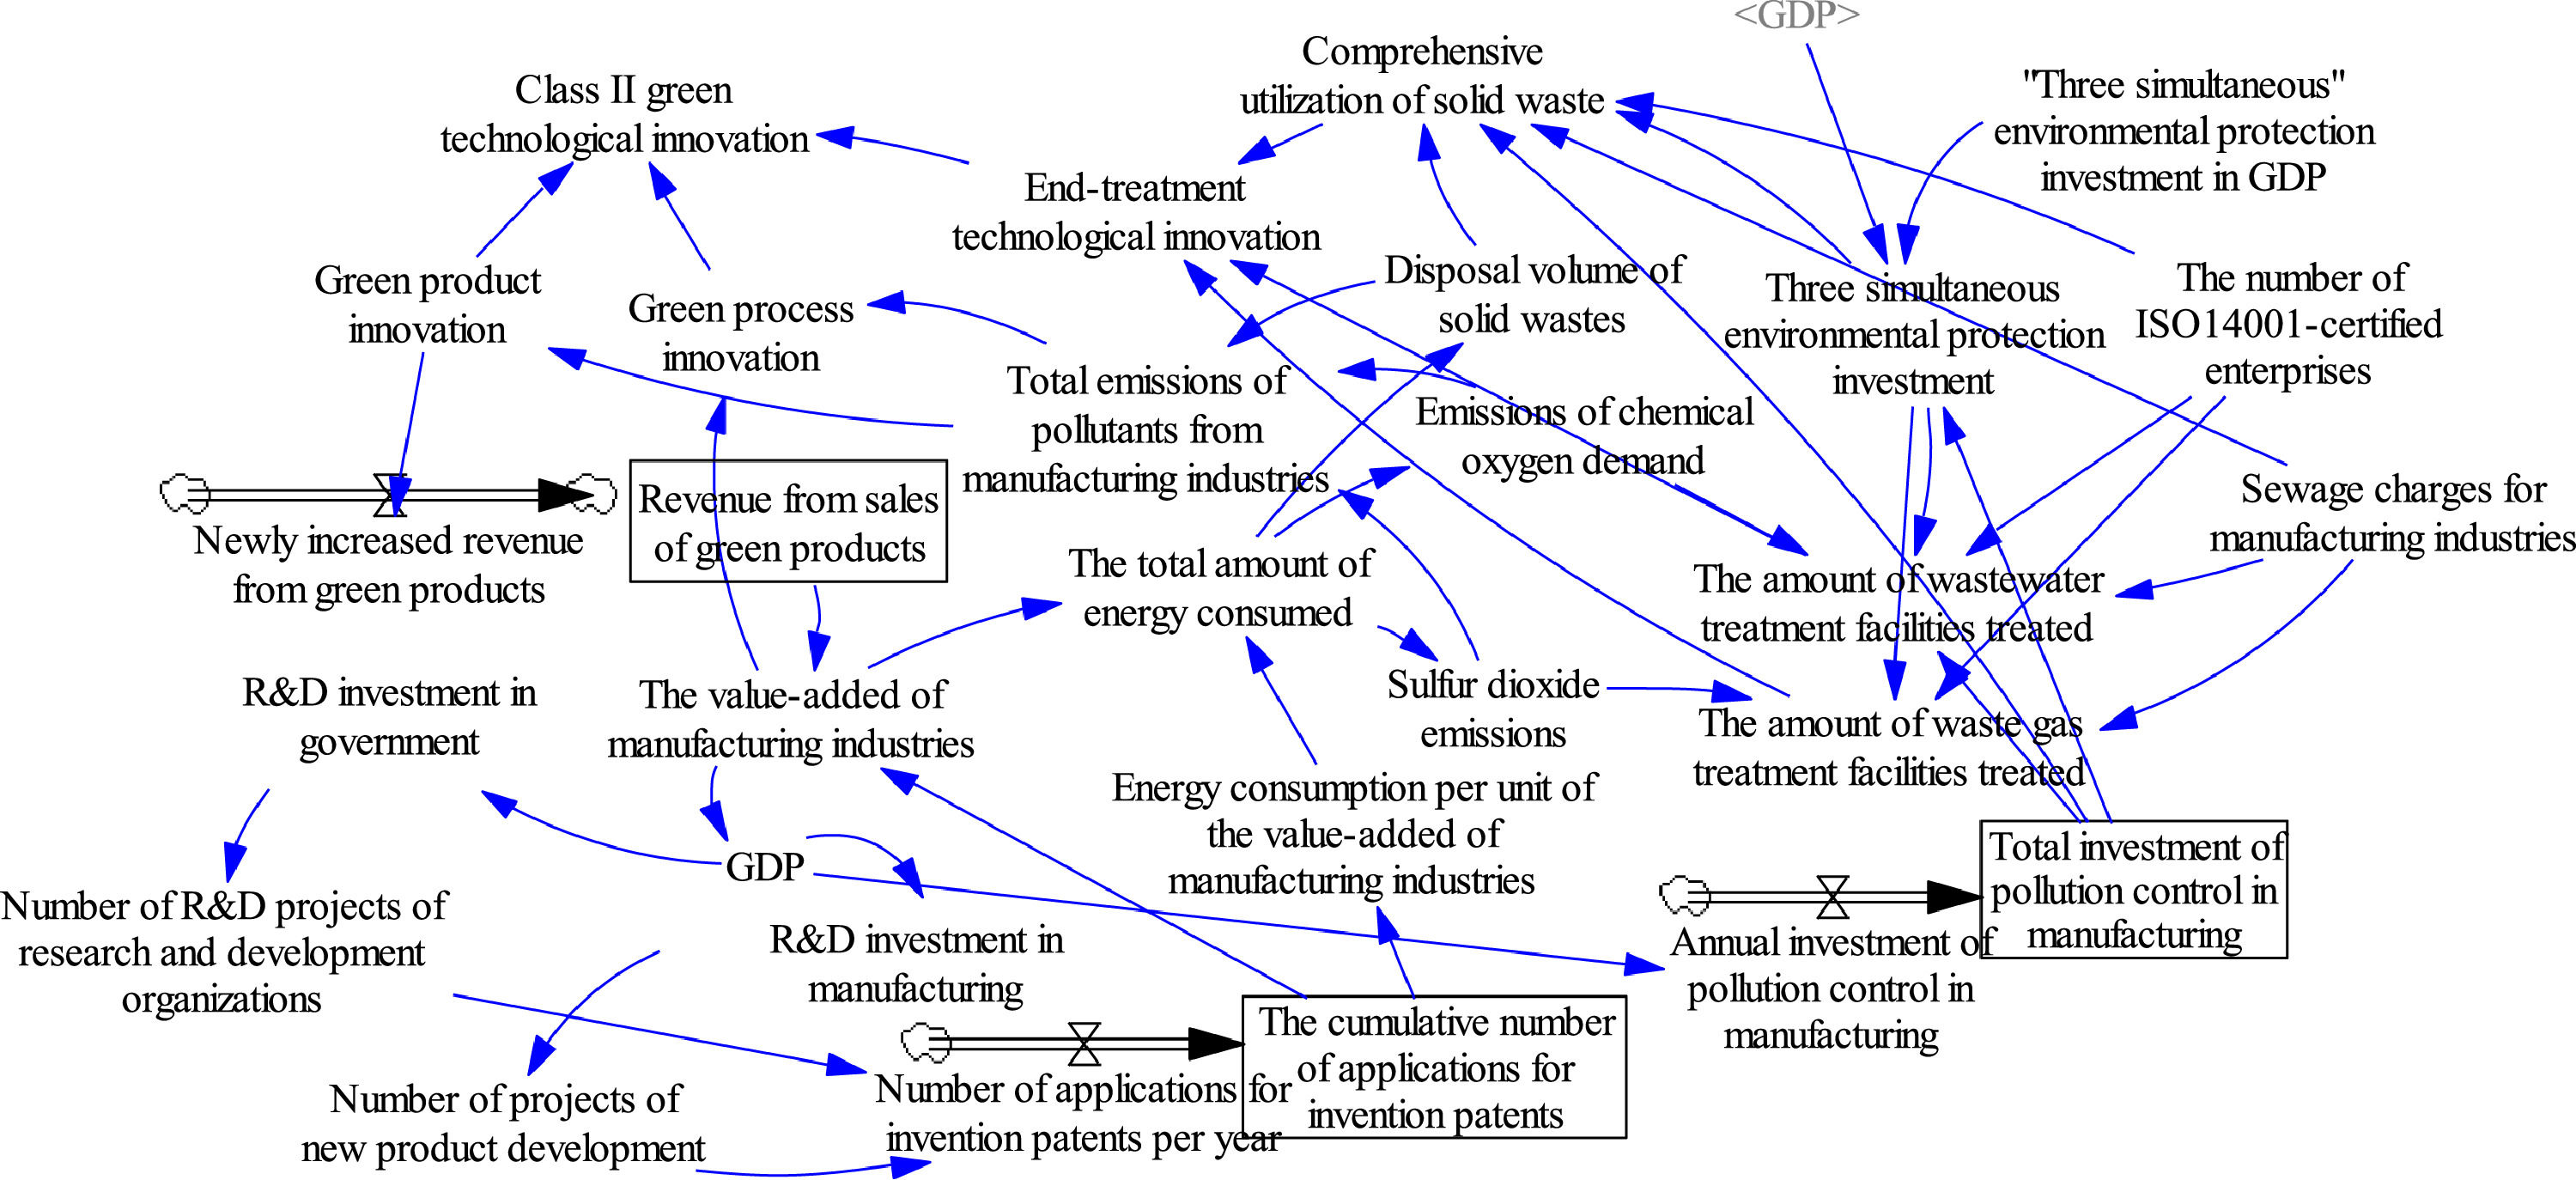
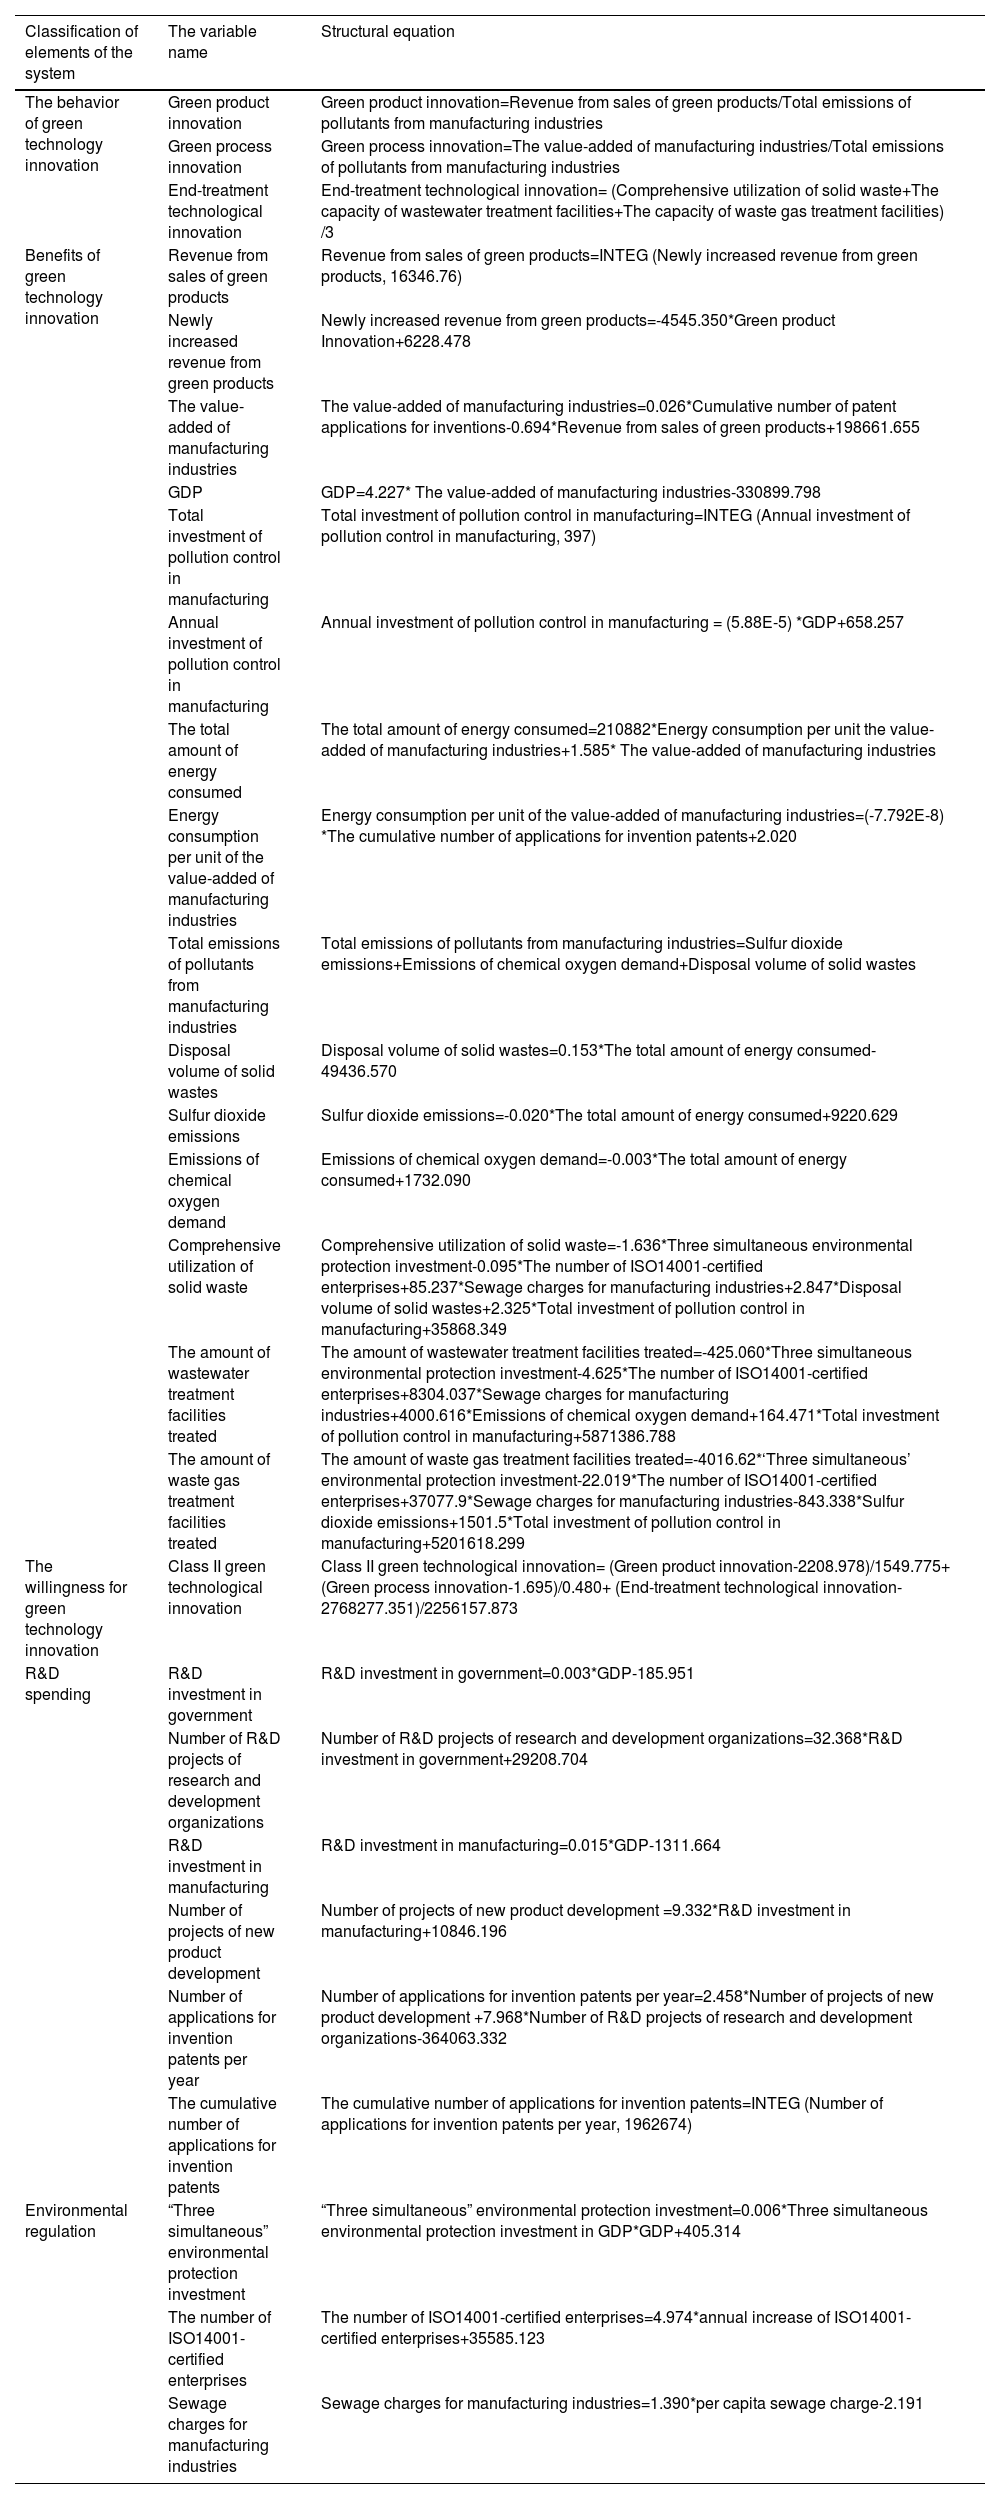
System traffic diagramWhen studying the impact of environmental regulation on green technological innovation in manufacturing industries, the system causality diagram can only qualitatively describe the feedback relationship among indicators. In contrast, the a system flow diagram can simulate the elements in the system by constructing the functional relationship between variables. The elements of each subsystem are determined by considering the functional relationship between each subsystem, the realistic availability of the corresponding data of each element in the system, and by referring to various statistical alignments for China, as shown in Table 3.
Elements of the system of transformation of green technological innovation in manufacturing.
According to the interaction between system elements, these elements are inputs into the Vensim software and expressed by state variables, auxiliary variables, constants, and exogenous variables to draw the system traffic diagram of green technological innovation in manufacturing industries, as shown in Fig. 4.
Running and simulation of system dynamic modelThe source of data
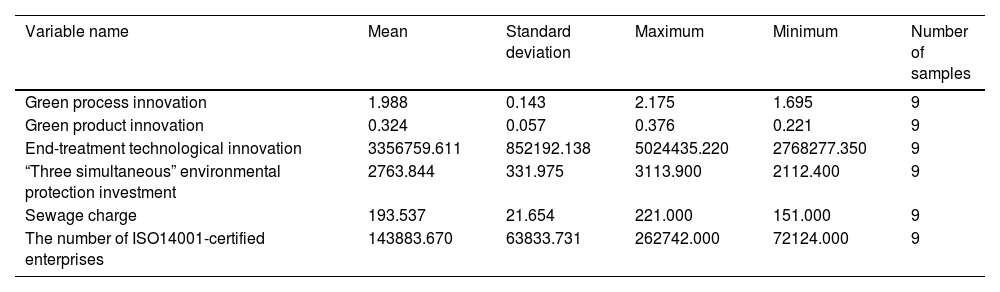
This study considers China's manufacturing industry as its research object, and the statistical scope of the research data is subject to China. The data sources and methods are as follows: data on manufacturing and government are from the China Statistical Yearbook of Science and Technology; environmental data are from the China Statistical Yearbook of Environment; and other data are mainly from the China Environmental Yearbook, China Statistical Yearbook, and China Statistical Yearbook of Energy. The initial data on China's manufacturing industries in 2010 are as follows: the sales revenue of green products was 1,634.676 billion yuan, the number of invention patent applications was 1,962,674, and the total investment in pollution control was 39.7 billion yuan. In addition, the ISO14001-certified enterprise data was obtained from the Chinese Regulatory Commission. The statistical caliber of some variables changed after 2011, and the statistical variables after 2020 did not completely correspond. To ensure the authenticity and reliability of the model's simulation results, this study selected the data of each variable in the system flow graph from 2011 to 2019 as the basis. It simulated the development trend of the manufacturing industry's green technology innovation transformation system from 2020 to 2030. The descriptive statistics for the main variables from 2011 to 2019 are shown in Table 4.
Descriptive statistics of main variables from 2011 to 2019.
The premise of SD model operation is to determine the structural equations of the variables in the system traffic diagram. Simultaneously, the relationship equation between the variables was determined based on the statistical data of the variables from 2011 to 2019. Therefore, this study used SPSS statistical software to conduct linear and nonlinear regression analysis and finally determined the structural equation of the SD model, as shown in Table 5.
Structural equations of systematic variables.
Verification can be used to verify the degree of fit of a model and determine its reliability. This study mainly adopts the inspection method of historical data to verify the validity and accuracy of the model by comparing the difference between the output of the simulated value by system dynamic system and historical data. When the relative error between the simulated and actual values was within 15%, the fit of the model was considered significant. Within 10%, the fit was considered distinct.
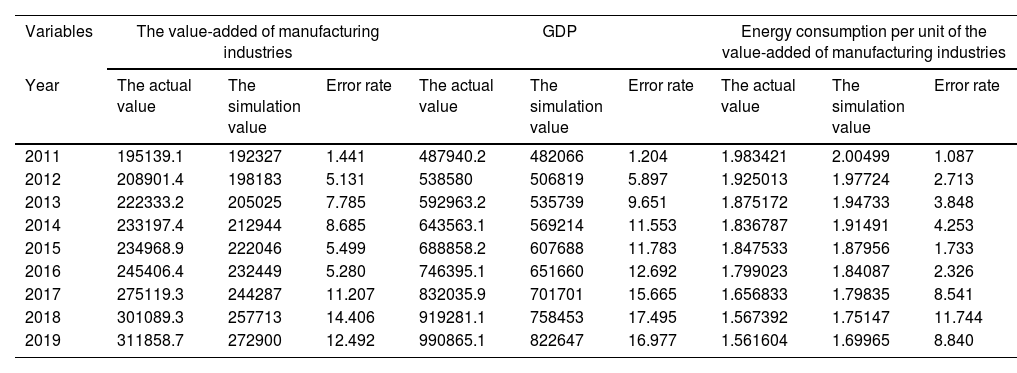
According to the SD model of manufacturing green technology innovation established above, Vensim software was used to test the historical data of the main variables in the model. For example, consider atake the Time Step=1 year, the initial time is 2011, and the final time is 2019. The test results for the historical data are presented in Table 6.
Results of checking the historical values of some variables.
As shown in Table 6, the simulated values of manufacturing value-added, GDP, and energy consumption per unit of manufacturing value-added were consistent with the actual values. By calculating the error rate of each index, it can be observed that the degree of fit of the data is high, indicating that the simulation results of this model are reasonable and effective. The error range of the manufacturing value-added from 2011 to 2019 was 1.441% to 14.406%, with an average error rate of 7.193%. The error in the GDP ranged from 1.204% to 17.495%, with an average error rate of 10.292%. Finally, the error range of the energy consumption per unit of manufacturing value added was 1.087% to 11.744%, and the average absolute error was 4.509%.
Model simulation analysisBased on the system flow diagram, through a validity test of the model, this study selects the proportion of “three simultaneous” environmental protection investments in GDP, per capita sewage charge, and an annual increase of ISO14001-certified enterprises to represent the intensity of the three types of environmental regulation as the adjusting parameters to indicate its intensity. By setting the model's initial state, the impact of green technological innovation transformation on the manufacturing industry's economic, social, and environmental performance was simulated.
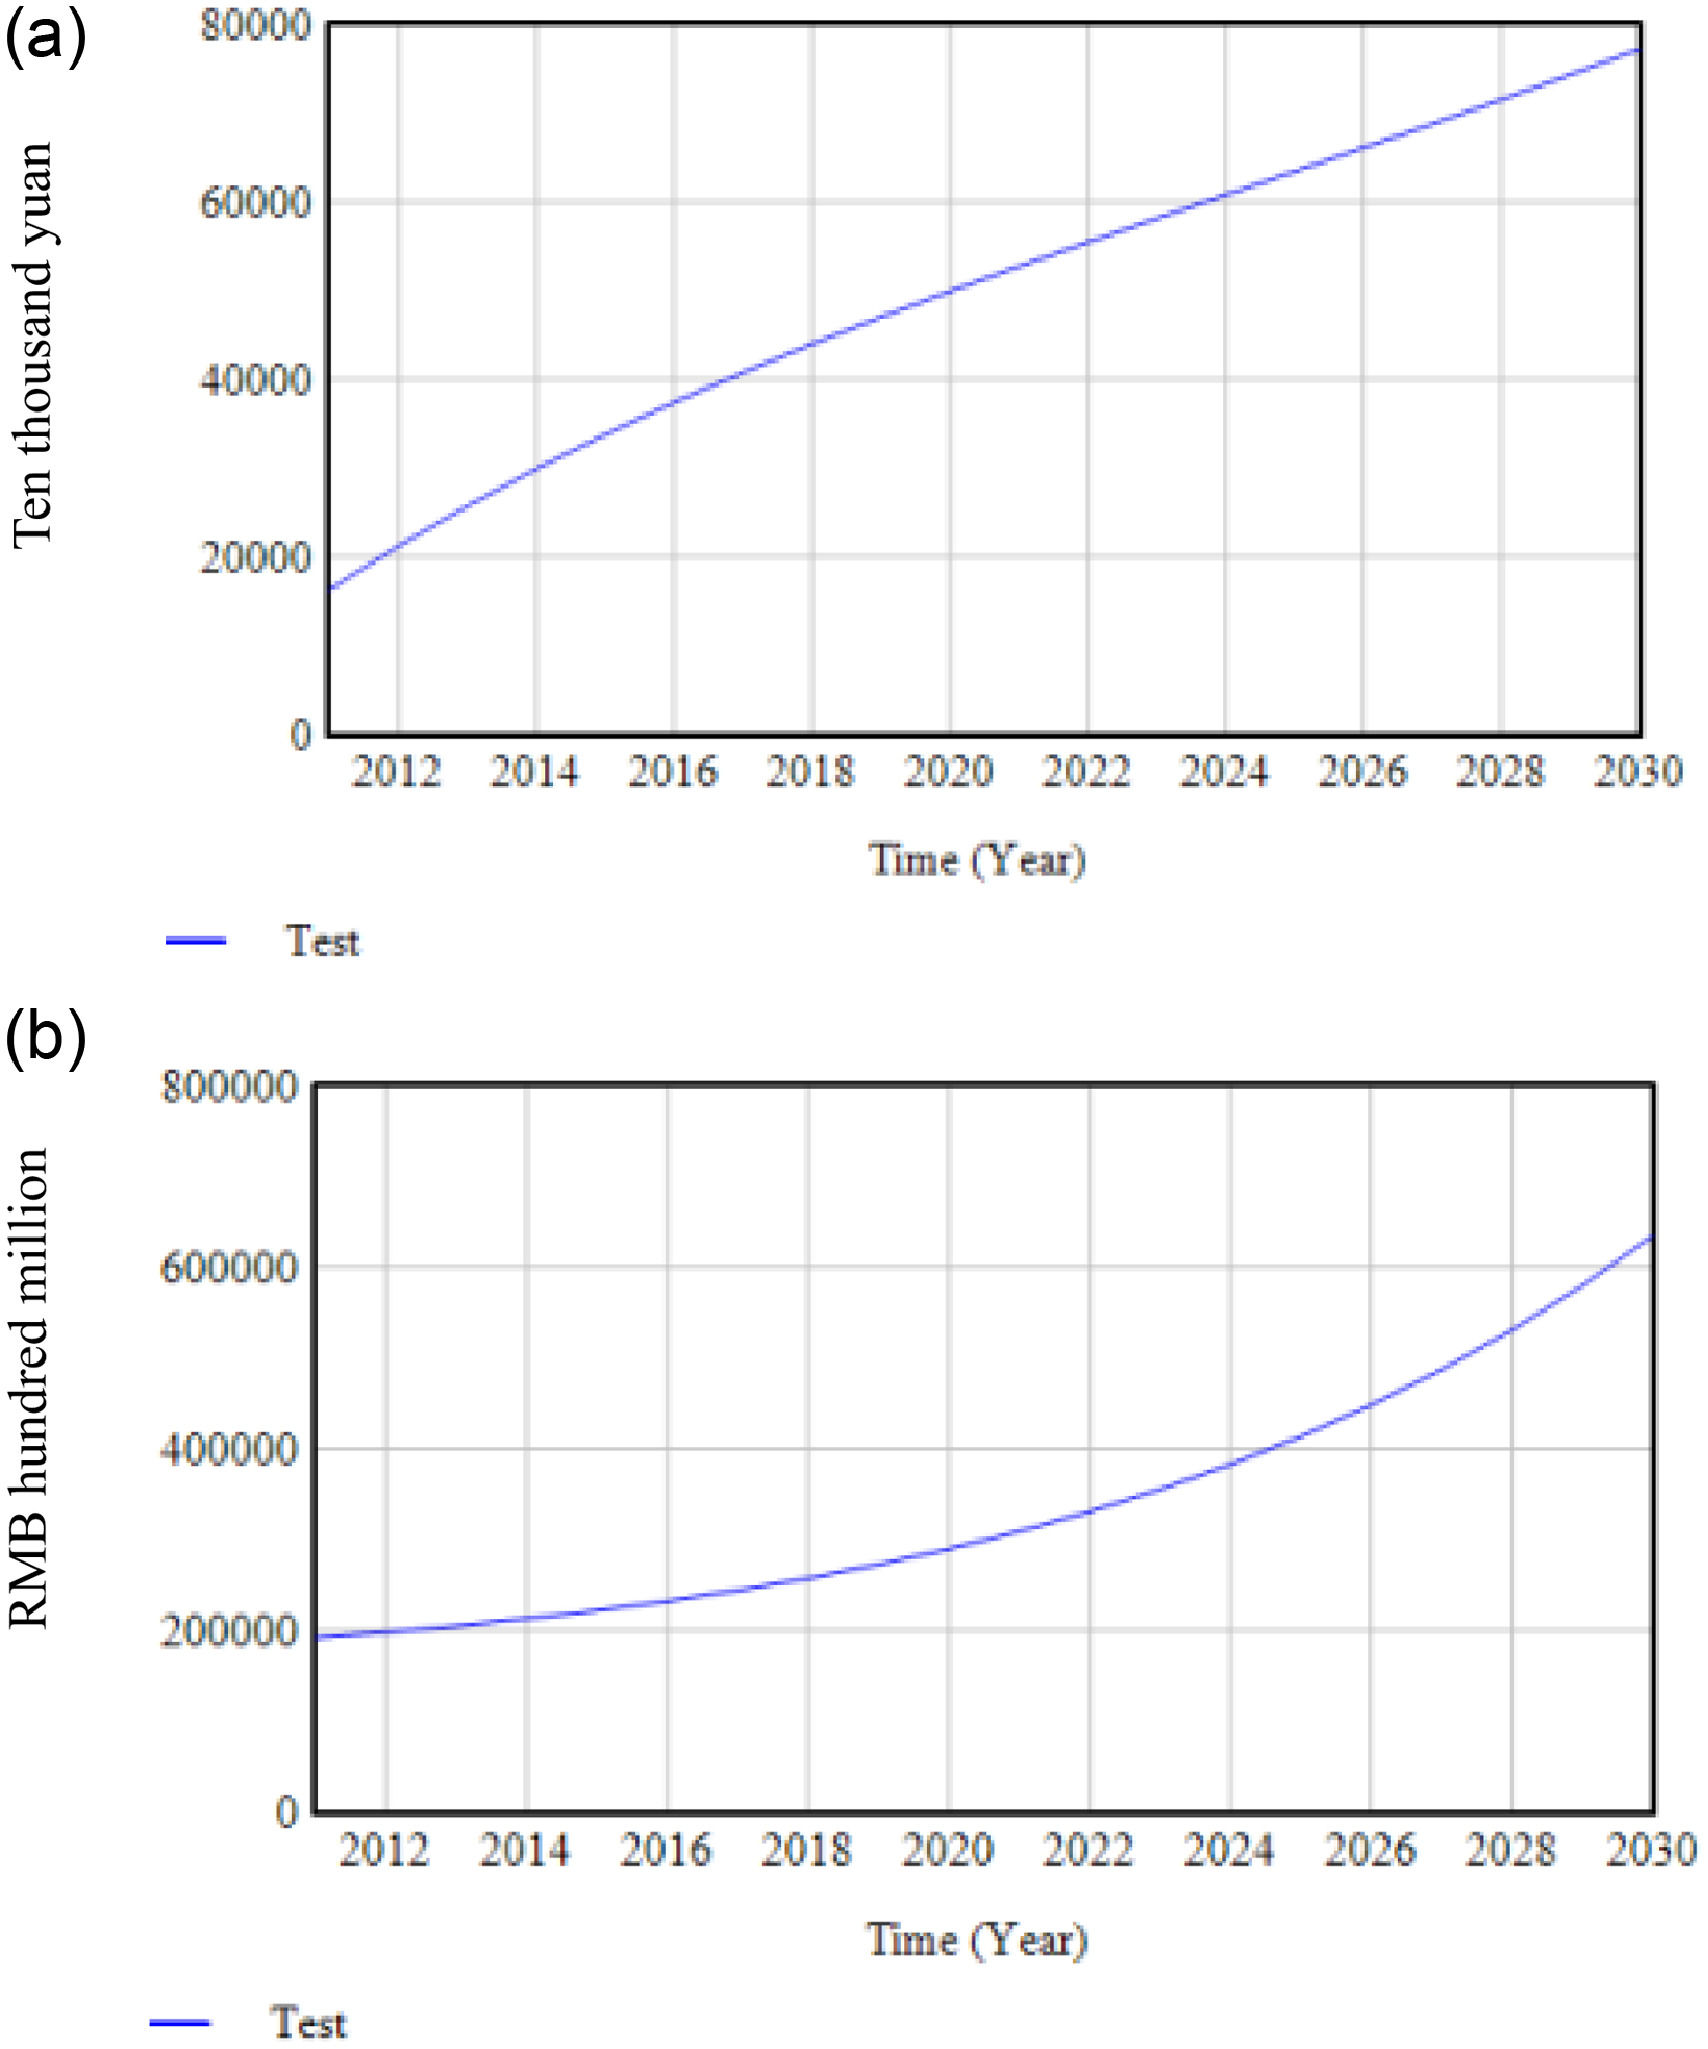
Economic performanceFig. 5 shows that manufacturing industries, through the transformation of green technological innovation, increase the sales income of green products, promote the value-added of manufacturing industries, and improve their economic performance.

This is because command-control environmental regulations through administrative means force manufacturing industries to develop green products. In contrast, market-based incentive environmental regulation through the R&D of green subsidies to reduce manufacturing costs improves the efficiency of R&D. Simultaneously, public participation in environmental regulation encourages the public to set up concepts of green consumption by purchasing behavior affecting the environmental performance of manufacturing to promote the transformation of green technology innovation in manufacturing industries. Therefore, manufacturing should change the original mode of production and develop new business models through green marketing and transfer patents for environmentally friendly products. Simultaneously, they constantly improve the level of green technology innovation, carry out intelligent processes, produce competitive green products, gain market share, improve the economic benefits of manufacturing industries, and achieve long-term profits.
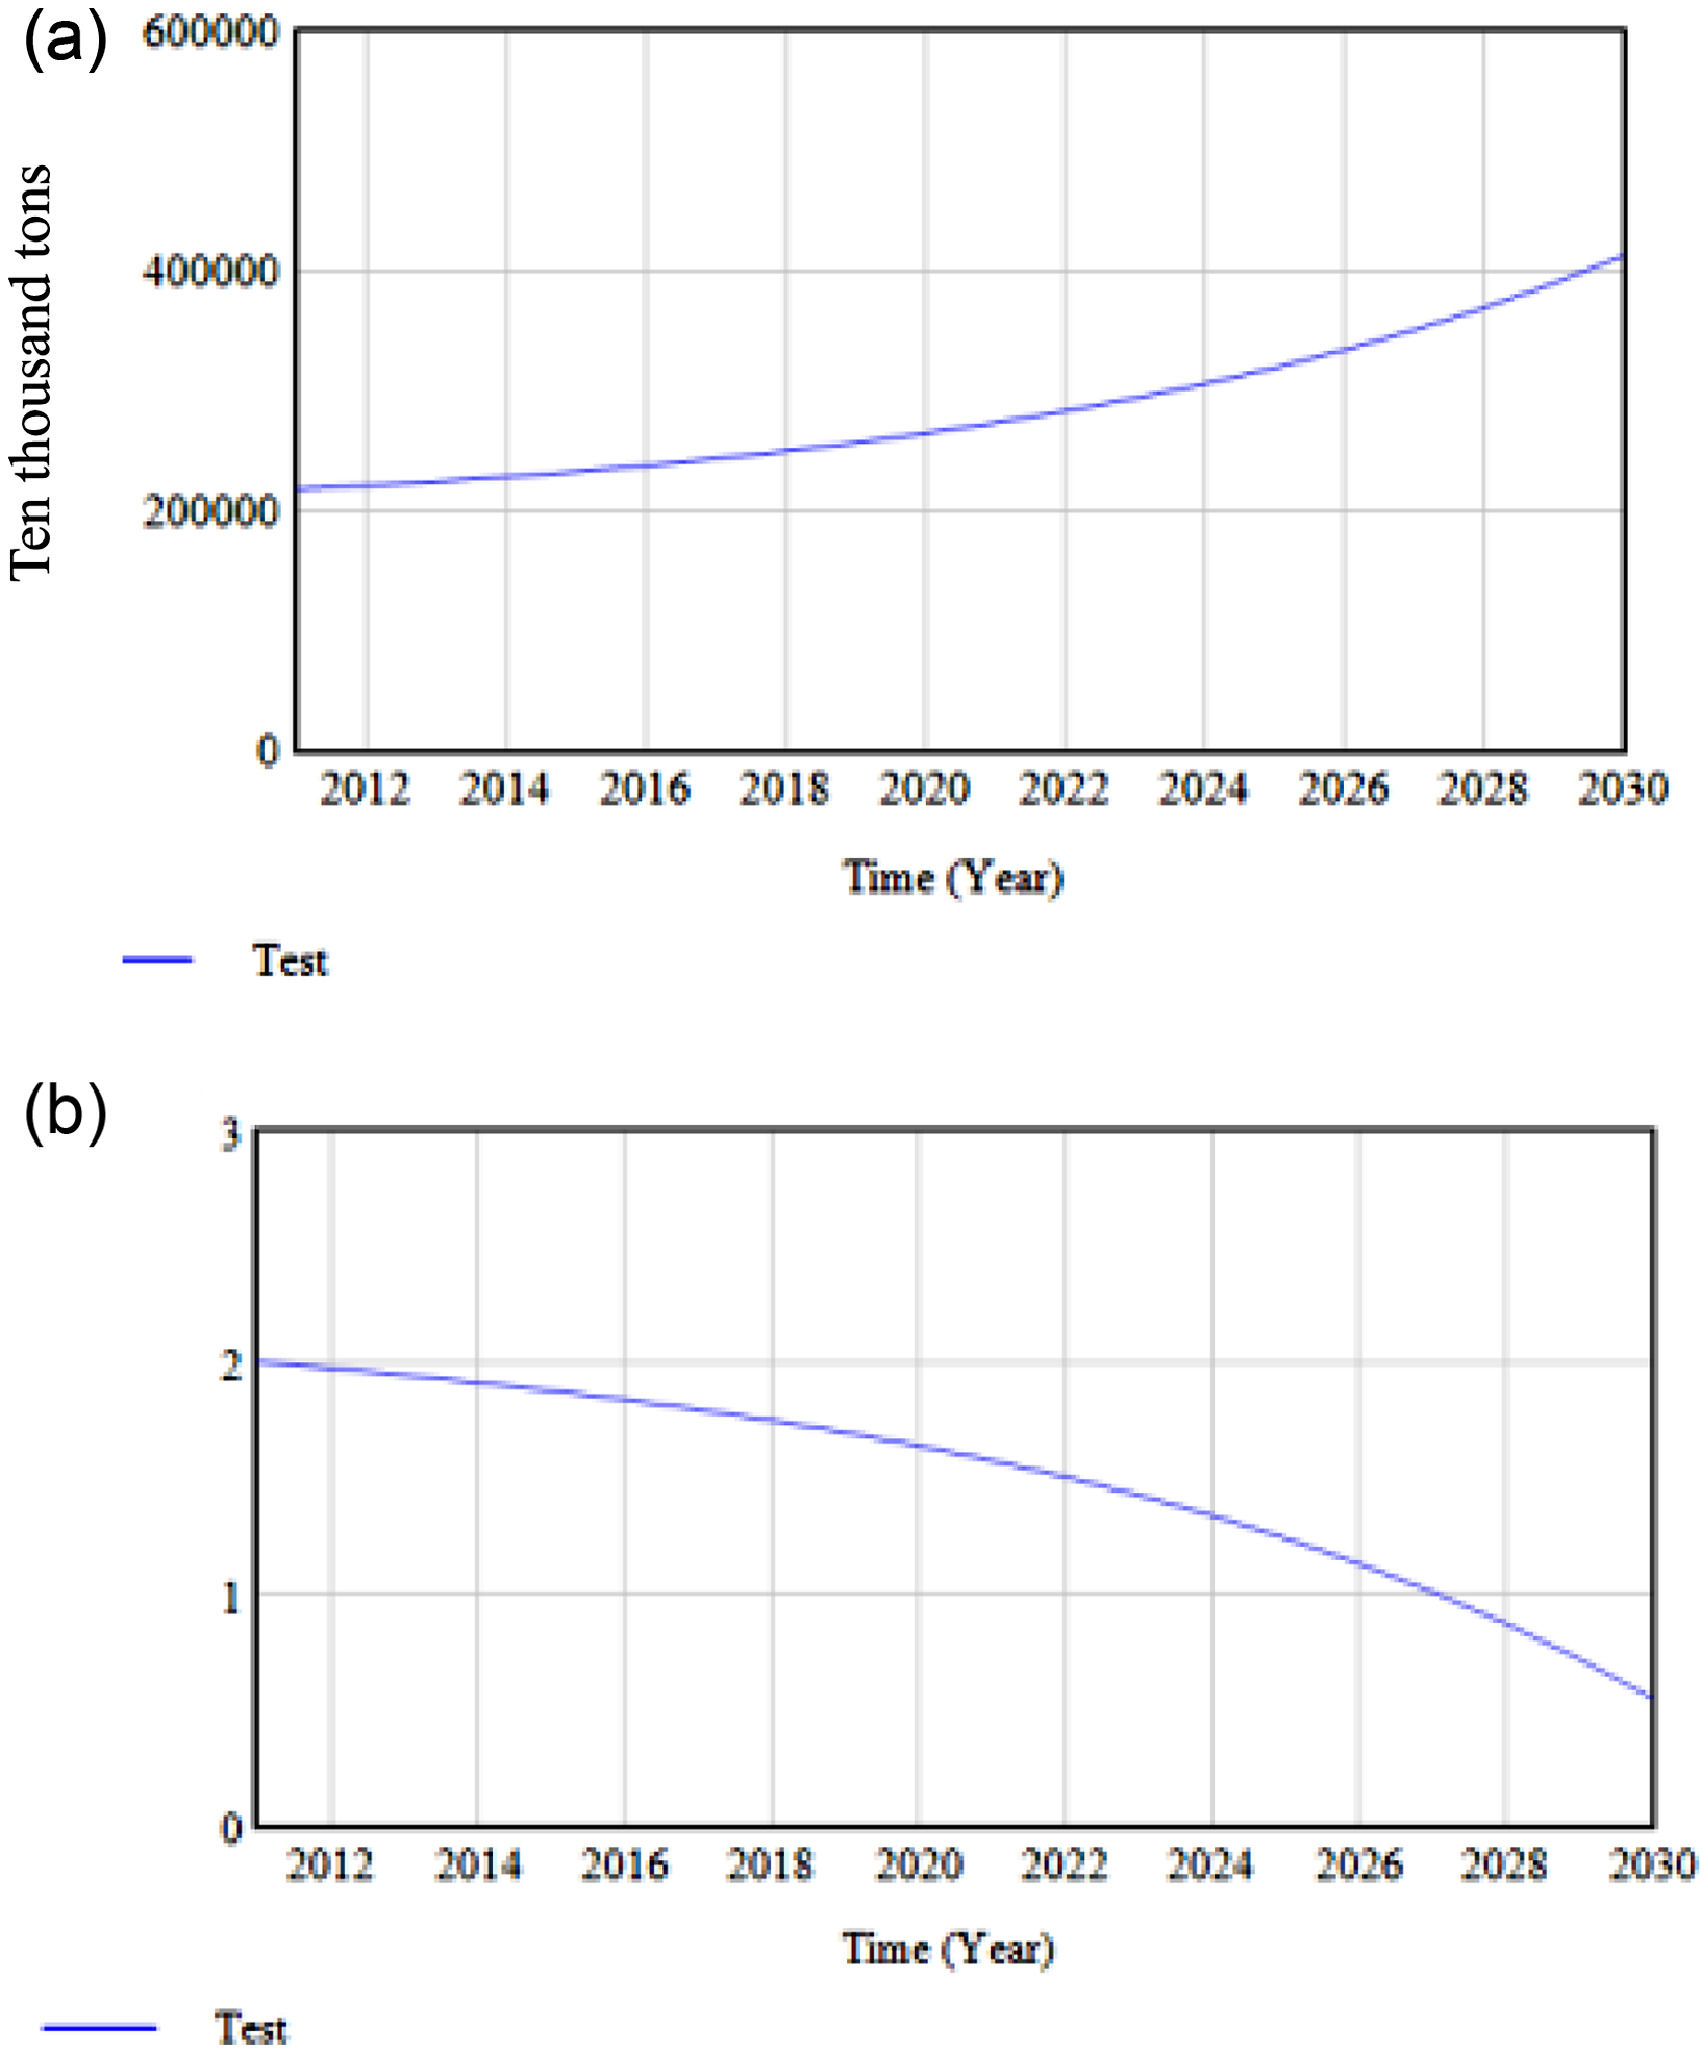
Environmental performanceAs shown in Fig. 6, the environmental performance of manufacturing industries has improved through the transformation of green technology innovation, the comprehensive utilization of solid waste has been promoted, and the energy consumption of manufacturing industries has been reduced.

This is because command-and-control environmental regulations force manufacturing industries to change the traditionally extensive production process, improve green technology innovation, and achieve green development. Guided by the market, the government plays the regulatory role of market-based environmental regulation through environmental taxes and the collection of sewage charges. It encourages manufacturing industries to increase investment in the research and development of green technology and actively transition to Class II green technology innovation. Public participation in environmental regulation can fully mobilize the public's enthusiasm to participate in environmental protection and voluntarily carry out green technological innovation, thus reducing the discharge of pollutants such as wastewater, waste gas, and waste solids and improving the ecological environment. Therefore, manufacturing industries should strengthen the application of green technology in production processes, rationally allocate existing resources, and reduce resource consumption. Simultaneously, the government should improve the tax collection system, strictly supervise the controlling behavior of pollution in manufacturing industries, and strengthen the public's concept of environmental protection through public service advertisements and movies to promote the transformation of green technology innovation in the manufacturing industry and achieve sustainable development.
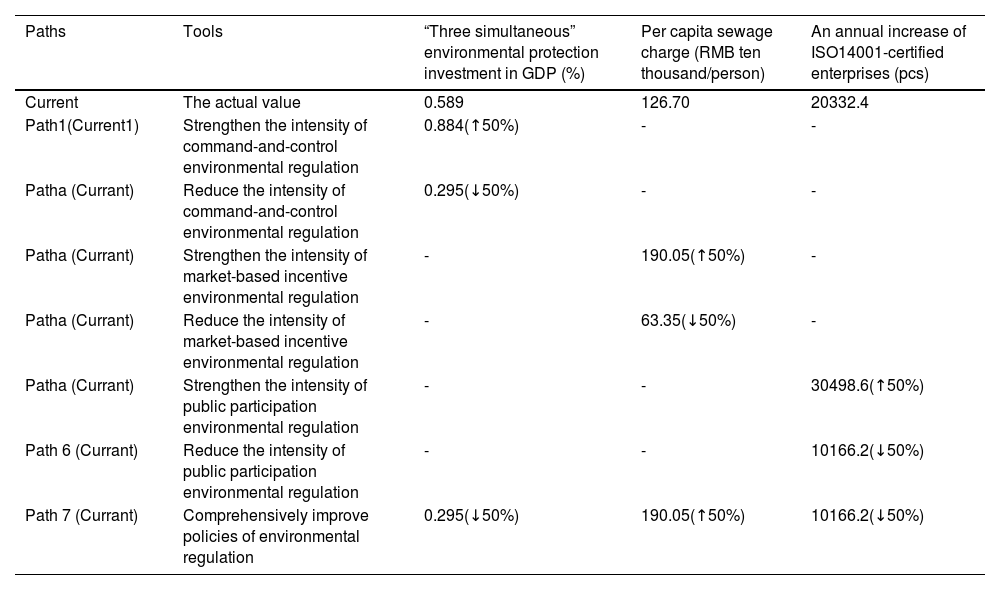
Unlocking paths of the transformation of green technology innovation in manufacturing industriesDesigning concepts of unlocking pathsThis study conducts a scenario design on the intensity of environmental regulation, as shown in Table 7, and effectively evaluates the impact of the seven paths of environmental regulation on the transformation of green technological innovation in manufacturing industries through Vensim.
Path design and parameter adjustment.
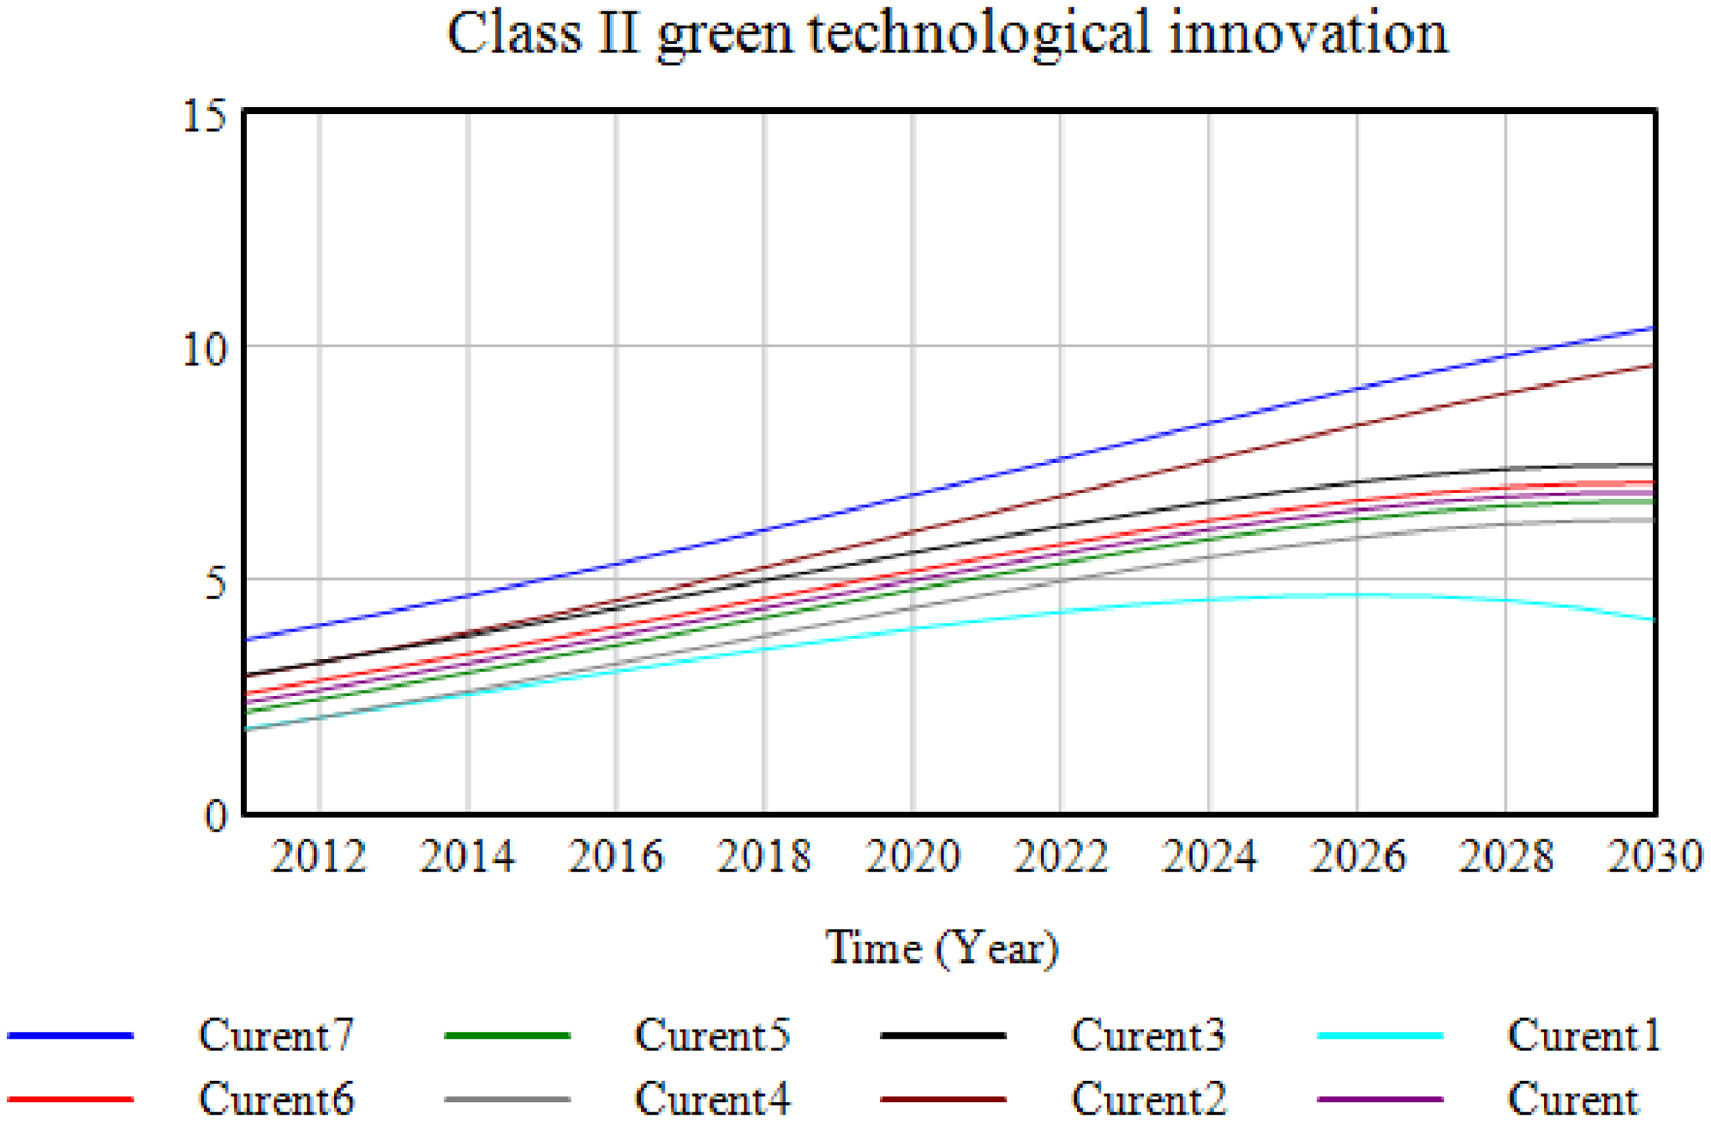
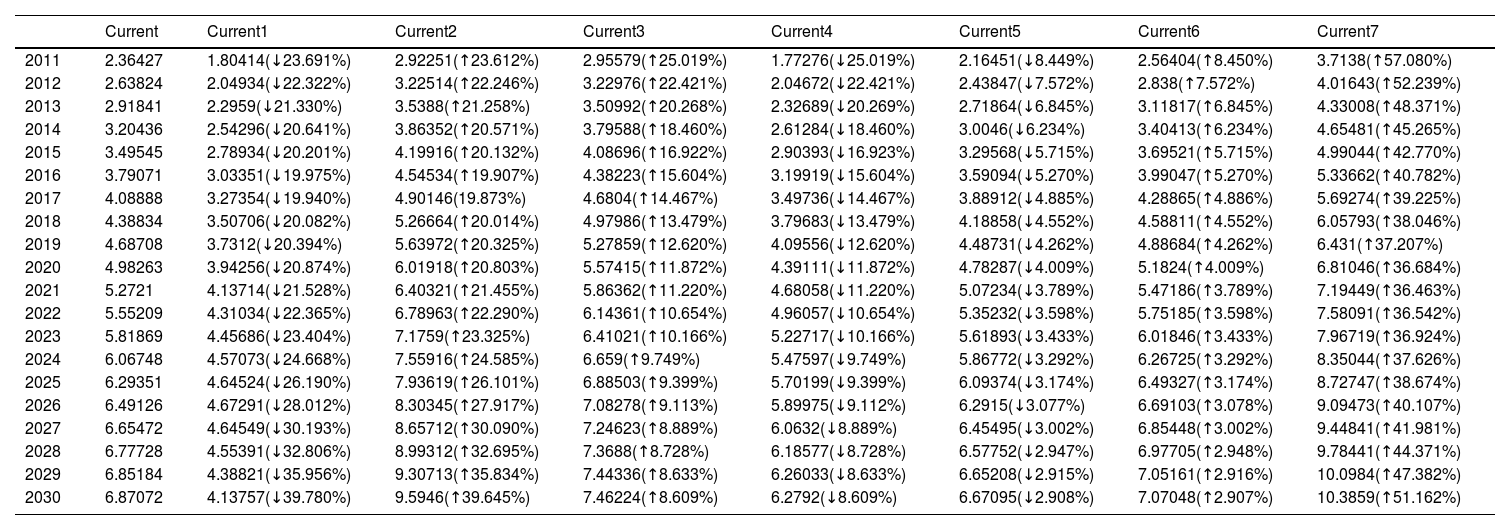
According to the seven proposed simulation paths, a systematic model of green technological innovation in manufacturing was simulated. The optimal paths to unlock the dilemma of the transformation of green technological innovation in manufacturing were effectively evaluated using the Vensim software. Based on the statistical data of China's manufacturing industry from 2011 to 2019, this study simulated the system's operation from 2020 to 2030 and finally determined the overall time range of the SD model from 2011 to –2030. The results for the seven unlocked paths are shown in Fig, 7. The current model was set as the control group for the experiment, and the comparison results with the seven paths are shown in Table 8.
Change of Class II green technological innovation in manufacturing industries from 2011 to 2030.
Comparing the simulation results of Currents 1 and 2 in Fig. 7, it is found that increasing the proportion of environmental investment in the three phases inhibits the transformation of manufacturing industries to Class II green technological innovation, and the inhibition effect becomes more significant over time.

An increase in investment in environmental protection will increase the costs of controlling pollution in manufacturing industries, increase the R&D costs of manufacturing industries, and reduce R&D efficiency. Therefore, the high-intensity command-and-control environmental regulation makes the manufacturing industries incur heavy costs due to pollution treatment, making it difficult to produce the “innovation compensation effect” on the manufacturing industries, which is not conducive to the transformation of green technological innovation in the manufacturing industries.
Conclusion 1: Appropriately reducing the intensity of command-and-control environmental regulations promotes the transformation of manufacturing industries into Class II green technological innovation.
Path 2: Adopt the high-intensity market-based incentive environmental regulationBy comparing the simulation results of Currents 3 and 4 in Fig. 7, it is found that increasing the per capita sewage charge will promote the transformation of manufacturing industries to Class II green technological innovation, and high-intensity market-based incentive environmental regulation from 2011 to 2019 will significantly improve the transformation of green technological innovation in manufacturing industries. From 2020 to 2030, the strengthening of market-based incentive environmental regulations will continue to gradually accelerate the transformation rate.
This is because increasing the per-capita sewage charge can effectively improve the ecological environment and increase the emission costs of the manufacturing industry. However, a market-oriented government can effectively resolve the external spillover of green technological innovation in manufacturing industries through sewage charges, government subsidies, and environmental taxes, thus reducing the risks of R&D of green technological innovation in manufacturing industries and guiding their pollution emissions. Moreover, compared to command-and-control environmental regulation, market-based incentive environmental regulation has a stronger effect on innovation compensation in manufacturing industries, compensating for the cost-effectiveness of green technological innovation in manufacturing industries. When the intensity of market-based environmental regulations reaches a certain level, the impact on the transformation of green technological innovation in the manufacturing industry tends to be stable and constantly promotes the transformation of manufacturing industries to Class II green technological innovation.
Conclusion 2: High-intensity market-oriented environmental regulation promotes transforming the manufacturing industry into Class II green technological innovation.
Path 3: Actively stimulate public participation in environmental regulationComparing the simulation results of Currents 5 and 6 in Fig. 7, it is found that increasing the annual increase in ISO14001-certified enterprises will inhibit the transformation of the manufacturing industry to Class II green technological innovation.
As shown in Table 5 and Fig. 7, a significant increase in the number of ISO14001-certified enterprises has no significant effect on the transformation of green technological innovation in the manufacturing industry. This is because ISO14001 certification is for all enterprises to develop a unified environmental management model; although it effectively solves the shortcomings of the weak link of government regulation, its implementation depends on the supervision of third-party testing institutions and voluntary action of the manufacturing industry. Therefore, the manufacturing industry is not guaranteed to always meet international certification standards, which require conscious compliance. This leads to the problem of “free riding,” such as actively joining the environmental protection system but not taking responsibility for environmental protection. However, public participation in environmental regulation enables the manufacturing industries to flexibly formulate and implement pollution control measures in line with the development of the manufacturing industries to strengthen the cooperation between the government and the industry. Therefore, public participation in environmental regulations should be actively encouraged to promote the transformation of manufacturing industries into Class II green technological innovations.
Conclusion 3: Voluntary environmental regulations have little influence on the manufacturing industry's transformation to Class II green technological innovation.
Path 4: Comprehensive application of three environmental regulationComprehensively comparing the simulation results of the above 7 scenario modes, Current 7 had the most significant promoting effect on the transformation of green technological innovation in manufacturing industries. Current 7 also adjusts the parameters of three environmental regulation policies, including moderately reducing the proportion of “three simultaneous” environmental protection investment and the annual increase of ISO14001-certified enterprises, increasing the per capita sewage charge, and accelerating the transformation rate of the manufacturing industries to Class II green technological innovation. Due to the dual externalities of green technological innovation, a single environmental regulation policy cannot fully simulate the behavior of green technological innovation in the manufacturing industry. Therefore, governments should adopt a combination of environmental regulatory policies.
Conclusion 4: Reducing command and control, increasing market-based incentives, and reducing the intensity of public participation in environmental regulation will promote transforming the manufacturing industry into a Class II green technological innovation.
In conclusion, comparing the seven paths show that the parallel development of command-and-control, market-based incentives, and public participation environmental regulations has the most significant promoting effect on the transformation of green technological innovation in manufacturing industries. Therefore, the optimal path to resolve the dilemma of the transformation of green technological innovation in manufacturing is to reduce the intensity of command-and-control environmental regulations, increase the intensity of market-based incentive, and actively stimulate public participation in environmental regulations.
ConclusionDue to the negative externalities of green technology innovation, the manufacturing industry faces the dilemma of insufficient internal motivation for the transformation of green technological innovation, and the subjective intention of green technological innovation in manufacturing will directly affect their behavior choice. Traditional research based solely on the logic perspective is not comprehensive, therefore this study, used the perspective of concept and behavior logic coupling, to unlock the plight of the transformation of green technological innovation in manufacturing. Green technological innovation can be divided into three types: Class I, Class II, and Class III, and environmental regulation is divided into command-control, market-based incentives, and public participation. At the same time, the factors influencing the transformation of green technology innovation in manufacturing industries—environmental regulation and subjective intention and behavior of manufacturing—are included in the SD model based on dividing the subsystems of behavior, will, and benefits of green technology innovation. In addition, there are seven ways to solve the dilemma of green technological innovation transformation in the manufacturing industry. The Vensim software was mobilized to simulate and analyze the economic, social, and environmental performance of the transformation of green technological innovation in manufacturing using related data from 2011 to 2019 and provided a comparative analysis of the effects of seven paths on the transformation of green technological innovation in manufacturing industries. The main conclusions of this study are as follows:
First, transforming green technological innovation in manufacturing industries can improve economic, social, and environmental performance. Based on the results presented in Section 4.3. The model simulation analysis showed that the transformation of green technological innovation in manufacturing increases the sales income of manufacturing industries, improves the level of socially green technological innovation, and promotes the ecological environment. Therefore, it has a significant positive effect on economic, social, and environmental performance.
Second, command-and-control environmental regulations inhibit the transformation of green technological innovation in manufacturing. According to Section 5.2, a simulation analysis of unlocking paths shows that from 2011 to 2030, command-controlled environmental regulation will strongly inhibit the transformation of green technological innovation in manufacturing. Moderately reducing the intensity of command-and-control environmental regulations will help the manufacturing industry improve its economic benefits and promote its transformation to Class II green technological innovation. The loss caused by weakening the intensity of command-and-control environmental regulations can be compensated by adjusting other environmental regulations.
Third, market-motivated environmental regulations promote the transformation of green technological innovation in manufacturing. According to Section 5.2, the simulation analysis of unlocking paths from 2011 to 2019 revealed that high-intensity market-motivated environmental regulations can significantly promote the transformation of green technological innovation in manufacturing industries. From 2020 to 2030, strengthening market-motivated environmental regulations can accelerate transformation, but the improvement rate tends to be moderate. This shows that high intensity of market-oriented environmental regulation is conducive to transforming the manufacturing industry into a class II green technological innovation. This will steadily promote the transformation of green technological innovations in the manufacturing industry over time.
Fourth, voluntary environmental regulations had a small impact on the transformation of green technological innovation in the manufacturing industry. According to Section 5.2, the simulation analysis of unlocking paths shows a substantial annual increase in ISO14001-certification enterprises. Still, the impact on the transformation of green technological innovation in manufacturing industries was insignificant.
Fifth, since the system of transformation of green technological innovation in manufacturing industries is complex and involves systematic engineering, a single set of environmental regulation policies cannot fully exhibit the best effects because of their characteristics. However, a variety of tools for environmental regulation can learn from each other and form complementary advantages. According to Section 5.2, the simulation analysis of unlocking paths and comprehensive application of the three environmental regulations will promote the transformation of green technological innovation in the manufacturing industry. Therefore, combining and optimizing the three types of environmental regulations can promote the transformation of green technological innovation in manufacturing industries more than using a single environmental regulation tool.
Based on the existing conclusions, this study makes the following policy suggestions:
First, the intensity of command-and-control environmental regulations should be appropriately reduced. The government should include laws and regulations for environmental protection, lighten the administrative ways of the government, and provide manufacturing industries with a certain degree of autonomy. This will strengthen the strong supporting role of command-and-control environmental regulation in green technological innovation and avoid strict environmental policies that inhibit the willingness of the manufacturing industry to actively carry out green technological innovation. Additionally, we should establish a performance evaluation system for green technological innovation, shift environmental regulation to market supervision, strengthen investment-oriented measures focusing on the green economy, and reduce cost-oriented environmental regulations by focusing on increasing costs.
Second, strengthening the intensity of market incentive environmental regulation is important. First, it ought to improve the collection system of environmental taxes, including the emission of carbon dioxide and other pollutants into the tax payable catalog, expand the number of manufacturing industries that pay environmental taxes, increase the environmental tax rate, and apply preferential tax policies to the R&D investment of green technological innovation and transformation of the manufacturing industry. Second, perfecting the trading system of emissions rights and providing support to the market's regulatory role. The government should establish relevant laws and regulations on emission-right trading to have laws to abide by and promote emission-right trading behavior of the manufacturing industry, fundamentally. Finally, a market-based carbon emissions and emission rights trading platform must be established. A guiding price should be set for the development of trading to reduce restrictions between trading parties, enhance market participants’ flexibility, and rationally allocate public resources.
Third, voluntary public environmental regulations should be actively implemented to promote the transformation of green technological innovation in the manufacturing industry. The government should first improve the public's awareness of environmental protection through a combination of online and offline channels through a network platform to stimulate public participation in environmental regulation to play a leading role in the manufacturing industry. Then, when the government encourages manufacturing industries to participate in the system of voluntary environmental management, it should enhance the requirements of environmental protection for the manufacturing industries, enrich the organizational forms of public participation in environmental regulation, such as participating in environmental quality certification, mark certification, and environmental protection agreements, and provide appropriate subsidies and policy support to the voluntary manufacturing industries. In addition, managers of the manufacturing industry should actively participate in public, voluntary environmental regulation; formulate green technology innovation research and development strategies; strengthen the rational allocation of resources; adopt green, efficient, and intelligent production modes; and improve the overall environmental quality of employees to realize the transformation of green technological innovation in manufacturing industries.
Fourth, we comprehensively applied three types of environmental regulation policies. Therefore, the government should appropriately reduce the intensity of command-and-control environmental regulations, strengthen market incentive environmental regulations, and reasonably improve the role of public voluntary environmental regulations to provide the best advantages of the three environmental regulations, accelerate the transformation of green technological innovation in manufacturing industries, and achieve sustainable development.
The innovation of this study is as follows:
- (1)
Based on the development trend of the transformation of green technological innovation in manufacturing industries, the research perspective is expanded to the subjective will of green technological innovation, overcoming the limitations of the traditional logical perspective. Green technological innovation is divided into Classes I, II, and III green technology innovation. Further, it studies the paths of the transformation of green technological innovation in manufacturing industries from the dual-logic perspective of behavior and concept, which perfectly supplements the previous research perspective of green technological innovation.
- (2)
Previous research has only considered the effects of command-and-control environmental regulation and market-based incentive environmental regulation on the manufacturing of green technology innovation. In contrast, the transformation of green technology innovation in manufacturing faces multiple constraints, such as resource and environmental problems. Due to the bondage of its existing features, single environmental regulation often cannot provide all the benefits. Therefore, it is not comprehensive to study the effect of a single tool of environmental regulation on the transformation of green technological innovation in manufacturing industries. This study is divided into three types: command-control, market-based incentive, and public participation environmental regulation, by comprehensively considering the three types of environmental regulation and its portfolio strategy for manufacturing the influence of the transformation of green technology innovation. The path of unlocking the predicament of the transformation of green technological innovation in manufacturing industries was designed to enrich the research on green technological innovation.
- (3)
By constructing a SD model for the transformation of green technological innovation in manufacturing industries, traditional research on system dynamics only divides subsystems into economy, society, resources, and environment. Thus, from the perspective of a system that considers influencing factors such as enterprise, government, and market, this study divides the subsystems of behavior, will, and benefits of green technological innovation. It also discusses the economic, social, and environmental performance of green technological innovation transformation in manufacturing. It deepens and expands previous research on system dynamics and enriches research methods for the transformation of green technological innovation in manufacturing industries.
This study has some shortcomings; due to the change in the statistical caliber of data after 2011, data on waste solids, wastewater, and exhaust gas emissions are unavailable. In this study, data from 2011 to 2019 were selected as the initial data based on many literature reviews, and the disposal volumes of solid waste, chemical oxygen demand emissions, and sulfur dioxide emissions were used to replace the above three data. Therefore, future research should select the data of various provinces and cities or manufacturing industries with a wider time frame and select more comprehensive empirical data to measure the emissions of waste solids, wastewater, and exhaust gas to make the research results more applicable.
Data availability statementThe authors confirm that the data supporting the findings of this study are available in the study.
Funding StatementThe authors did not receive specific funding.
Data Availability StatementThe data used to support the findings of this study are included within the article.