Allergic respiratory diseases such as asthma and rhinitis are common disorders which have grown considerably during the past 30 years with no doubt due to the world being more industrialised. Allergic rhinitis (AR) may simply affect man during almost any stages of life. Among causative allergens, aeroallergens have received more attention. It seems rational that recognition of high load responsible aeroallergens using a simple and inexpensive method such as skin prick test (SPT) within each specific area may improve the understanding of the pathologic patterns and ultimately give rise to more efficient treatment protocols.
All of the patients with the diagnosis of AR referred to the Research Center for Allergy & Asthma in Rasoul-e-Akram Hospital in Tehran, Iran between March 2007 and March 2008 were recruited in this cross-sectional study. Patients with a history of immunotherapy, dermographism, chronic steroids use and individuals younger than four years were excluded. After taking written informed consent from patients or guardians, all were provided with the questionnaires for medical records and baseline characteristics (e.g. gender, age, and family history of atopy). Patients were divided into two age categories: children <21 years and adults ≥21 years based on the American Academy of Pediatrics limits.1
All patients’ sera and nasal smear were obtained for measuring the total IgE (ELISA method, Padtan Elm, Iran) and nasal smear eosinophilia (Gimsa staining), respectively. After enrolment, they were subjected to SPT by prick puncture test and the result was carefully graded for the widest wheal diameter [0 (<3mm); 1+ (3–3.99mm); 2+ (4–5.99mm); 3+ (6–8.99mm); and 4+ (≥9mm or pseudopodia)]. The patients under confounding medication such as antihistamines and topical corticosteroids which interfere with SPT interpretation were asked to withhold them for a certain period based on the allergist’s discretion.
Allergenic extracts (Allergopharma, Germany) included pollens (weeds, grass and trees), mites and moulds (Penicillum Notatum, Aspergillus Fumigates). Weeds were Oxe eye daisy, Sorrel, Lambs quarter and three weeds mix (Nettle, English Plantain, Dandelion Taraxacum Vulgare). Grasses were Barley, Vernal and six grasses mix: Velvet, Orchard, Rye (Lolium perennel), Timothy, Kentucky Blue and Meadow Fescue. Tree extracts provided with early boom sing (Birch, Beech, Oak and Plane) and mid-boom sing [Alder, Hazel, Poplar, Elm (Ulmus Scabra) and Willow].
To test the differences between parametric and non-parametric variable means in groups of the study, Independent T-test and Mann-Whitney U-test were used, respectively. A Chi2 statistical test was also used to evaluate the possible statistical differences in the distribution of qualitative variables among different groups of the study. A Spearman’s rho test was used to assess the correlations between continuous variables. Receiver operating characteristics (ROC) curve analysis was also performed to evaluate the predictability of positive SPT with total serum IgE and a cut-off point was determined. A 5% probability of a type I error (two-tailed), and a power of 80% were considered in the analysis. All reported P-values are two-tailed and a P-value of <0.05 was considered significant. The study protocol was approved by the ethics committee of Iran University of Medical Sciences (IUMS thesis record: 4399) and all researchers adhere to the Declaration of Helsinki.
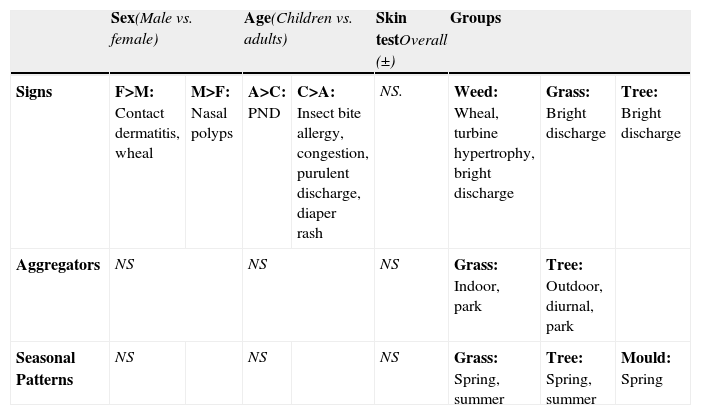
Among a total of 245 patients, there were 118 males (48.2%) and 127 females (51.8%) with a mean age of 26.39 (SD=11.95) years, ranging from 4 to 65 years. Eighty-four patients (34.3%) were children and 161 patients were adults (65.7%). Asthma was presented in 42 (17.1%) allergic patients and a positive family history of atopy was reported in 179 (73.1%) of the patients. Rhinorrhoea (86%) and sneezing (73%) were the most frequent symptoms in medical records of the patients. Most frequent aggregators were cold weather (61%) and dust (56%), respectively. Overall seasonal pattern was seen in 36% (88) of patients, perennial pattern in 29.38% (72) and 20.81% (51) had perennial pattern with exacerbation in some seasons (mixed). More prevalent signs and symptoms, aggregators and seasonal patterns of exacerbations regarding age, sex, overall SPT results and specific antigenic groups are summarised in Table 1.
Correlations between dependent and independent variable and predictor groups. (All mentioned data are significantly more frequent in the specific groups, otherwise, determined with NS)
| Sex(Male vs. female) | Age(Children vs. adults) | Skin testOverall (±) | Groups | |||||
| Signs | F>M: Contact dermatitis, wheal | M>F: Nasal polyps | A>C: PND | C>A: Insect bite allergy, congestion, purulent discharge, diaper rash | NS. | Weed: Wheal, turbine hypertrophy, bright discharge | Grass: Bright discharge | Tree: Bright discharge |
| Aggregators | NS | NS | NS | Grass: Indoor, park | Tree: Outdoor, diurnal, park | |||
| Seasonal Patterns | NS | NS | NS | Grass: Spring, summer | Tree: Spring, summer | Mould: Spring | ||
A: adults; C: children; F: female; M: male; NS: not significant.
Eosinophilia (defined by more than 10% and 4% in adults and children, respectively) was seen in 88 (44%) of nasal smears and it was seen more in males than females [52 (59.1%) vs. 36 (40.9%), P=0.031]. Our study revealed that serum IgE level was higher in the positive SPT group in comparison to those with negative SPT (224.14±235.05 vs. 53.57±40.85IU/ml, P=0.005). Regarding patient gender, there was no significant difference in IgE serum level between them. Moreover, no significant differences in the serum level of IgE were observed in different specific antigenic groups except for the positive SPT for mites (P<0.001). Also, serum IgE level was significantly correlated to the number of positive tests (Spearman’s rho=0.198, P=0.002) and severity of skin response based on diameter of the wheal (Spearman’s rho=0.243, P<001). Using ROC curve analysis, we proposed a cut-off point of 57IU/ml for the total serum IgE to predict positive SPT results [Area under curve (AUC)=0.815] with a specificity of 86%, sensitivity of 78%, positive predictive value (PPV) of 88%, and negative predictive value (NPV) of 9%.
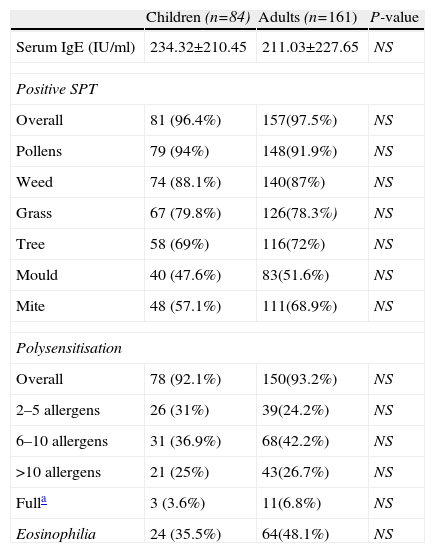
Positive SPT was seen in 97.1% (238) of patients for at least one antigen while polysensitisation was also very common, observed in 93.7% (230). In particular, 4% (10) of patients were sensitised against one allergen, 27% (66) against 2–5 allergens, 41% (100) against 5–10 allergens, and 26% (64) against >10 allergenic extracts. Surprisingly, 13 patients (7%) were sensitised against all of the 13 antigenic extracts. The highest rates for positive SPT were for pollens (92.7%) followed by mites (64.9%), and moulds (50.2%); and among the pollens, weeds (87.3%), grass (78.8%) and trees (71%) were the commonest. In addition, the most frequent single allergen was weed pollen Lambs quarter (74.7% of total patients). There were not any significant difference in positive SPT frequencies of various allergens comparing for age groups and sex except for the grass Bermuda which occurred more frequently in females (P=0.031). A complete comparison of different variables between the two age groups is shown in Table 2.
Comparison between children and adults for various variables
| Children (n=84) | Adults (n=161) | P-value | |
| Serum IgE (IU/ml) | 234.32±210.45 | 211.03±227.65 | NS |
| Positive SPT | |||
| Overall | 81 (96.4%) | 157(97.5%) | NS |
| Pollens | 79 (94%) | 148(91.9%) | NS |
| Weed | 74 (88.1%) | 140(87%) | NS |
| Grass | 67 (79.8%) | 126(78.3%) | NS |
| Tree | 58 (69%) | 116(72%) | NS |
| Mould | 40 (47.6%) | 83(51.6%) | NS |
| Mite | 48 (57.1%) | 111(68.9%) | NS |
| Polysensitisation | |||
| Overall | 78 (92.1%) | 150(93.2%) | NS |
| 2–5 allergens | 26 (31%) | 39(24.2%) | NS |
| 6–10 allergens | 31 (36.9%) | 68(42.2%) | NS |
| >10 allergens | 21 (25%) | 43(26.7%) | NS |
| Fulla | 3 (3.6%) | 11(6.8%) | NS |
| Eosinophilia | 24 (35.5%) | 64(48.1%) | NS |
NS: not significant
Reviewing a relative large number of variables and predictors in our study, pollens constituted the major sensitising allergens, comparable to studies from Kuwait2 and Turkey3 with regards to considerably higher sensitising rates in our country [92.7% (our study, Iran) vs. 77.3% (Kuwait) and 44.3% (Turkey)]. Weeds and in particular Lambs quarter are heavily loaded out-door aeroallergens responsible for most allergic rhinitis patients in the area studied. As analysed, there were no considerable differences between children and adults. Our study failed to demonstrate a significant relationship between positive reactions and patient’s age and gender except for the grass Bermuda. Furthermore, we found no statistically significant correlation between patients’ sera total IgE and patient age.
Our research centre receives allergic patients from almost all parts of the country with the different vegetation, climate and temperature which could design a relatively reliable model for predicting the responsible aeroallergens in a certain area between the Caspian Sea and Persian Gulf. Our result is comparable with studies in four capital cities of Iran conducted in Karaj4 in the north; Mashhad5 in the northeast; and Shiraz6 in the central part, all have semiarid climate with hot summers and cold winters. Higher rates for house dust mites reported from Sistan-Blouchestan7 province in the southeast may probably be due to the higher humidity which is to be expected as it is located along the Oman Sea. This is in agreement with studies from Thailand8, and Singapore9 with high humidity that makes a suitable medium for mites to grow.
Comparable level of serum IgE in positive SPT for mites – despite its low positive rate (64.9% vs. 92.7% for pollens)- may be due to the higher antigenicity of these allergens versus lower spread load. Although total serum IgE level is considered as a non-specific-sensitive diagnostic laboratory aid, our study proposed a cut-off point of 57IU/ml to predict positive reaction with a considerable sensitivity and specificity. It was also related to the severity of skin response to various allergenic extracts.
Significant casual relationship was found between passive or active smoking and asthma (OR=2.5, CI 95%=1.2–5.05, P=0.008). This simple but real fact reminds one that overlooking such a non-medical cultural point of view may readily fade the effects of specific medical interventional strategies against allergic diseases, even at a national level.
Designation of a proper multidisciplinary strategy demands an exact knowledge about the spread load of the responsible allergens in certain areas according to their considerable variation within a country, besides the vast variety between countries. Moreover, concordance of medical and non-medical strategies may warrant better results controlling the morbidities related to allergic diseases and which put a very heavy financial burden on healthcare systems.


