


Nonalcoholic fatty liver disease (NAFLD), now redefined as metabolic dysfunction-associated steatotic liver disease (MASLD), is a benign disease characterized by triglyceride build-up in liver cells (>5 %) resulting from complex interactions with various cardiometabolic risk factors [1,2]. Recent epidemiological studies estimate that MASLD affects >30 % of the global population, with a prevalence of 44 % in Latin America [3,4]. This disease encompasses simple fat accumulation to metabolic dysfunction-associated steatohepatitis (MASH), formerly known as nonalcoholic steatohepatitis (NASH), which is characterized by macrovesicular steatosis, lobular inflammation, and may progress to cirrhosis and hepatocellular carcinoma (HCC) [2,3,5].
MASHHCC progression is promoted by inflammation, which leads to chronic hepatocyte cell death and compensatory proliferation during MASH bearing mild to advanced fibrosis and increased levels of transforming growth factor-β (TGF-β), interleukin-1β (IL-1β), interleukin-18 (IL-18), as well as activation of hepatic stellate cells (HSCs) and liver sinusoidal endothelial cells, which contribute to chromosomal aberrations and consequently promote HCC development [6–8].
Recently, it has been shown that inflammasomes play a crucial role in both innate immune and non-immune cell responses, such as those of neutrophils and hepatocytes, respectively, thereby promoting a chronic inflammatory environment that serves as a signaling platform that is activated in response to excessive pathogenic and cellular stress-related products in the liver [9,11]. The nucleotide-binding oligomerization domain-like receptor family pyrin domain-containing 3 (NLRP3) inflammasome is the most extensively studied and well characterized; it consists of NLRP3, an apoptosis-associated speck-like protein containing CARD (ASC), and pro-caspase-1 [9]. Activation of NLRP3 inflammasome complex leads to caspase-1 activation, which triggers IL-1β and IL-18 maturation and pyroptosis [9,11].
Pyroptosis is a highly inflammatory process characterized by gasdermin D (GSDMD) synthesis mediated by caspase-1 to form rapid cell swelling, pores in the plasma membrane, and release of intracellular pro-inflammatory proteins, such as IL-1β and IL-18, as well as NLRP3 and TGF-β, which might amplify inflammation and contribute to tissue damage [8,9]. Pyroptosis may be involved in several HCC mechanisms mediated by MASH such as tumor microenvironment promotion through the release of IL-1β and IL-18, and damage-associated molecular patterns (DAMPs) produced lipid accumulation and oxidative stress, two hallmarks of MASH, resulting in chronic liver inflammation that leads to DNA damage [8–10]. Moreover, pyroptosis-induced inflammation stimulates HSC activation and collagen production, thereby stimulating a profibrotic microenvironment and activating pro-tumorigenic signaling pathways [10,11].
This evidence strongly suggests that the NLRP3 inflammasome/pyroptosis pathway is an attractive therapeutic target in MASH-driven HCC. In contrast, evidence also indicates that naringenin (NAR), a flavonoid found in various citrus fruits such as oranges, grapefruits, and lemons, has antioxidant, anti-inflammatory, and anticancer properties and inhibits the NLRP3/pyroptosis pathway [12–15].
It has been shown that the antioxidant effects of NAR are closely associated with the activation of the nuclear factor erythroid 2-related factor 2 pathway and regulation of antioxidant and detoxification gene expression [15]. Consequently, NAR enhances cellular antioxidant defense, reduces oxidative stress, and inhibits inflammation, thereby protecting liver cells from damage [15].
Although the effect of NAR on suppressing the NLRP3 inflammasome/pyroptosis pathway mediated by either MASH or HCC has been investigated [14,15], its anticancer activity in the MASH-driven HCC microenvironment remains unexplored. Thus, we aimed to assess the effect of NAR on early HCC induced by a MASHHCC model and determine whether this flavonoid exerts its anticancer effect by regulating the NLRP3 inflammasome/pyroptosis pathway.
2Materials and methods2.1Experimental designSix-week-old male Fischer 344 rats weighing 100–120 g (n = 20) were sourced from the Laboratory of Animal Production and Experimentation Unit at the Center for Research and Advanced Studies of the National Polytechnic Institute (UPEAL-CINVESTAV-IPN; CDMX, Mexico). All experimental procedures were performed according to the institutional guidelines approved by the Ethics Committee of CINVESTAV-IPN under protocol No. 310–20 and in line with Mexican official regulations (NOM-062-ZOO-1999). Animals were housed in a room with regulated conditions of 21 ± 1 °C, 50–60 % relative humidity, a 12-hour dark/night cycle, and unrestricted access to both water and food. Before the experiment, the rats were acclimatized for one week.
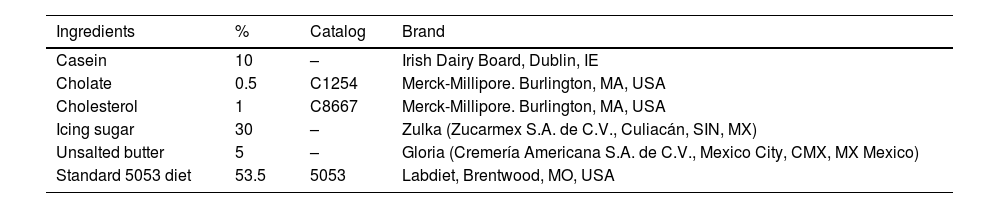
Animals were randomly divided into four groups (n = 5 per group). Control (CTL) and NAR groups were fed a standard diet ad libitum (5053, Labdiet, Brentwood, MO, USA) for 16 weeks (Fig. 1). The CTL group received 14 and 10 weekly injections of liquid petrolatum (7110; Reactivos Química Meyer. Mexico City, CDMX, MX) and Milli-Q water were vehicles for carbon tetrachloride (CCl4, 31,996–1, Merck-Millipore Burlington, MA, USA) and diethylnitrosamine (DEN, N0756, Merck-Millipore. Burlington, MA, USA), respectively (Fig. 1). To develop a MASH-driven HCC (M-HCC) model, animals were fed a hepatopathogenic diet (Table 1) for 16 weeks and intraperitoneally (i. p.) injected with CCl4 at 400 mg/kg body weight (BW) and DEN at 40 mg/kg BW once a week for 14 and 10 weeks, respectively [8,16–18]. The CCl4 administration protocol was previously described by Cardoso-Lezama I, et al. [8], Vargas-Pozada EE, et al. [17], and Vargas-Pozada EE, et al. [18], and the DEN protocol was adapted from the hepatocarcinogenesis model previously described by Shiffer E, et al. [19]. DEN administration was initiated seven weeks after the onset of the high cholesterol diet, as shown in Fig. 1. A group of animals subjected to either NAR alone or M-HCC + NAR was administered NAR daily by gavage (W530098; Merck-Millipore. Burlington, MA, USA) at 100 mg/kg BW and suspended in 0.7 % carboxymethyl cellulose [12] (5895–1000, Reactivos Química Meyer. Mexico City, CDMX, and MX, respectively) for 16 weeks (Fig. 1). One week after NAR administration, namely at 17 weeks, the rats were euthanized by exsanguination following an intraperitoneal injection of a mixture of ketamine at 100 mg/kg BW (A028062, Anesket PiSA, Zapopan, JAL, MX) and xylazine at 8 mg/kg BW (A114218, Procin PiSA, Zapopan, JAL, MX).
 group was fed ad libitum a standard diet, illustrated with a continuous black line, along with weekly i.p. injections of liquid petrolatum (depicted with green arrows) and Milli-Q water (indicated by golden arrows). MASH-driven HCC (M-HCC) + naringenin (NAR) group received daily NAR at 100 mg/kg by gavage (illustrated with a continuous grey line). The NAR group received the standard diet and NAR at 100 mg/kg by gavage. Experimental groups had unrestricted access to a hepatopathogenic diet for 16 weeks, shown by a black dashed line, and CCl4 at 400 mg/kg, marked by blue arrows. In the last 10 weeks, DEN was administered at 40 mg/kg via i.p. injection, represented with orange arrows. Euthanasia of animals is indicated in red asterisks. CTL, control; M-HCC, MASH-driven HCC; NAR, naringenin; M-HCC+NAR, MASH-driven HCC administrated with naringenin. n = 5 animals per group.")
Schematic representation of M-HCC and NAR administration.
The control (CTL) group was fed ad libitum a standard diet, illustrated with a continuous black line, along with weekly i.p. injections of liquid petrolatum (depicted with green arrows) and Milli-Q water (indicated by golden arrows). MASH-driven HCC (M-HCC) + naringenin (NAR) group received daily NAR at 100 mg/kg by gavage (illustrated with a continuous grey line). The NAR group received the standard diet and NAR at 100 mg/kg by gavage. Experimental groups had unrestricted access to a hepatopathogenic diet for 16 weeks, shown by a black dashed line, and CCl4 at 400 mg/kg, marked by blue arrows. In the last 10 weeks, DEN was administered at 40 mg/kg via i.p. injection, represented with orange arrows. Euthanasia of animals is indicated in red asterisks. CTL, control; M-HCC, MASH-driven HCC; NAR, naringenin; M-HCC+NAR, MASH-driven HCC administrated with naringenin. n = 5 animals per group.
Hepatopathogenic diet.
| Ingredients | % | Catalog | Brand |
|---|---|---|---|
| Casein | 10 | – | Irish Dairy Board, Dublin, IE |
| Cholate | 0.5 | C1254 | Merck-Millipore. Burlington, MA, USA |
| Cholesterol | 1 | C8667 | Merck-Millipore. Burlington, MA, USA |
| Icing sugar | 30 | – | Zulka (Zucarmex S.A. de C.V., Culiacán, SIN, MX) |
| Unsalted butter | 5 | – | Gloria (Cremería Americana S.A. de C.V., Mexico City, CMX, MX Mexico) |
| Standard 5053 diet | 53.5 | 5053 | Labdiet, Brentwood, MO, USA |
Blood samples were obtained by intracardiac puncture and centrifuged at 3000 rpm for 15 min. To determine liver damage, serum activities of alanine aminotransferase (ALT), alkaline phosphatase (AP), and γ-glutamyl transpeptidase (GGT) were measured by colorimetric methods [20–22]. Hepatic glycogen content was quantified in fresh liver samples using the anthrone method [23]. Finally, absorbance measurements were performed at 515 nm for ALT, 410 nm for AP and GGT, and 620 nm for glycogen. Milli-Q water was used as a reference blank, and measurements were obtained using a SHIMADZU UV-1201 spectrophotometer (Shimadzu Corporation, Kyoto, JPN).
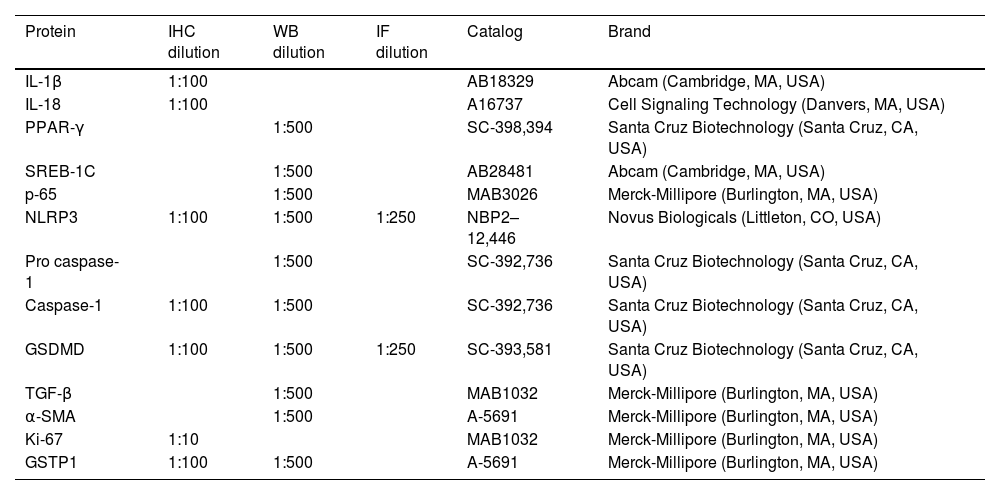
2.3Western blot analysisFor the extraction of total proteins, tissue samples were prepared in a buffer containing a Protease Inhibitor Cocktail and phosphatase inhibitors (P8340 and P0044, respectively, Merck-Millipore Burlington, MA, USA) and quantified using the bicinchoninic acid method [24,25]. Membranes were then incubated with the primary and secondary antibodies of interest (Table 2) and detected using Immobilon Forte Western HRP substrate (WBLUF0100; Merck-Millipore. Burlington, MA, USA). Protein levels were normalized by re-probing the blots against GAPDH levels. For quantitative analysis, densitometry was performed using the ImageJ® software, version 1.53t (National Institutes of Health, Bethesda, MD, USA).
Antibodies for immunohistochemistry (IHC), western blot, and immunofluorescence (IF) Analyses.
| Protein | IHC dilution | WB dilution | IF dilution | Catalog | Brand |
|---|---|---|---|---|---|
| IL-1β | 1:100 | AB18329 | Abcam (Cambridge, MA, USA) | ||
| IL-18 | 1:100 | A16737 | Cell Signaling Technology (Danvers, MA, USA) | ||
| PPAR-γ | 1:500 | SC-398,394 | Santa Cruz Biotechnology (Santa Cruz, CA, USA) | ||
| SREB-1C | 1:500 | AB28481 | Abcam (Cambridge, MA, USA) | ||
| p-65 | 1:500 | MAB3026 | Merck-Millipore (Burlington, MA, USA) | ||
| NLRP3 | 1:100 | 1:500 | 1:250 | NBP2–12,446 | Novus Biologicals (Littleton, CO, USA) |
| Pro caspase-1 | 1:500 | SC-392,736 | Santa Cruz Biotechnology (Santa Cruz, CA, USA) | ||
| Caspase-1 | 1:100 | 1:500 | SC-392,736 | Santa Cruz Biotechnology (Santa Cruz, CA, USA) | |
| GSDMD | 1:100 | 1:500 | 1:250 | SC-393,581 | Santa Cruz Biotechnology (Santa Cruz, CA, USA) |
| TGF-β | 1:500 | MAB1032 | Merck-Millipore (Burlington, MA, USA) | ||
| α-SMA | 1:500 | A-5691 | Merck-Millipore (Burlington, MA, USA) | ||
| Ki-67 | 1:10 | MAB1032 | Merck-Millipore (Burlington, MA, USA) | ||
| GSTP1 | 1:100 | 1:500 | A-5691 | Merck-Millipore (Burlington, MA, USA) |
Liver tissues were fixed in 4 % paraformaldehyde (00,380; Polyscience. Warrington, PA, USA) dissolved in 1X PBS, for 24 h, and embedded in paraffin. Then, samples were cut into 3 µm thick slices, mounted on electrocharged glass slides, deparaffined, dehydrated, and processed by H&E and Masson's stains, following standard protocols [26]. For IHC, after rehydration, antigens were unmasked in 0.01 M sodium citrate buffer (pH 6.0) for 20 min at 120 °C and washed with 1X PBS for 5 min. Endogenous peroxidase activity and nonspecific protein binding were blocked using 8 % H2O2 (2186–01, JT Baker. New Jersey, WA, USA) and 10 % nonfat milk for 1 h each. Afterward, tissue slices were incubated with primary antibodies overnight at 4 °C (Table 2). The proteins of interest were detected using secondary antibodies (Table 2) and incubated for 2 h at room temperature. Staining was examined under a bright-field microscope (Olympus IX70; Olympus Corporation. Hachioji, Tokyo, JP). The acquired images were examined utilizing the ImageJ® software, version 1.53t (National Institutes of Health, Bethesda, MD, USA).
2.5Immunofluorescence (IF) stainingIF staining was performed on tissue slices using a double-labeling procedure to detect both NLRP3 and GSDMD proteins following previously established protocols [27,28]. Sections were incubated at 4 °C overnight with primary antibodies and then with secondary antibodies (Table 2) in 0.2 % PBS-Tween for 2 h at room temperature. Label detection and image capture were performed by confocal microscopy using a Leica TCS SP8 AOBS DMI6000 confocal microscope (Acousto-optical Beam Splitter, Wetzlar, HE, USA).
2.6Oil red O (ORO) staining and GGT activityFrozen liver tissues were cut into 8 and 20-thick slices, affixed in glass slides coated with poly-l-lysine (P8920, Merck-Millipore. Burlington, MA, USA) and processed for ORO and GGT staining [29]. The ORO staining images were captured using an Olympus IX70 bright-field microscope (Olympus Corporation, Tokyo, JPN) and examined using ImageJ software, version 1.53t (National Institutes of Health, Bethesda, MD, USA). GGT-positive foci were captured and quantified using the AnalySIS Opty Soft Imaging System GmbH 3.00 software (Olympus Corporation, Hachioji, Tokyo, JPN).
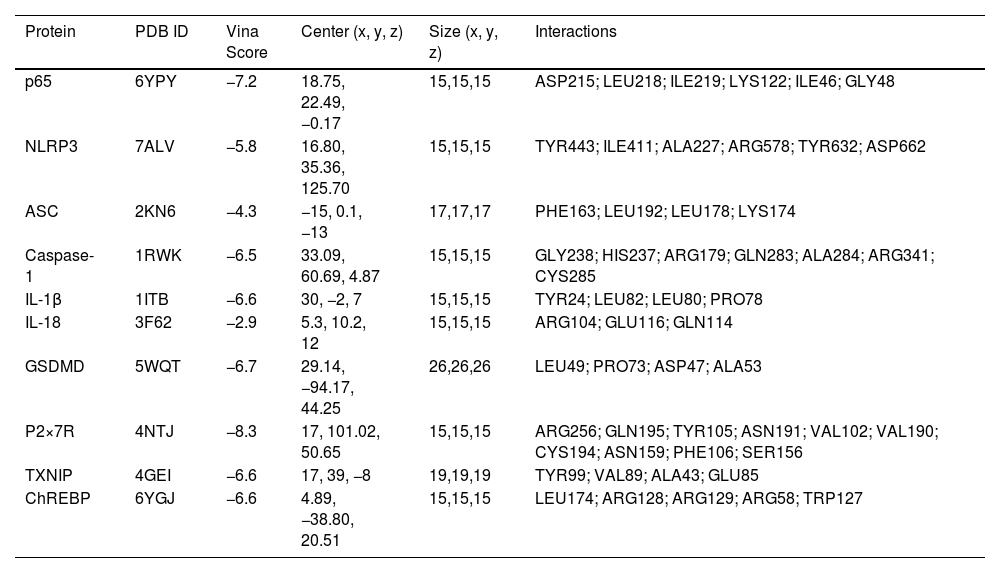
2.7Molecular dockingThe starting point for ligand preparation involved the minimum-energy molecular model for (S)-naringenin NAR from X-ray diffraction [30] in Chem3D 20.0 and energy minimization using MM2 (PerkinElmer Inc, Waltham, MA, USA) conformational search using MMFF94 force field (Spartan 14, wavefunction Inc., Irvine, CA, USA), energy calculation using DFT at B3LYP/6–31g(d) level, and geometry optimization at B3LYP/DGDZVP level of theory (Gaussian 03, Gaussian Inc., Wallingford, CT, USA). Crystal structures of various proteins, including nuclear factor-κB (NF-κB) (6YPY), NLRP3 (7ALV), ASC (2KN6), caspase-1 (1RWK), IL-1β (1ITB), IL-18 (3F62), GSDMD (5WQT), purinergic receptor (P2×7R) (4NTJ), carbohydrate-responsive element-binding protein (ChREBP) (6YGJ) and thioredoxin interacting protein (TXNIP) (4GEI), were retrieved from the RCSB Protein Data Bank (Table 3). Docking procedures were carried out using AutoDock Tools 4.2 (The Scripps Research Institute, La Jolla, CA, USA) on a computer system equipped with an AMD Ryzen 7 processor operating at 1.80 GHz with Radeon Graphics and 16 GB of RAM. Subsequently, the results were analyzed using AutoDock Tools 4.2, PyMOL 2.1 (Schrödinger), and BIOVIA Discovery Studio 2018 (BIOVIA, San Diego, CA, USA) software tailored for the Windows operating system.
Molecular docking of NAR with proteins associated with NLRP3 inflammasome/pyroptosis pathway.
| Protein | PDB ID | Vina Score | Center (x, y, z) | Size (x, y, z) | Interactions |
|---|---|---|---|---|---|
| p65 | 6YPY | −7.2 | 18.75, 22.49, −0.17 | 15,15,15 | ASP215; LEU218; ILE219; LYS122; ILE46; GLY48 |
| NLRP3 | 7ALV | −5.8 | 16.80, 35.36, 125.70 | 15,15,15 | TYR443; ILE411; ALA227; ARG578; TYR632; ASP662 |
| ASC | 2KN6 | −4.3 | −15, 0.1, −13 | 17,17,17 | PHE163; LEU192; LEU178; LYS174 |
| Caspase-1 | 1RWK | −6.5 | 33.09, 60.69, 4.87 | 15,15,15 | GLY238; HIS237; ARG179; GLN283; ALA284; ARG341; CYS285 |
| IL-1β | 1ITB | −6.6 | 30, −2, 7 | 15,15,15 | TYR24; LEU82; LEU80; PRO78 |
| IL-18 | 3F62 | −2.9 | 5.3, 10.2, 12 | 15,15,15 | ARG104; GLU116; GLN114 |
| GSDMD | 5WQT | −6.7 | 29.14, −94.17, 44.25 | 26,26,26 | LEU49; PRO73; ASP47; ALA53 |
| P2×7R | 4NTJ | −8.3 | 17, 101.02, 50.65 | 15,15,15 | ARG256; GLN195; TYR105; ASN191; VAL102; VAL190; CYS194; ASN159; PHE106; SER156 |
| TXNIP | 4GEI | −6.6 | 17, 39, −8 | 19,19,19 | TYR99; VAL89; ALA43; GLU85 |
| ChREBP | 6YGJ | −6.6 | 4.89, −38.80, 20.51 | 15,15,15 | LEU174; ARG128; ARG129; ARG58; TRP127 |
The data are presented as mean values ± S.E.M. Statistical analyses were conducted using two-way ANOVA followed by Tukey's post hoc test. The significance level was set at p < 0.05. Statistical analyses were performed using GraphPad Software, version 8.0.1 (244) (GraphPad, La Jolla, CA, USA).
2.9Ethical statementsAll experimental procedures were performed according to the institutional guidelines approved by the Ethics Committee of CINVESTAV-IPN under protocol No. 310–20 and in line with Mexican official regulations (NOM-062-ZOO-1999). All animal experiments complied with the ARRIVE guidelines and were carried out following the U.K. Animals (Scientific Procedures) Act, 1986 and associated guidelines, EU Directive 2010/63/EU for animal experiments, or the National Institutes of Health guide for the care and use of Laboratory animals (NIH Publications No. 8023, revised 1978). Male Fischer 344 rats were used in all experiments.
3Results3.1NAR attenuates liver damage in the MASH-driven HCC modelFig. 2 shows images of the macroscopic and microscopic alterations in the liver tissues of animals in the MASHHCC model and treated with NAR. Macroscopically (Fig. 2a), the liver from the control and NAR groups showed an unaltered classical bright red color, but that from the M-HCC group displayed a yellowish-white color and 83 % of the rats group showed visible tumors; interestingly, the liver from the M-HCC + NAR group exhibited a partial reduction in the appearance and only preneoplastic lesions were observed (Fig. 2a). The incidence of hepatic tumors was 83 % in the M-HCC group and 0 % in the M-HCC+NAR group (p < 0.05). The average number of tumors per liver was 1.0 ± 0.0 in the M-HCC group, which was significantly reduced to 0 ± 0 in the M-HCC+NAR group (p < 0.01).
 Representative macroscopic images of livers from each experimental group. (B) Microscopic images of liver tissue sections stained with H&E. (C) Markers of liver damage. Serum activity of AP, ALT, GGT, and hepatic glycogen content. In plots, bars represent the mean ± SEM obtained by two-way ANOVA statistical analysis. Statistically significant when compared with CTL (a) and M-HCC (b) groups; p < 0.05. CTL, control; M-HCC, MASH-driven HCC; NAR, naringenin; M-HCC+NAR, MASH-driven HCC administrated with naringenin. n = 5 animals per group.")
Effect of NAR on liver structure, cellular damage, and glycogen levels in the MASHHCC model.
(A) Representative macroscopic images of livers from each experimental group. (B) Microscopic images of liver tissue sections stained with H&E. (C) Markers of liver damage. Serum activity of AP, ALT, GGT, and hepatic glycogen content. In plots, bars represent the mean ± SEM obtained by two-way ANOVA statistical analysis. Statistically significant when compared with CTL (a) and M-HCC (b) groups; p < 0.05. CTL, control; M-HCC, MASH-driven HCC; NAR, naringenin; M-HCC+NAR, MASH-driven HCC administrated with naringenin. n = 5 animals per group.
Microscopically (Fig. 2b), the livers from the control and NAR groups exhibited normal polyhedral hepatocytes with central nuclei and eosinophilic cytoplasm, whereas from the M-HCC group showed disruption of the hepatic parenchyma, hepatocyte ballooning degeneration with peripheral nuclei, loss of cytoplasmic eosin, diffuse microvesicular and macrovesicular steatosis, inflammatory cell infiltration, necrosis, and altered hepatocyte foci. Notably, livers from the M-HCC + NAR group showed a significant reduction in the above alterations (Fig. 2b).
Histological alterations in the livers of the M-HCC group were accompanied by increased (p = 0.0001) serum levels of liver damage markers, such as AP, GGT, and ALT, compared to those in control rats. Conversely, NAR significantly reduced the activity of these enzymes (AP, p = 0.005; GGT and ALT, p = 0.0001) in the livers of animals subjected to M-HCC (Fig. 2c). Interestingly, the glycogen content was markedly reduced (p = 0.0001) by NAR in the livers of M-HCC rats (Fig. 2c). None of these liver injury markers were affected in either the control or NAR-treated groups (Fig. 2c).
3.2NAR attenuates steatosis and pro-inflammatory markersAnimals subjected to the M-HCC model showed remarkable steatosis, characterized by copious lipid vesicles in the cytosol of hepatocytes (Fig. 3a), which was significantly decreased (p = 0.0001) by NAR treatment (Fig. 3b). The NAFLD activity score (NAS) is shown in Table 4.
 Representative images of liver tissue-stained ORO and IHC staining of IL-1β and IL-18 proteins. Quantification of ORO-positive area (B), IL-1β (C), and IL-18 (D) Determination of protein levels by Western blotting of PPAR-γ (E), SREBP-1C (F), and p65 (G). In plots, bars represent the mean ± SEM obtained by two-way ANOVA statistical analysis. Statistically significant when compared with CTL (a) and M-HCC (b) groups; p < 0.05. CTL, control; M-HCC, MASH-driven HCC; NAR, naringenin; M-HCC+NAR, MASH-driven HCC administrated with naringenin. n = 3 animals per group.")
Effect of NAR on lipid accumulation, steatosis markers, and pro-inflammatory protein production.
(A) Representative images of liver tissue-stained ORO and IHC staining of IL-1β and IL-18 proteins. Quantification of ORO-positive area (B), IL-1β (C), and IL-18 (D) Determination of protein levels by Western blotting of PPAR-γ (E), SREBP-1C (F), and p65 (G). In plots, bars represent the mean ± SEM obtained by two-way ANOVA statistical analysis. Statistically significant when compared with CTL (a) and M-HCC (b) groups; p < 0.05. CTL, control; M-HCC, MASH-driven HCC; NAR, naringenin; M-HCC+NAR, MASH-driven HCC administrated with naringenin. n = 3 animals per group.
NAFLD activity score (NAS).
| Groups | Steatosis | Lobular inflammation | Ballooning | NAS |
|---|---|---|---|---|
| CTL | 0.0 (0.0) | 0.0 (0.0) | 0.0 (0.0) | 0.0 (0.0) |
| M-HCC | 2.0 (0.0) a | 2.2 (0.2) a | 2.0 (0.0) a | 6.2 (0.2) a |
| M-HCC+NAR | 1.0 (0.0) b | 1.1 (0.1) b | 1.4 (0.2) b | 3.5 (0.2) b |
| NAR | 0.0 (0.0) | 0.0 (0.0) | 0.0 (0.0) | 0.0 (0.0) |
Results were expressed as mean ± SEM and were obtained by two-way ANOVA statistical analysis. Statistically significant when compared with CTL (a) and M-HCC (b) groups; p < 0.05. CTL, control; M-HCC, MASH-driven HCC; NAR, naringenin; M-HCC+NAR, MASH-driven HCC administrated with NAR.
The proteins involved in inflammation, such as IL-1β, IL-18, and p65, were evaluated by IHC and western blot (Fig. 3c,d,e,f,g). Animals subjected to the M-HCC model showed an important elevation in the protein level of IL-1β (p = 0.0001), IL-18 (p = 0.0001), and p65 (p = 0.0031); of note, NAR treatment attenuated these increments (IL-1β, p = 0.0001; IL-18, p = 0.0001; and p65, p = 0.0035). M-HCC model also decreased (p = 0.0001) peroxisome proliferator-activated receptor gamma (PPAR-γ) protein level (Fig. 3h) but increased (p = 0.0014) sterol regulatory element-binding protein 1C (SREBP-1C) (Fig. 3i). Interestingly, NAR treatment attenuated these alterations (SREBP-1C, p = 0.0161; PPAR-γ, p = 0.0061), as compared with animals subjected only to the M-HCC model. NAR alone did not affect these parameters.
3.3NAR inhibits the NLRP3 inflammasome/pyroptosis pathwayThe percentages of NLRP3-, caspase-1-, and GSDMD-positive areas in the livers of the control animals are shown in (Fig. 4a). Rats in the M-HCC model exhibited increased (p = 0.0001) levels of these proteins (Fig. 4b). Western blot analysis (Fig. 4c,d,e) validated this evidence (NLRP3, p = 0.0004; caspase-1, p = 0.0021; and GSDMD-N, p = 0.0002); however, pro-caspase-1 protein levels were not altered in any group (Fig. 4f). Nevertheless, NAR administration blocked NLRP3 inflammasome (p = 0.0033); caspase-1 (p = 0.0661), GSDMD-N (p = 0.0021), and NLRP3 inflammasome/pyroptosis activation in the livers of rats in the M-HCC model. The NLRP3/pyroptosis signaling pathway remained unchanged following NAR treatment.
 IHC analysis of NLRP3, caspase-1, and GSDMD proteins. (B) Quantification of the positive area for NLRP3, caspase-1, and GSDMD proteins. Western blot analysis of NLRP3 (C), pro-caspase-1 (D), caspase-1 (E), and GSDMD-N (F) proteins. In plots, bars represent the mean ± SEM obtained by two-way ANOVA statistical analysis. Statistically significant when compared with CTL (a) and M-HCC (b) groups; p < 0.05. control; M-HCC, MASH-driven HCC; NAR, naringenin; M-HCC+NAR, MASH-driven HCC administrated with naringenin. n = 3 animals per group.")
Effect of NAR on NLRP3 inflammasome/pyroptosis pathway.
(A) IHC analysis of NLRP3, caspase-1, and GSDMD proteins. (B) Quantification of the positive area for NLRP3, caspase-1, and GSDMD proteins. Western blot analysis of NLRP3 (C), pro-caspase-1 (D), caspase-1 (E), and GSDMD-N (F) proteins. In plots, bars represent the mean ± SEM obtained by two-way ANOVA statistical analysis. Statistically significant when compared with CTL (a) and M-HCC (b) groups; p < 0.05. control; M-HCC, MASH-driven HCC; NAR, naringenin; M-HCC+NAR, MASH-driven HCC administrated with naringenin. n = 3 animals per group.
To assess the effect of NAR treatment on pyroptosis activation, we detected NLRP3 and GSDMD proteins by IF analysis (Fig. 5). The results showed that the M-HCC model had increased levels of NLRP3 (p = 0.0001) and GSDMD (p = 0.0001) protein in altered hepatocyte foci. Conversely, NAR administration reduced (NLRP3, p = 0.0031; and GSDMD, p = 0.0013) the levels of these proteins (Fig. 5a), and quantitative analysis corroborated this observation (Fig. 5b). NAR and control groups did not affect protein levels.
 IF analysis of NLRP3-GSDMD. (B) Quantification of NLRP3 and GSDMD fluorescence density (MFI). In plots, bars represent the mean ± SEM obtained by two-way ANOVA statistical analysis. Statistically significant when compared with CTL (a) and M-HCC (b) groups; p < 0.05. control; M-HCC, MASH-driven HCC; NAR, naringenin; M-HCC+NAR, MASH-driven HCC administrated with naringenin. n = 3 animals per group. Magnification is 10×.")
Effect of NAR on NLRP3 inflammasome and pyroptosis activation.
(A) IF analysis of NLRP3-GSDMD. (B) Quantification of NLRP3 and GSDMD fluorescence density (MFI). In plots, bars represent the mean ± SEM obtained by two-way ANOVA statistical analysis. Statistically significant when compared with CTL (a) and M-HCC (b) groups; p < 0.05. control; M-HCC, MASH-driven HCC; NAR, naringenin; M-HCC+NAR, MASH-driven HCC administrated with naringenin. n = 3 animals per group. Magnification is 10×.
The percentage of the collagen content-positive area increased in the livers of animals subjected to the M-HCC model, whereas NAR administration reduced (p = 0.0001) this content (Fig. 6a,b). Moreover, ECM accumulation was corroborated by quantifying hydroxyproline levels in liver samples, which showed that it was increased (p = 0.0010) in the M-HCC model compared to controls. In contrast, the NAR treatment reduced this effect (p = 0.0248). However, the NAR alone did not affect this parameter (Fig. 6c).
 Representative images of Masson")
Effect of NAR on fibrosis and profibrogenic mediators.
(A) Representative images of Masson's trichrome staining. Scale bars represent = 100 μm. (B) Percentage of collagen area (n = 3). (C) Collagen content was determined by measuring the liver hydroxyproline level (n = 5). Western blot analysis of TGF-β (n = 3) (D), α-SMA (n = 3) (E). The protein level of interest was normalized to that of GAPDH used as the loading control. In plots, bars represent the mean ± SEM obtained by two-way ANOVA statistical analysis. Statistically significant when compared with CTL (a) and M-HCC (b) groups; p < 0.05. control; M-HCC, MASH-driven HCC; NAR, naringenin; M-HCC+NAR, MASH-driven HCC administrated with naringenin.
Stellate cell activation is considered a profibrogenic event, therefore presence of activation markers TGF-β and α-SMA was evaluated. Western blot analysis revealed that the M-HCC model increased TGF-β (p = 0.0005) and alpha-smooth muscle actin (α-SMA) (p = 0.0004) protein levels as compared with controls, NAR treatment partially reduced (p = 0.0125 and p = 0.0055, respectively) the level of these proteins (Fig. 6d,e). However, the NAR alone did not affect these levels.
3.5NAR prevents the preneoplastic lesions' appearance and cell proliferation in early hepatocarcinogenesisThe livers of the M-HCC model developed nodules and tumors, as detected by GGT activity and glutathione S-transferase pi 1 (GSTP1) levels, two HCC markers, and the level of KI67, a proliferation marker (Fig. 7a,b,c). These proteins were strongly induced in the livers of animals in the MASHHCC model. The GSTP1-positive area increased >30-fold (p = 0.0001), and the number of KI67-positive cells increased (p = 0.0001) in the M-HCC model.
 Macroscopic images of liver sections showing preneoplastic lesions detected by GGT activity (n = 5). (B) IHC staining of GSTP1 and KI67 proteins, and Masson")
Effect of NAR on fibrosis and preneoplastic lesion development.
(A) Macroscopic images of liver sections showing preneoplastic lesions detected by GGT activity (n = 5). (B) IHC staining of GSTP1 and KI67 proteins, and Masson's trichrome staining (n = 3). (C) Number of GGT-positive foci. (D) Percentage of GGT-positive area. (E) Plot of KI67-positive nuclei quantification. (F) Quantification of GSTP1-positive area. (G) Protein level GSTP1 by Western blot. In plots, bars represent the mean ± SEM obtained by two-way ANOVA statistical analysis. Statistically significant when compared with CTL (a) and M-HCC (b) groups; p < 0.05. control; M-HCC, MASH-driven HCC; NAR, naringenin; M-HCC+NAR, MASH-driven HCC administrated with naringenin.
In addition, the number of GGT-positive foci increased 86-fold (p = 0.0001) in M-HCC animals compared to that in controls; however, NAR treatment decreased (p = 0.0001) this number by 35 %. Similarly, the percentage of GGT-positive areas increased (p = 0.0001) in the M-HCC model; however, NAR treatment reduced (p = 0.0001) this percentage (Fig. 7d). Notably, NAR treatment strongly prevented (p = 0.0001) KI67 and GSTP1 levels (Fig. 7e,f). Increased (p = 0.0001) GSTP1 levels in M-HCC animals were corroborated by western blot analysis. In contrast, NAR administration prevented this increase (p = 0.0025; Fig. 7g).
3.6Docking analysis identifies potential interactions of NAR with possible therapeutic targets involved in the early HCC promoted by mashFig. 8 shows the binding affinity assays of NAR with NF-κB, IL-1β, IL-18, NLRP3, caspase-1, ASC, GSDMD, P2×7R, TXNIP, and ChREBP protein. Results indicated that NAR showed medium binding energy of −6.46 kcal/mol. The main interaction of NAR with NF-κB was with ASP215, LEU218, ILE219, LYS122, ILE46, and GLY48 amino acids, with a binding energy of −7.2 kcal/mol (Fig. 8a), IL-1β, and IL-18 presented a binding energy of −6.6 and −2.9 kcal/mol, respectively (Fig. 8b,c). IL-1β interacted with NAR through TYR24, LEU82, LEU80, and PRO78 amino acids and IL-18 through ARG104 and GLU116 residues.
 illustrates the interaction of amino acids and binding energy with NF-κB p65 (A), IL-1β (B), IL-18 (C), NLRP3 (D), caspase-1 (E), ASC (F), GSDMD (G), P2×7R (H), TXNIP (I), ChREBP (J) proteins.")
Molecular docking and binding energy of NAR with proteins involved in the NLRP3 inflammasome/pyroptosis pathway.
Molecular docking of naringenin (NAR) illustrates the interaction of amino acids and binding energy with NF-κB p65 (A), IL-1β (B), IL-18 (C), NLRP3 (D), caspase-1 (E), ASC (F), GSDMD (G), P2×7R (H), TXNIP (I), ChREBP (J) proteins.
Molecular docking between NLRP3 and NAR shows a medium binding energy of −8.2 kcal/mol and interacts with TYR443, ILE411, ALA227, ARG578, TYR632, and ASP662 residues (Fig. 8d). The docked energy of NAR with caspase-1 was −6.5 kcal/mol interacting with HIS237, GLN283, ALA284, ARG341, and CYS285 residues (Fig. 8e). Moreover, docking between ASC and NAR was −4.9 kcal/mol and interacted with PHE163, LEU192, LEU178, and LYS174 amino acids (Fig. 8f), and GSDMD showed a binding energy of −6.7 kcal/mol interacting with LEU49, PRO73, ASP47 and ALA53 residues (Fig. 8g).
The P2×7R docking energy with NAR was −8.3 kcal/mol interacting with ARG256, GLN195, TYR105, ASN191, VAL102, VAL190, CYS194, ASN159, PHE106, and SER156 amino acids (Fig. 8h). The binding energy of TXNIP protein was −6.6 kcal/mol interacting with TYR99, VAL89, ALA43, and GLU85 residues (Fig. 8i), and the affinity energy of NAR with ChERBP was −6.6 kcal/mol interacting with LEU174, ARG128, ARG129, ARG58 and TRP127 amino acids (Fig. 8j). The corresponding binding energies are presented in Table 3.
4DiscussionIn recent decades, the obesity epidemic has led to an increase in liver transplantation in MASH-associated HCC and is currently the second leading cause of liver transplantation in humans [31,32]. However, a lack of sufficient donors, liver rejection, and elevated costs render this procedure unsuitable for most patients [31]. Unfortunately, there are currently no effective pharmacological treatments for MASH-driven HCC. In this study, we found that NAR administration inhibited the pro-inflammatory NLRP3/pyroptosis pathway, profibrogenic TGF-β factor, and HSC activation, leading to the attenuation of inflammation and fibrosis. Moreover, NAR reduced GGT and GSTP1 levels and prevented an increase in the expression of the proliferation marker KI67. Notably, NAR treatment completely prevented the appearance of tumors in animals subjected to the M-HCC model. Therefore, our findings show that NAR inhibits the progression of MASH to HCC. Nevertheless, further basic and clinical research on the use of NAR in treating human MASH-driven HCC is imperative.
HCC typically develops during chronic liver inflammation, and the NLRP3 inflammasome/pyroptosis pathway plays a pivotal role in the inflammatory onset [33]. Similarly, MASH exacerbates the activation of this pathway, thereby generating harmful lipid compounds and increasing intestinal membrane permeability [9]. This leads to the release of pathogen-associated molecular patterns (PAMPs) or DAMPs, which are crucial for the assembly of NLRP3 active oligomers [34,35]. Extensive evidence has shown that during MASH, PAMPs or DAMPs bind to toll-like receptors on the cell membrane and trigger the activation of NF-κB signaling pathways, which are pivotal inflammatory factors in HCC progression [32,36]. This activation leads to the transcription of inflammasome components such as NLRP3, pro-IL-1β, and pro-IL-18, thereby perpetuating inflammation [36]. Oxidative stress also promotes the assembly of active NLRP3 oligomers by activating P2×7R or TXNIP, which leads to caspase-1 activation [33]. Upon activation, caspase-1 cleaves GSDMD at its N-terminus to convert pro-IL-1β and pro-IL-18 into their mature forms, namely IL-1β and IL-18, respectively [33,36]. Thus, the NLRP3 inflammasome/pyroptosis pathway is a potent promoter of inflammation and contributes to HCC progression [33,36]. Both the NLRP3 inflammasome and GSDMD must be in an oxidized state to exhibit activity, thereby underscoring the crucial role of reactive oxygen species in the regulation of this pathway [33,36,37].
Based on our M-HCC model, our research confirms that activation of the NLRP3 inflammasome/pyroptosis signaling pathway is crucial in the progression of HCC from MASH. We observed increased levels of NLRP3, caspase-1, and GSDMD proteins in our model, which consequently magnified IL-1β, and IL-18 production and release, and promoted inflammation and fibrosis. Importantly, our results suggest that the NLRP3 inflammasome contributes to the pathogenesis of HCC by increasing the metabolic activity and proliferation of cancerous cells.
In contrast, NAR, a trihydroxy flavanone found abundantly in fruits such as oranges, pomelos, grapefruits, tomatoes, fenugreek, and coffee, possesses diverse pharmacological and biological effects that are beneficial for human health, including antioxidant, anticancer, anti-inflammatory, antifungal, and antimicrobial properties [12,38]. Our previous studies have demonstrated the effectiveness of a 100 mg/kg NAR dose at mitigating inflammation and fibrosis in a liver damage model induced by CCl4; therefore, we used the same dose to investigate the pharmacological effect of NAR on MASHHCC progression [12]. Our findings indicate that NAR exhibits anti-inflammatory and anticancer properties that counteract fat accumulation, inflammation, and fibrosis, thereby suggesting that the beneficial effects of NAR stem from its ability to regulate lipid metabolism and inhibit the NLRP3 inflammasome/pyroptosis pathway. These results align with previous research thereby demonstrating the capability of NAR to deactivate the NLRP3 pathway via AhR in pancreatitis-linked intestinal injury [39]. Similarly, was elucidated the NAR suppression effect on NLRP3 inflammasome activation via the mRNA-208a signaling pathway in isoproterenol-induced myocardial infarction [40].
Our study revealed that NAR not only diminished NLRP3 inflammasome pathway activation but also reduced GSDMD formation, thereby impeding pyroptosis. We propose that NAR functions as a multitarget drug to prevent MASH. Firstly, by lowering NLRP3 and NF-κB p65 protein level, and secondly, by interacting with NF-κB p65, thereby impeding its translocation into cell nuclei and mitigating subsequent transcription of NLRP3, pro-IL-1β, and pro-IL-18. Additionally, NAR exhibited potent anticancer effects by reducing KI67, GGT, and GSTP1 levels; these are well-known markers associated with cell proliferation and hepatocarcinogenesis [41]. This suggests that NAR has additional mechanisms of action against MASHHCC progression, in addition to inhibition of the NLRP3 inflammasome/pyroptosis signaling pathway.
Docking results suggest that NAR may produce hepatoprotective effects through molecular interactions with NF-κB p65, NLRP3, ASC, caspase-1, IL-1β, IL-18, and GSDMD; furthermore, it revealed that NAR exhibits an affinity for TXNIP, P2×7R, and ChREBP, which supports its potential to attenuate NLRP3 inflammasome activation via non-canonical pathways. However, further studies are required to confirm these hypotheses.
5ConclusionsOur study highlighted the anti-steatotic, anti-inflammatory, anti-fibrotic, and anti-neoplastic properties of NAR in the early progression of HCC promoted by MASH while also offering a promising avenue for the treatment of this pathology. This therapeutic effect is closely associated with the inhibition of SREBP-1C, PPAR-γ, NLRP3 inflammasome, GSDMD, TGF-β, HSC, GGT, GSTP1, and KI67 (Fig. 9). Moreover, given the safety profile of NAR, our findings strongly support its use in treating MASH-driven HCC in humans. However, further investigations using both fundamental and clinical approaches are warranted to unravel the supplementary mechanisms underlying the molecular players implicated in the evolution from MASH to HCC. Additional basic and clinical studies are needed before NAR can be prescribed as a treatment for MASH-driven HCC.

NAR attenuates MASH-driven HCC by modulating chronic inflammatory microenvironment and cell proliferation.
This illustration depicts the possible molecular pathways by which NAR prevents MASH-driven HCC. The MASHHCC model triggers the release of PAMPs, such as lipopolysaccharides, and DAMPs, such as ATP. The DAMPs and PAMPs bind to TLR reducing PPAR-γ and activating SREBP-1c, ChREBP, and subsequently, the NF-κB pathway. This pathway upregulates NLRP3, IL-1β and IL-18. Molecular docking suggests that NAR interacts with NF-κB, reducing NLRP3, pro-IL-1β, and pro-IL-18 transcription. Moreover, NAR binds to P2×7R and TXNIP inhibiting NLRP3, ASC, and pro-caspase-1 oligomerization. NAR may block NLRP3 inflammasome activation, reducing activation of interleukin active forms, and preventing GSDMD pore formation, thereby averting pyroptosis. A chronic inflammatory environment triggered by NLRP3 inflammasome activation also promotes apoptosis. Both pyroptosis and apoptosis stimulate macrophages and the production of TGF-β profibrogenic factor, which activates HSC to produce α-SMA, contributing to fibrosis. Additionally, prolonged injury triggers compensatory cell proliferation, characterized by increased KI67 levels, which leads to the formation of GGT and GSTP1-positive, culminating in HCC development.
All authors have read and agreed to the published version of the manuscript.
CRediT authorship contribution statementLinda Vanessa Márquez-Quiroga: Conceptualization, Methodology, Software, Formal analysis, Investigation, Writing – original draft, Writing – review & editing. Aline Barboza-López: Methodology. Jose Y. Suárez-Castillo: Methodology. Irina Cardoso-Lezama: Methodology, Software. Miguel Á. Fuentes-Figueroa: Methodology, Software. Eduardo E. Vargas-Pozada: Methodology. Juan D. Rodriguez-Callejas: Methodology, Software. Erika Ramos-Tovar: Writing – original draft, Writing – review & editing. Carolina Piña-Vázquez: Writing – original draft, Writing – review & editing. Jaime Arellanes-Robledo: Writing – original draft, Writing – review & editing, Funding acquisition. Saúl Villa-Treviño: Writing – original draft, Writing – review & editing, Funding acquisition. Pablo Muriel: Conceptualization, Formal analysis, Investigation, Writing – original draft, Writing – review & editing, Supervision, Project administration, Funding acquisition.


