Introduction. Fatigue is an important clinical finding in the hepatitis virus chronic infection. However, the absence of scales to measure fatigue, translated and validated for Brazilian Portuguese, prevents access to information essential in clarifying specific clinical conditions in this population.
Aim. The aim of this study was to determine the psychometric properties of the fatigue impact scale for daily use (D-FIS), in Brazilian Portuguese, for patients with the hepatitis C virus (HCV) and hepatitis B virus (HBV) chronic infection.
Material and methods. In this cross-sectional study, the authors evaluated the D-FIS in 101 outpatients, followed at the reference hospital. The Mini International Neuropsychiatry Interview Brazilian (MINI PLUS) was used to identify psychiatric disorders, and the Short Form Health Survey 36-item (SF-36) to evaluate the self-reported quality of life. We also examined the impact of fatigue on the quality of life of this group of patients.
Results. Relevant psychometric D-FIS results were: floor effect proved to be 1%; skewness was 0.46; item homogeneity was 0.59 and SEM (SD = 8.51) was 2.4. The Cronbach’s alpha was 0.920 and item-total correlation yielded coefficients ranging from 0.65 (item 1) to 0.85 (item 3). In a linear regression model, fatigue and depression influenced the self-reported quality of life.
Conclusion. This study presents that the fatigue scale for daily use in Brazilian Portuguese can be considered a useful tool to verify the presence of fatigue in patients with the hepatitis viruses B and C.
Fatigue is an important clinical finding in different pathologies. It is a feeling of tiredness or exhaustion combined with impairment in the ability to perform daily activities and to find solutions in the absence of the usual strategies to recover energy, thereby negatively impacting quality of life. Thus, the study of fatigue becomes extremely challenging, as fatigue presents itself as a symptom of both mental disorders and physical illnesses, despite presenting different characteristics.1 Because fatigue is a subjective phenomenon, with multifactorial and little known etiology and phenomenology, and its expression involves physical, cognitive and emotional axes, authors have difficulty in coming to a consensus on its definition.2,3
Fatigue is characterized by physical symptoms such as lack of energy, tiredness, weakness, drowsiness, and decreased capacity for physical activity; cognitive symptoms such as reduced concentration and attention and slower thinking; and emotional symptoms such as reduced interest and motivation, boredom and the aversion to effort. Because of this variety of presentations, fatigue has been described as a clinical syndrome, or even a single symptom,4 that may be caused by a disease or infection process, or a side effect of the treatment with influenza medications, interferon or other chronic disease medications such as cancer, human immunodeficiency virus (HIV) and multiple sclerosis.5
Fatigue has been identified as very frequent in patients with chronic hepatitis C. In a study by Hassoun, et al.,6 which posits that 3% of the population worldwide are carriers of hepatitis C, fatigue was reported by 67% of patients, and cited by 49% as one of the worst symptoms, if not the worst. Moreover, in hepatitis C, fatigue is associated with depression and significantly limits work performance7 and quality of life, especially in the areas of physical dimensions and social relations.8
The self-reported experience of fatigue has not been associated with the severity of liver disease caused or not by hepatitis C virus (HCV), the level of viremia or disease duration.2,9 Meanwhile, research indicates that patients with HCV frequently associate other factors as having a significant role in the experience of fatigue, such as social functioning, psychological disorders, socioeconomic status, cognitive impairment and non-liver-related physiological factors.10
The fatigue impact scale (FIS)11 is a multidimensional scale and has proven to be a robust tool in investigating the impact of fatigue on the quality of life of various groups of patients. It has been one of the most widely used tools, translated and validated in 30 languages, and there now exists modified versions, such as the modified FIS (MFIS), the daily FIS (D-FIS), the unidimensional FIS and the abbreviated MFIS.12
The D-FIS was developed to assess daily changes in fatigue3,5 in individuals with various physical ailments, and has already been validated for patients with Parkinson’s disease13 and multiple sclerosis,14 in English and Spanish. It presents high internal consistency and constructs validity and sensitivity to change. However, the absence of scales to measure fatigue, translated and validated for Brazilian Portuguese, prevents access to information essential in clarifying specific clinical conditions for this target population. Therefore, studies directed toward the adequacy of instruments that can contribute to further development in this area are of great importance.
AIMThe aim of this study was to determine the psychometric properties of the D-FIS, in Brazilian Portuguese, for patients with the HCV and hepatitis B virus (HBV) chronic infection, followed at the reference hospital.
Material and MethodsAll consecutive patients (n = 101) diagnosed with HCV and HBV, over 18 years old, evaluated from June 2010 to May 2011 in the outpatient clinic of the Hepatology Service-University Hospital, at Federal University of Bahia, Brazil were investigated in this cross-sectional design study. The research included subjects from various stages of the patient evolution of the illness, such as: subjects during interferon plus ribavirin treatment, naïve patients and patients after treatment failed. Four trained researchers applied a protocol, consisting of a questionnaire with socio-demographic and clinical data, the Mini International Neuropsychiatric Interview Brazilian Version 5.0.0 (MINI PLUS),15 used for identification of psychiatric disorders, the D-FIS,5 and the Short Form Health Survey 36-item (SF-36).16
D-FIS was developed by means of Rasch analysis, which selects appropriate scale items for evaluation and was validated by a sample of 93 subjects with flu-like illnesses. It is a self-reported questionnaire that consists of 8 items, each describing one possible experience of fatigue. Patients are asked to rate the extent to which fatigue has been a problem for them in regard to each of these items, on a scale ranging from 0 (no problem) to 4 (extreme problem).5
The D-FIS was translated into Portuguese by two independent people fluent in English and aware of the purpose of this study. After that, a back translation to English was performed by a native English speaker. Because there was not a gold standard for fatigue assessment in Brazilian Portuguese, we used the SF-36, a reliable and valid quality of life outcome measure in Brazil.16 It is a multidimensional questionnaire consisting of 36 items, grouped within 8 domains. For this study, we used the domains ‘physical functioning’ consisting of ten items, ‘Role limitations due to physical health’ consisting of four items, ‘role limitations due to emotional problems’ consisting of three items and ‘vitality and energy’ consisting of four items. This instrument was chosen because the categorization of fatigue is consistent with the general constructs measured by these four domains of the SF-36 scale.
This research was considered a Class I Hazard, or low risk for the individual and collective, and followed the Guidelines and Standards Resolution 196/ 96 as well as the Helsinki Declaration of 1989 on Research Involving Human Subjects. The study was approved by the local Institutional Review Board (CEP-MCO-UFBA, Number: 14/2002). The subjects participated in the study only after being made aware of the objectives and procedures of the study and after voluntarily agreeing to participate in the study, signing an Informed Consent form.
StatisticsAll data were analyzed using the Data Analysis and Statistical Software STATA Version 11. To investigate the underlying structure of the scale, the responses of the total sample (n = 101) were subjected to a principal-component analysis with varimax rotation. From the factor analysis of items in the scale of fatigue, two components were defined as mainly responsible for the overall change of scale: factor 1 (F1) represented by physical fatigue, and factor 2 (F2) cognitive fatigue. From the extraction of these factors, we carried out the calculation of Pearson’s correlations. All correlations were statistically significant at p < 0.05. We calculated the coefficient of Kaiser-Meyer-Olkin (KMO) and Bartlett’s sphericity test, and the measure of commonality. The internal consistency of the FIS-D was evaluated with Cronbach’s alpha. Be cause of multiple comparisons, results were considered statistically significant when P < 0.01.
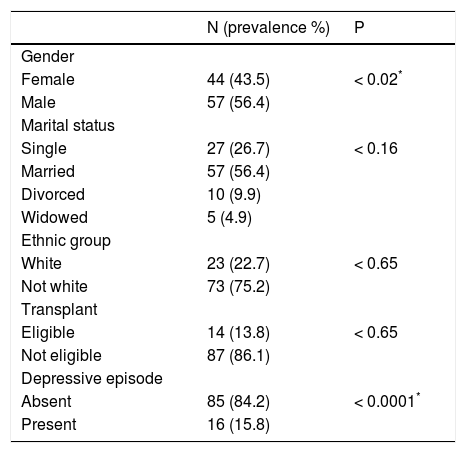
ResultsThe descriptive analysis of the socio-demographic data of the patients is presented in table 1. About 20.7% of the patients presented HBV infection; 73.2% of patients presented HCV infection and just 2.9% presented HBV and HCV infection. Regarding the severity of liver disease and the degree of fibrosis, all patients are A1F1. Marital status, type of viral infection, ethnic group, occupation and eligibility for transplant were unrelated to fatigue. Women and depressed patients showed increased fatigue levels (P < 0.05).
Demographic and clinical characteristics of patients.
| N (prevalence %) | P | |
|---|---|---|
| Gender | ||
| Female | 44 (43.5) | < 0.02* |
| Male | 57 (56.4) | |
| Marital status | ||
| Single | 27 (26.7) | < 0.16 |
| Married | 57 (56.4) | |
| Divorced | 10 (9.9) | |
| Widowed | 5 (4.9) | |
| Ethnic group | ||
| White | 23 (22.7) | < 0.65 |
| Not white | 73 (75.2) | |
| Transplant | ||
| Eligible | 14 (13.8) | < 0.65 |
| Not eligible | 87 (86.1) | |
| Depressive episode | ||
| Absent | 85 (84.2) | < 0.0001* |
| Present | 16 (15.8) |
† HBV: hepatitis B virus.
‡ HCV: hepatitis C virus.
The comparability between HCV and HBV subjects was tested before all validation analyses. Both groups were similar in socio-demographic and clinical variables and the analysis as only one group, HCV plus HBV was feasible.
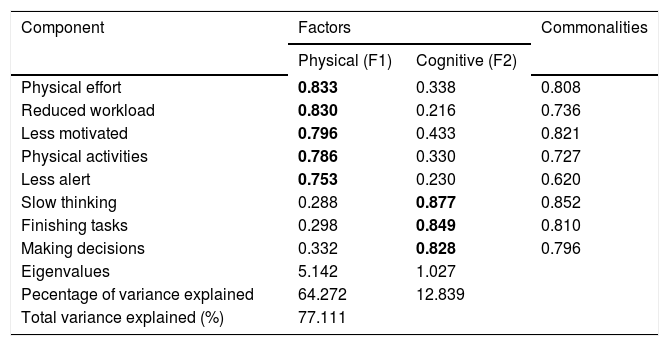
Metric properties of the D-FISTo examine the underlying structure of the scale, a principal-component analysis was performed with all data (n = 101). Two components with eigenvalues equal to or greater than 1.0 were extracted, which explained 77.1% of the total variance of the scale. The existing names of the subscales were used to label these components: physical and cognitive factors. The psychosocial factor presented eigenvalues less than 1.0. The results of the varimax rotation final factor are represented in table 2. The required item-factor loading higher than 0.700 was found in all items and was considered significant. The second item, assessing the impact of fatigue on the ‘need to reduce the workload or responsibilities’, was assigned to the physical factor, although it is part of the psychosocial subscale. We used the coefficient of Kaiser-Meyer-Olkin = 0.82 and Bartlett’s sphericity test with P < 0.0001, with the results indicating that the correlations between items of fatigue met the assumptions of factor analysis. The measure of commonality presents values above 0.60 which indicates that the variables of the scale of fatigue are well explained by factors generated.
Principal component factor analysis with varimax rotation.
| Component | Factors | Commonalities | |
|---|---|---|---|
| Physical (F1) | Cognitive (F2) | ||
| Physical effort | 0.833 | 0.338 | 0.808 |
| Reduced workload | 0.830 | 0.216 | 0.736 |
| Less motivated | 0.796 | 0.433 | 0.821 |
| Physical activities | 0.786 | 0.330 | 0.727 |
| Less alert | 0.753 | 0.230 | 0.620 |
| Slow thinking | 0.288 | 0.877 | 0.852 |
| Finishing tasks | 0.298 | 0.849 | 0.810 |
| Making decisions | 0.332 | 0.828 | 0.796 |
| Eigenvalues | 5.142 | 1.027 | |
| Pecentage of variance explained | 64.272 | 12.839 | |
| Total variance explained (%) | 77.111 | ||
Extraction method: principal component analysis. Rotation method: varimax with Kaiser Normalization (factor loading higher than 0.700 was considered significant). F1: factor 1. F2: factor 2.
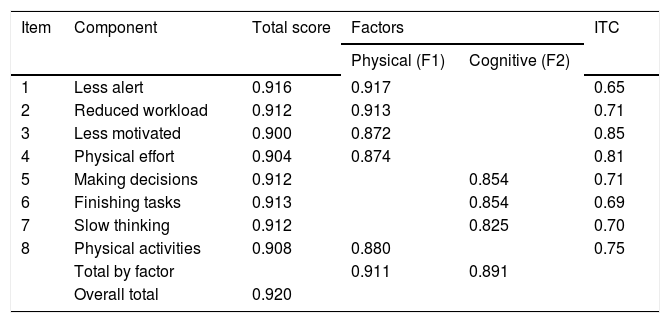
The D-FIS mean (9.81; SD = 8.5) was close to the median (9). Insofar as distribution data was concerned, floor and ceiling effects proved to be 1% and 19.8% (limits: 1-15%), respectively. Skewness for the total D-FIS score was 0.46. Item distribution of response options was considerably homogeneous, with mean scores ranging from 0.81 (item 5) to 1.65 (item 4), variances from 1.4 (item 5) to 2.1 (item 4), and a standard error of means from 0.11 to 0.14. Item total correlation yielded coefficients ranging from 0.65 (item 1) to 0.85 (item 3) (Table 3).
Internal consistency analysis of fatigue impact scale for daily use (FIS-D): Cronbach’s alpha if item deleted.
| Item | Component | Total score | Factors | ITC | |
|---|---|---|---|---|---|
| Physical (F1) | Cognitive (F2) | ||||
| 1 | Less alert | 0.916 | 0.917 | 0.65 | |
| 2 | Reduced workload | 0.912 | 0.913 | 0.71 | |
| 3 | Less motivated | 0.900 | 0.872 | 0.85 | |
| 4 | Physical effort | 0.904 | 0.874 | 0.81 | |
| 5 | Making decisions | 0.912 | 0.854 | 0.71 | |
| 6 | Finishing tasks | 0.913 | 0.854 | 0.69 | |
| 7 | Slow thinking | 0.912 | 0.825 | 0.70 | |
| 8 | Physical activities | 0.908 | 0.880 | 0.75 | |
| Total by factor | 0.911 | 0.891 | |||
| Overall total | 0.920 | ||||
F1: factor 1. F2: factor 2. ITC: item-total correlation.
The internal consistency analysis is shown in Table 3. The overall Cronbach’s alpha was 0.920, with 0.911 for physical and 0.891 for cognitive factors of the scale. A Cronbach’s alpha coefficient value 0.70 was considered the lowest acceptable limit.17 A Cronbach’s alpha of each item deleted also presents results lower than the overall Cronbach’s alpha. These results indicate high internal validity and homogeneity of D-FIS, because these items are not redundant, and therefore, necessary for the homogeneity of the scale. Inter-item correlation coefficients attained values from 0.38 (items 1-7) to 0.8 (items 4-8), and item homogeneity was 0.59. The sensitivity SEM (SD = 8.51) was 2.4. Sensitivity is the type of internal responsiveness to change and is defined as the capacity of a measure to change in a determined lapse of time and may be computed as standard error of measurement. In the case of the application of an effective treatment, the sensitivity to change depends on two elements: the measure used to assess the treatment and the treatment itself.18,19
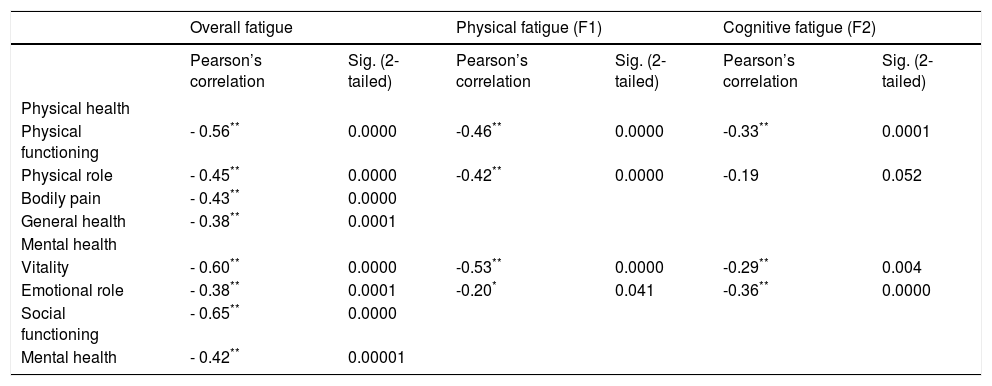
Pearson’s correlations of levels of fatigue versus the four components of quality of life (Table 4) present a weak negative correlation between cognitive fatigue (F2) and areas of limitation due to physical functioning and vitality. Physical fatigue (F1) had moderate negative correlations with the four domains of quality of life assessed, as well as cognitive fatigue, which also had a moderately negative correlation with the areas of functional capacity and limitation by emotional aspects. All correlations were statistically significant at p < 0.05.
Pearson’s correlations of levels of fatigue vs. components of quality of life.
| Overall fatigue | Physical fatigue (F1) | Cognitive fatigue (F2) | ||||
|---|---|---|---|---|---|---|
| Pearson’s correlation | Sig. (2-tailed) | Pearson’s correlation | Sig. (2-tailed) | Pearson’s correlation | Sig. (2-tailed) | |
| Physical health | ||||||
| Physical functioning | - 0.56** | 0.0000 | -0.46** | 0.0000 | -0.33** | 0.0001 |
| Physical role | - 0.45** | 0.0000 | -0.42** | 0.0000 | -0.19 | 0.052 |
| Bodily pain | - 0.43** | 0.0000 | ||||
| General health | - 0.38** | 0.0001 | ||||
| Mental health | ||||||
| Vitality | - 0.60** | 0.0000 | -0.53** | 0.0000 | -0.29** | 0.004 |
| Emotional role | - 0.38** | 0.0001 | -0.20* | 0.041 | -0.36** | 0.0000 |
| Social functioning | - 0.65** | 0.0000 | ||||
| Mental health | - 0.42** | 0.00001 | ||||
As shown in table 4, Pearson’s correlations of levels of fatigue vs. the components of quality of life present a moderately negative correlation (r = -0.38 to -0.64, P < 0.001). These results confirm that, in our study, fatigue is inversely proportional to the subjects’ quality of life perception.
Results of the linear regression analysis, which took SF-36 domains as a dependent variable, are shown in table 5. The analyses suggest that fatigue is an important independent variable, which can be a determinant of the deterioration of quality of life. However, depression was identified as an independent significant predictor or impairment of the absolute fatigue score (P < 0.01). The smallest percentage variation (Δ%) between the crude and adjusted difference, in this analysis, was 7.13% in the physical role domain, while the greatest (52.93%) appears in the mental health domain.
Linear regression-fatigue as an explanatory variable for quality of life, adjusted for diagnosis of major depression.
| SF-36 domains | Crude difference | Adjusted difference | Δ% | ||||
|---|---|---|---|---|---|---|---|
| Coef. (Std. Err) | p | Adj R-squared | Coef. (Std. Err) | p | Adj R-squared | ||
| Physical health | |||||||
| Physical Functioning | -1.56 (0.23) | 0.000 | 0.31 | -1.38 (0.24) | 0.000 | 0.33 | 11.39 |
| Physical Role | -2.31 (0.46) | 0.000 | 0.19 | -2.14 (0.49) | 0.000 | 0.19 | 7.13 |
| Bodily Pain | -1.77 (0.24) | 0.000 | 0.35 | -1.31 (0.23) | 0.000 | 0.49 | 26.37 |
| General Health | -1.79 (0.43) | 0.000 | 0.14 | -1.26 (0.45) | 0.006 | 0.21 | 29.69 |
| Mental health | |||||||
| Vitality | -1.46 (0.31) | 0.000 | 0.18 | -1.07 (0.32) | 0.001 | 0.25 | 26.94 |
| Emotional Role | -0.96 (0.23) | 0.000 | 0.14 | -0.71 (0.24) | 0.005 | 0.19 | 26.37 |
| Social Functioning | -2.19 (0.26) | 0.000 | 0.41 | -1.71 (0.25) | 0.000 | 0.52 | 21.61 |
| Mental Health | -1.07 (0.23) | 0.000 | 0.17 | -0.50 (0.20) | 0.015 | 0.46 | 52.93 |
Despite the relevance of fatigue in the context of different chronic diseases, to our knowledge, no objective scale for its measurement is validated in Portuguese. This is the first cross-sectional study evaluating the use of D-FIS with HBV and HCV infection patients in Brazilian Portuguese. We therefore consider it important because although data is scarce, estimates indicate that in Brazil, the prevalence of HCV infection is intermediate, ranging from 1 to 2%20 and fatigue is one of the most common complaints of patients, occurring independently of liver disease and impairing their ability to function at work or in society.21
In the current study, the metric properties presented are the following: the mean score was near the median; skewness and ceiling effects were located within the agreed limit. The floor effects (i.e., all eight items are presented with ‘no problems’ by subjects) were higher than the limit (15%), which means that 19.8% of the subjects’ responses did not demonstrate goodness of fit statistics. This result may be related to the fact that most subjects in this subgroup were men (70%), who presented lower fatigue levels. Nevertheless, feasibility and acceptability were considered satisfactory, as were the scaling assumptions: item response options registered a homogeneous distribution, and item-total correlation coefficients were clearly higher than the criterion value, and close to those of previous studies.5,13,14 The D-FIS Cronbach’s alpha (0.92) proved satisfactory even for individual comparisons17,22 and, once again, similar to the value obtained in the original study (α = 0.91). Furthermore the item homogeneity value (0.59) was indicative of a moderate-to-high intercorrelation between scale components. With these results, it is possible to conclude that D-FIS internal consistency can be deemed satisfactory, just as the resulting sensitivity (SEM = 2.14) that may be used as an indicator of precision and potential responsiveness.17
In the absence of a fatigue measurement tool accepted for universal use in Brazilian Portuguese, this study administrated the SF-36, a multidimensional questionnaire for generic assessment of health, for which measurement properties such as reproducibility, validity and sensitivity to change have already been demonstrated in other studies. The results demonstrate that fatigue is associated with perceived quality of life of the components evaluated by the SF-36 scale, which was determined as the standard tool for this study.
The physical factor, extracted from D-FIS by varimax rotation, which presents the most variance (64%) explained, indicates that the D-FIS is more effective at identifying possible worsening of fatigue related to particular physical symptoms, in our sample. This fact is corroborated by the moderate association of this factor with domains related in SF-36, such as ‘physical functioning’, ‘physical role’ and ‘vitality’ and a weak correlation with ‘emotional role’. Although the cognitive factor, which presents 13% of variance explained, has a moderate association with ‘physical functioning’ in SF-36, it has no association with ‘physical role’ even if it has a tendency to correlate. The cognitive factor, in D-FIS, also presents association with the mental health domains of SF-36. These results indicate that D-FIS is a feasible instrument for measuring related fatigue in patients with viral hepatitis.
The linear regression analysis identified the effect of depression, associated with fatigue, as a predictor of impairment of the self-reported quality of life. Depression presents a modifying effect of fatigue in all eight domains of SF-36, except those related to ‘physical functioning’ and ‘physical role’, for which it presents a confounding effect. These results suggest that the presence of depressive symptoms is associated with the increasing severity of fatigue, and its impact on mental and social aspects of the self-reported quality of life. However, we must consider that the D-FIS is a better instrument for identifying physical characteristics which have a lower correlation for depression.
In the current study, overall fatigue was associated with self-reported quality of life in all domains, especially social functioning, vitality and physical functioning. Similar results were found by Marcellin, et al.8 who studied depression and fatigue in 115 HIV-HCV co-infected patients.
This study has a number of limitations. The size and characteristics of this consecutive clinical sample restrict generalization of results. Furthermore, the widespread location of subjects prevented the use of a methodology that allows for calculations of other psychometric properties such as responsiveness and reproducibility. Another limitation is that the cross-sectional survey does not investigate the chronological relationship between fatigue and depression, and their interaction upon the self-reported quality of life.
It is important to emphasize that the absence of directed studies of the impact of fatigue in viral hepatitis patients’ lives in Brazil could be related to the fact that there are no appropriate, widely used instruments for these patients. An appropriate instrument would allow effective targeting of therapeutic strategies aimed at physical and social relation dimensions of quality of life, which are the most affected by fatigue in our sample. Moreover, such an instrument would allow for fatigue management even before starting HCV treatment with interferon, which brings a host of side effects, including fatigue and depression.
This study concludes that the fatigue scale for daily use in Brazilian Portuguese can be considered a useful tool to verify the presence of fatigue in patients with hepatitis viruses B and C. This instrument can contribute to the future development of specific treatments to reduce the impact of fatigue on the quality of life of these patients.
Abbreviations- •
D-FIS: fatigue impact scale for daily use.
- •
HCV: hepatitis C virus.
- •
HBV: hepatitis B virus.
We are grateful to Dr. André Lyra for his technical assistance and to Angela Burkholder de Oliveira for proofreading. The authors declare that they have no conflict of interest.
This project was partially supported by the National Council of Technological and Scientific Development (CNPq): [474869/2010-5] - Edital Universal MCT/CNPq 14/2010.


