


Chronic liver disease (CLD) globally results in about 2 million annual deaths [1]. Fibrosis in CLD signals a critical turning point, impacting prognosis [2,3], the primary causes of which are alcohol-related liver disease (ALD) and non-alcoholic fatty liver disease (NAFLD). Early fibrosis detection allows targeted interventions to curb progression and enhance survival [4]. Efficient referral pathways are vital.
While liver biopsy is the gold standard for hepatitis and fibrosis assessment, its invasiveness, sampling errors, and observer variations make it unfeasible for routine screening [5]. Noninvasive tests (NITs) have transformed hepatology, reducing the need for liver biopsy. Transient elastography (TE) is the current standard for noninvasive liver fibrosis diagnosis [6], extensively validated for various CLD [7-9]. Given that TE is limited by availability, a blood-based tool could serve as a primary care gatekeeper. The Fibrosis-4 (FIB-4) and NAFLD fibrosis score (NFS) are non-patented blood-based NITs with good reproducibility recommended by the European Association for the Study of the Liver (EASL) guidelines for primary care, despite the low accuracy reported in the low-prevalence of advanced fibrosis populations [10,11].
The steatosis-associated fibrosis estimator (SAFE) score is a recent tool designed for primary care to estimate clinically significant liver fibrosis in NAFLD subjects. Unlike the enhanced Liver Fibrosis (ELF) test using commercially available indexes [12], SAFE utilizes readily available variables including age, body mass index (BMI), diabetes status, aminotransferase levels, globulin, and platelet count. It is also reported to outperform FIB-4 and NFS in identifying low-risk NAFLD patients and predicting survival [13]. Given these promising results in NAFLD cases, we are interested in exploring whether the SAFE-based referral strategy can be applied to both the general population and at-risk groups defined by EASL guidelines [6]. Additionally, validating the SAFE score across different liver diseases and its correlation with clinical outcomes are essential.
In this three-part study, we assessed FIB-4, NFS, and SAFE in screening the general population in the National Health and Nutrition Examination Surveys (NHANES) cohort (2017–2020) with TE as a fibrosis screening reference. In a separate large population-based study from an Asian center (2018–2020), we evaluated the diagnostic performance of these NITs in patients with various etiologies using liver biopsy as a reference. Finally, we applied the NITs on the adults from the NHANES cohort (1999–2016) to study their correlation with mortality outcomes.
2Patients and methods2.1Study overviewThis was a three-part study involving the performance of NITs in fibrosis staging and prognosis prediction. Fig. 1 presents the participant selection flowchart. We included adults from the National Health and Nutrition Examination Survey cohort (NHANES) in Study Part 1 (2017–2020) to compare the diagnostic accuracy of the SAFE score with respect to the FIB-4 and NFS. TE was used as fibrosis screening reference. Study Part 2 comprises consecutive patients who underwent liver biopsy for disease diagnosis or staging at the Third Affiliated Hospital of the Sun Yat-sen University (Guangzhou, Guangdong, China) between January 2018 and December 2020. We evaluated the performance of NITs in staging fibrosis in various liver diseases, using histologic examination as reference. In Study Part 3, participants were drawn from nine additional rounds of continuous NHANES (1999–2016). Follow up and mortality data were obtained by linking the NHANES data to National Death Index (NDI) through National Center for Health Statistics (NCHS) public-use linked datasets. Using this datasets, we evaluated the NIT's capacity to predict all-cause mortality outcomes in the general U.S. population.
 Participants selection flow chart in the NHANES cohort (2017–2020). (B) Participants selection flow chart in adults underwent liver biopsy in an Asian center (2018–2020). (C) Participants selection flow chart in the NHANES cohort (1999–2016). Participants at risk for chronic liver disease were defined according to the EASL guideline as having either metabolic syndrome (based on the ATP-III criteria) or excessive alcohol consumption (≥20 g/d for women and ≥30 g/d for men) or viral hepatitis. Viral hepatitis were excluded from this analysis since they require referral regardless of non-invasive test outcomes. ALD, alcohol-related liver disease; CSLD, cholestatic liver disease; DILI, drug-induced liver injury; EAC, excessive alcohol consumption; EASL, European Association for the Study of the Liver; FIB-4, Fibrosis-4 Index for Liver Fibrosis; MetS, Metabolic syndrome; NAFLD, non-alcoholic fatty liver disease; NFS, Nonalcoholic Fatty Liver Disease Fibrosis Score; NHANES, National Health and Nutrition Examination Survey; SAFE, Steatosis-Associated Fibrosis Estimator; VH, viral hepatitis.")
Participant selection flow chart. (A) Participants selection flow chart in the NHANES cohort (2017–2020). (B) Participants selection flow chart in adults underwent liver biopsy in an Asian center (2018–2020). (C) Participants selection flow chart in the NHANES cohort (1999–2016).
Participants at risk for chronic liver disease were defined according to the EASL guideline as having either metabolic syndrome (based on the ATP-III criteria) or excessive alcohol consumption (≥20 g/d for women and ≥30 g/d for men) or viral hepatitis. Viral hepatitis were excluded from this analysis since they require referral regardless of non-invasive test outcomes.
ALD, alcohol-related liver disease; CSLD, cholestatic liver disease; DILI, drug-induced liver injury; EAC, excessive alcohol consumption; EASL, European Association for the Study of the Liver; FIB-4, Fibrosis-4 Index for Liver Fibrosis; MetS, Metabolic syndrome; NAFLD, non-alcoholic fatty liver disease; NFS, Nonalcoholic Fatty Liver Disease Fibrosis Score; NHANES, National Health and Nutrition Examination Survey; SAFE, Steatosis-Associated Fibrosis Estimator; VH, viral hepatitis.
Regarding the NHANES studies, detailed procedures and information can be found elsewhere [14]. We collected individual-level data from participants, including demographics, body mass index (BMI), blood pressure (BP), and laboratory tests associated with metabolism and liver function. NHANES is approved by researchers at the Centers for Disease Control and Prevention, and all participants provided informed consent.
Regarding the part 2, the medical records of the participants were reviewed to investigate each patient's clinical characteristics, including age, sex, BMI, baseline laboratory data, biopsy results and discharge diagnoses. Part 2 of the study was approved by the Institute Research Ethics Committees of the Asian center. All participants provided written informed consent prior to liver biopsy.
2.2ParticipantsIn part 1, demographic characteristics, physical examination, laboratory test and questionnaire data of 9693 adults were reviewed. Patients were excluded if: (1) ineligible elastography examination results, (2) serologic positivity for viral hepatitis B or C (n = 42), (3) previously known liver disease, (4) missing data for FIB-4, NFS or SAFE calculations. Participants at risk for CLD were defined according to the EASL guidelines as having either metabolic syndrome (based on the ATP-III criteria [15]) or viral hepatitis or excessive alcohol consumption (>20 g/d for women and >30 g/d for men) [16], which was estimated by the frequency and amount of alcohol consumed per drinking day. Participants with viral hepatitis or known liver disease were excluded since they required referral regardless of the NITs outcomes (Fig. 1A).
In part 2, adults who underwent liver biopsy at this Asian center between January 2018 and December 2020 were initially included. Cases were excluded if: (1) hepatic malignancies presence (n = 31), (2) inadequate biopsy samples (n = 18), (3) missing data for FIB-4, NFS or SAFE calculations (n = 68). Laboratory examinations were conducted within one month before the liver biopsy. With reference to the instructions of the EASL guidelines [6], we classified the etiologies as follows: viral hepatitis, NAFLD, ALD, autoimmune liver disease or cholestatic liver disease and the remaining cases were assigned as other etiologies (Fig. 1B).
In part 3, adults (≥18 years) were identified. Specifically, we excluded individuals without follow-up data (n = 93). Subjects without adequate parameters for the NITs calculations (n = 6898) were also excluded (Fig. 1C). The vital statuses of NHANES subjects from 1999 to 2016 was ascertained until December 31, 2019. The follow-up period, measured in months, commenced at the time of the examination at a mobile examination center and extended until either the participant's death or the end of the follow-up period.
2.3Clinical and laboratory evaluationsObesity was defined as a BMI ≥ 30 kg/m2. Metabolic syndrome was defined according to the ATP III criteria based on the estimation of waist circumference, blood pressure, blood glucose, triglyceride and HDL-C level [15]. Diabetes was defined as using antidiabetic medication or a fasting glucose level ≥126 mg/dl or HbA1C ≥6.5 %. An individual with hypertension was defined as having a BP ≥130/85 mmHg or was treated for hypertension.
FIB-4 and NFS were calculated as previously described [6]. Based on the current guidelines, the corresponding cutoff values were applied: FIB-4 ≥ 1.3, and NFS ≥−1.45 [6]. The age-dependent cutoffs of FIB-4 (2.0 instead of 1.3), and NFS (0.12 instead of −1.455) were applied for individuals aged ≥65 years [17]. The formula of SAFE is expressed below, which could also be calculated online (https://medcalculators.stanford.edu/safe):
SAFE = 2.97*age + 5.99*BMI (BMI>40 was set to 40) + 62.85*diabetes (0 if absent, 1 if present) + 154.85*Ln(AST,U/L) - 58.23*Ln(ALT, U/L) + 195.48*Ln(globulin, g/dL) - 141.61*Ln (platelets, 109) - 75.
Performance of the SAFE was evaluated based on the proposed cutoffs of 0 and 100.
Since ultrasound examinations were unavailable in the NHANES cohort (1999–2016), we defined NAFLD as having a US fatty liver index (USFLI) score greater than 30, with an area under the receiver operating characteristic curve (AUROC) of 0.80 (sensitivity, 62 %; specificity, 88 %) [18]. To confirm our findings, we conducted a sensitivity analysis using the hepatic steatosis index (HSI), another established diagnostic algorithm for NAFLD (HSI >36) with an AUROC of 0.81 (sensitivity, 46 %; specificity, 92 %) [19]. Details of the formulas for the noninvasive models, as well as the USFLI and HSI, are presented in Supplemental Table 1.
2.4Vibration controlled transient elastography examinationLiver stiffness and hepatic steatosis were assessed via FibroScan (EchoSens, Paris, France) via vibration-controlled transient elastography (VCTE) and the controlled attenuation parameter (CAP). Details of the standard examination procedure are available elsewhere [14]. Patients whose screening results were positive (TE ≥8 kPa) were regarded as eligible patients for referral [20]. A TE ≥12 kPa was regarded as an optimal cutoff for ruling in advanced liver fibrosis (≥ stage 3) [21]. The presence of significant hepatic steatosis was defined as a CAP≥248 dB/m [22].
2.5Pathological examinationUltrasound-guided liver biopsies were conducted using 16- or 18-gauge automated edge-cutting biopsy needles (Bard Magnum). All liver specimens were fixed in formalin and paraffin-embedded for histological processing. A minimum of 20 mm of liver tissue or at least 11 portal tracts was required. Two experienced pathologists, blinded to the clinical data, assessed the liver histology. Fibrosis staging followed the Scheuer scoring system, with five stages. Significant fibrosis and advanced fibrosis were defined as pathological stages ≥S2 and ≥S3, respectively. In cases of inconsistent staging, specimens were reexamined until a consensus was reached.
2.6Statistical analysisStatistically significant differences between the AUROC curves of FIB-4, NFS and SAFE were calculated using the methods implemented in the DeLong test for different TE strata and different fibrosis stages. To evaluate the performance metrics of the NITs with different cutoffs, true positive (TP), true negative (TN), false positive (FP) and false negative (FN) values were counted. Then, we calculated the measurements, sensitivity, specificity, positive predictive value (PPV), and negative predictive value (NPV) as follows: sensitivity = TP/(TP+FN), specificity = TN/(TN+FP), PPV = TP/(TP+FP), and NPV = TN/(TN+FN). The referral spared rate was calculated as (TN+FN)/(TP+TN+FP+FN). A missed TE ≥ 8 kPa rate or a missed TE ≥ 12 kPa rate (in other words, false negative rate) were calculated as FN/(FN+TP). The McNemar test was used to assess differences between paired proportions (sensitivities, specificities, the proportion of false-negative, the proportion of false-positive, the referral spared rate, the missed TE ≥ 8 kPa rate, and the missed TE ≥12 kPa rate). Multivariable Cox proportional hazards regression models (adjusted for age, sex, race, hypertension, diabetes and metabolic syndrome) estimated hazard ratios for all-cause mortality stratified by different NITs with validated cutoffs. Discriminative ability was estimated using Harrell's C-index. A P value <0.05 signified statistical significance, and data analysis employed R software (version 4.1.3).
2.7Ethical statementThe National Health and Nutrition Examination Surveys (NHANES) survey was approved by the Disease Control and Prevention (CDC) ethics review board in the United States. Part 2 of the study was approved by the local hospital's ethics committee. Written informed consent was obtained from each patient included in the study and the study protocol conforms to the ethical guidelines of the 1975 Declaration of Helsinki as reflected in a priori approval by the Ethics Committee of the Affiliated Hospital of University from East Asia ([2019]02–530–01). Researchers at the Centers for Disease Control and Prevention approved the NHANES (NHANES 1999–2004: Protocol #98–12; NHANES 2005–2010: Protocol #2005–06; NHANES 2011–2016: Protocol #2011–17; NHANES 2017–2020: Protocol #2011–17 and Protocol #2018–01), which all participants agree to participate with informed consent.
3Results3.1Performance of the NITs for detecting elevated liver stiffnessIn part 1, a total of 6677 adults were included in the final analysis, with 3260 participants at risk for CLD. Table 1 shows the baseline characteristics of the included subjects. Overall, 3275 (49.5 %) patients were male, and the mean age was 48.5 years (standard deviation, 18.3 years). In the general population and the subgroup at risk for CLD, 595 (8.9 %) and 441 (13.5 %) were screening positive (TE ≥8 kPa). Using TE as reference, SAFE outperformed FIB-4 in staging TE ≥8 kPa (AUC = 0.730 vs. 0.602, P < 0.01) and TE ≥12 kPa (AUC = 0.789 vs. 0.648, P < 0.01). SAFE was superior to NFS in staging TE ≥8 kPa (AUC = 0.730 vs. 0.707, P < 0.01), while it showed similar performance in staging TE ≥12 kPa (AUC = 0.789 vs. 0.766, P = 0.07) (Fig. 2).
Characteristics of the study participants in NHANES cohort (2017–2020).
| General population (n = 6677) | At-risk population (n = 3260)* | |
|---|---|---|
| Age | 48.5 ± 18.3 | 55.2 ± 16.5 |
| Gender, male (%) | 3275 (49.1) | 1715 (52.6) |
| Race | ||
| Mexican American (%) | 833 (12.5) | 413 (12.7) |
| Other Hispanic (%) | 683 (10.2) | 332 (10.2) |
| Non-Hispanic White (%) | 2327 (34.9) | 1219 (37.4) |
| Non-Hispanic Black (%) | 1680 (25.2) | 801 (24.6) |
| Other race (%) | 1154 (17.3) | 495 (15.2) |
| BMI (kg/m2) | 29.6 ± 7.2 | 31.9 ± 7.0 |
| Waist (cm) | 99.6 ± 16.6 | 107 ± 15.2 |
| Hypertension (%) | 3080 (46.1) | 2303 (70.6) |
| Metabolic syndrome (%) | 2828 (42.4) | 2828 (86.7) |
| Alcohol⁎⁎ (%) | 2237 (33.5) | 699 (21.4) |
| Obese⁎⁎⁎ (%) | 2683 (40.2) | 1796 (55.1) |
| Diabetes (%) | 1044 (15.6) | 931 (28.6) |
| Serum tests | ||
| Platelets (109/L) | 247.8 ± 64.3 | 248.0 ± 66.6 |
| ALT (U/L) | 21.6 ± 16.1 | 23.9 ± 17.1 |
| AST (U/L) | 21.3 ± 11.8 | 22.0 ± 12.4 |
| ALB (g/L) | 40.8 ± 3.3 | 40.3 ± 3.3 |
| GGT (U/L) | 29.7 ± 40.0 | 36.4 ± 49.4 |
| Fasting glucose (mmol/L) | 5.8 ± 2.0 | 6.4 ± 2.5 |
| Glycohemoglobin | 5.8 ± 1.1 | 6.2 ± 1.3 |
| Fibrosis markers | ||
| FIB4 | 1.03 ± 0.8 | 1.2 ± 1.0 |
| NFS | −1.40 ± 1.6 | −0.7 ± 1.5 |
| SAFE | −12.67 ± 99.7 | 28.6 ± 94.7 |
| TE, kpa | 5.7 ± 4.4 | 6.2 ± 4.9 |
| CAP, dB/m | 262.7 ± 62.0 | 288.1 ± 58.8 |
| TE ≥ 8 kpa (%) | 595 (8.9) | 441 (13.5) |
| TE ≥ 12 kpa (%) | 188 (2.8) | 142 (4.4) |
Reported as mean ± standard deviation.
ALB, albumin; ALD, alcohol-related liver disease; ALT, alanine transaminase; AST, aspartate transaminase; BMI, body mass index; CAP, controlled attenuation parameter; EASL, European Association For the Study of the Liver; FIB-4, Fibrosis-4 Index for Liver Fibrosis; GGT, gamma-glutamyl transferase; NAFLD, non-alcoholic fatty liver disease; NFS, Nonalcoholic Fatty Liver Disease Fibrosis Score; SAFE, Steatosis-Associated Fibrosis Estimator; TE, transient elastography.
. (A) Diagnostic performance of FIB-4, NFS and SAFE for staging TE ≥8 kPa in general population. The AUCs of FIB-4, NFS and SAFE are 0.602, 0.707, and 0.73, respectively. (B) Diagnostic performance of FIB-4, NFS and SAFE for staging TE ≥12 kPa in general population. The AUCs of FIB-4, NFS and SAFE are 0.648, 0.766, and 0.789, respectively. (C) Diagnostic performance of FIB-4, NFS and SAFE to detect TE ≥8 kPa in at-risk populations. The AUCs of FIB-4, NFS and SAFE are 0.567, 0.655, and 0.688, respectively. (D) Diagnostic performance of FIB-4, NFS and SAFE to detect TE ≥ 12 kPa in at-risk populations. The AUCs of FIB-4, NFS and SAFE are 0.645, 0.722, and 0.771, respectively. AUC, area under the receiver operating curve; FIB-4, Fibrosis-4 Index for Liver Fibrosis; NHANES, National Health and Nutrition Examination Survey;.")
Diagnostic performance of FIB-4, NFS, and SAFE for TE ≥8 kPa and ≥12 kPa in the NHANES cohort (2017–2020). (A) Diagnostic performance of FIB-4, NFS and SAFE for staging TE ≥8 kPa in general population. The AUCs of FIB-4, NFS and SAFE are 0.602, 0.707, and 0.73, respectively. (B) Diagnostic performance of FIB-4, NFS and SAFE for staging TE ≥12 kPa in general population. The AUCs of FIB-4, NFS and SAFE are 0.648, 0.766, and 0.789, respectively. (C) Diagnostic performance of FIB-4, NFS and SAFE to detect TE ≥8 kPa in at-risk populations. The AUCs of FIB-4, NFS and SAFE are 0.567, 0.655, and 0.688, respectively. (D) Diagnostic performance of FIB-4, NFS and SAFE to detect TE ≥ 12 kPa in at-risk populations. The AUCs of FIB-4, NFS and SAFE are 0.645, 0.722, and 0.771, respectively.
AUC, area under the receiver operating curve; FIB-4, Fibrosis-4 Index for Liver Fibrosis; NHANES, National Health and Nutrition Examination Survey;.
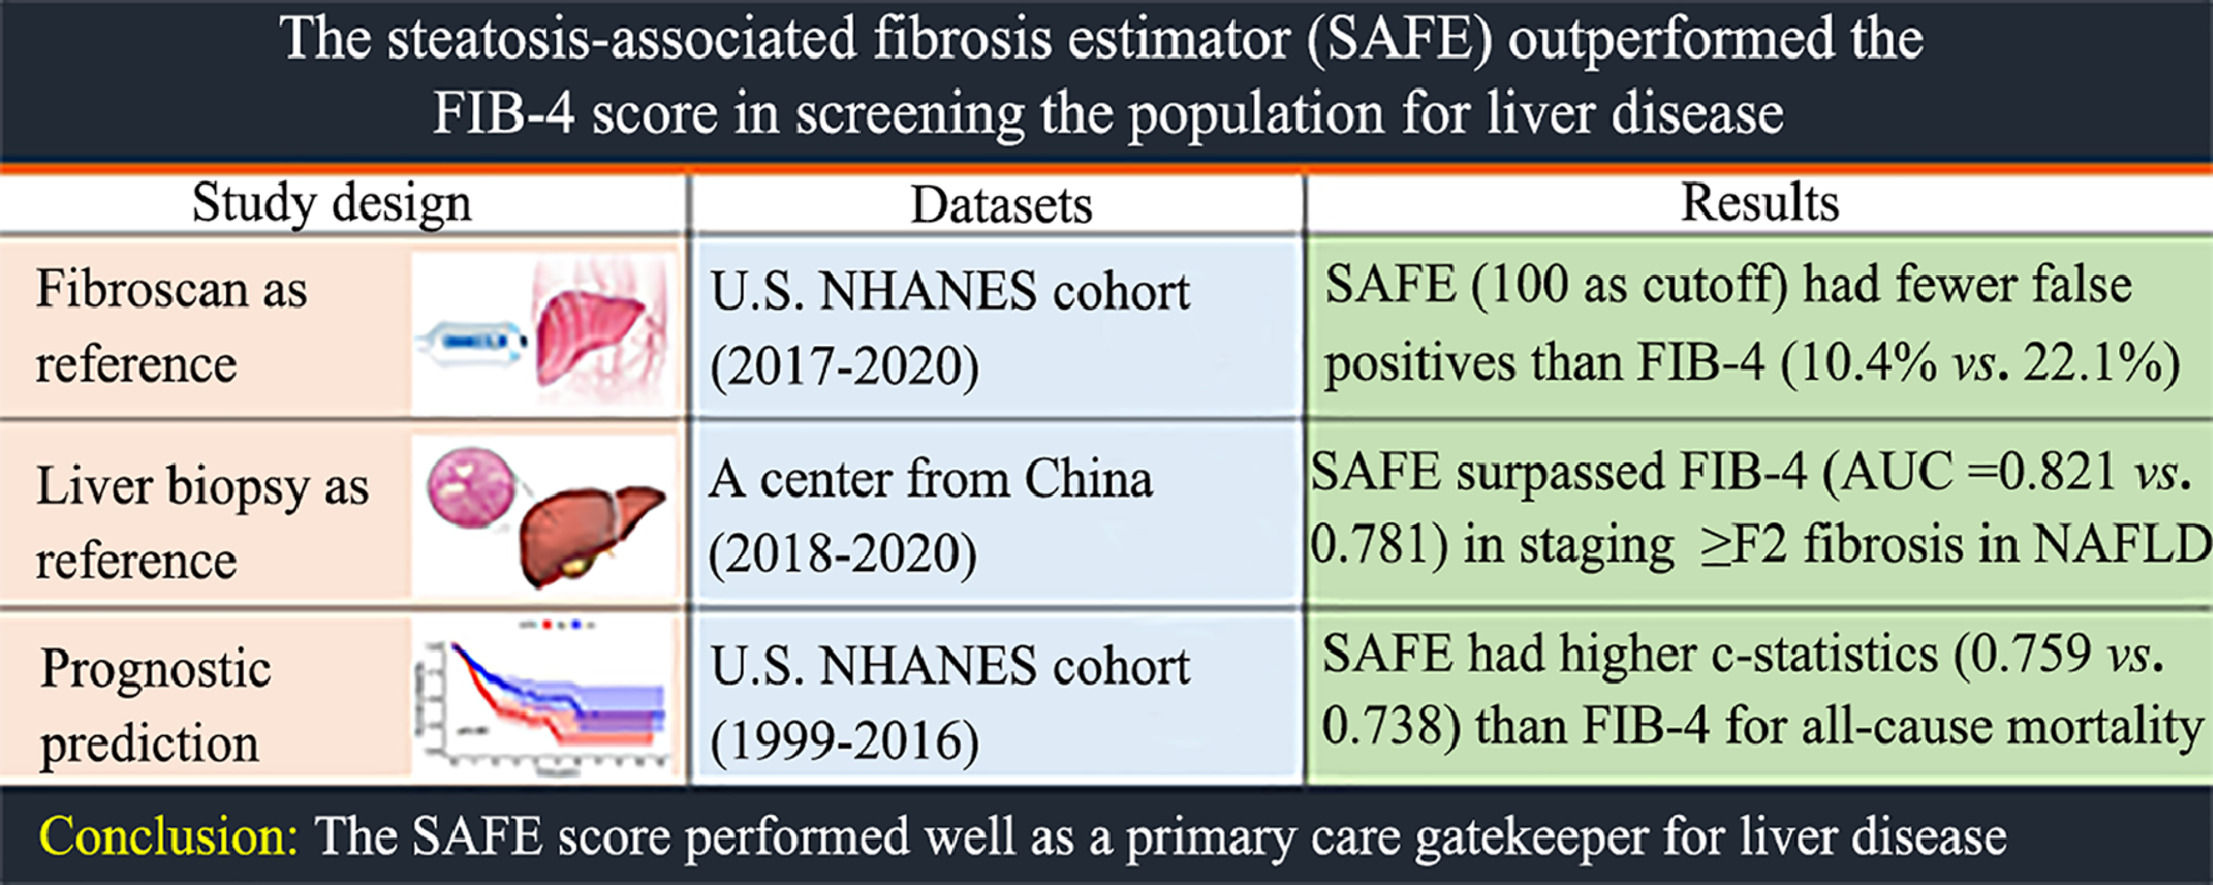
Among the general population, SAFE (cutoff 0) resulted in a lower proportion of false negatives [2.3 % (155/6677) vs 5.5 % (369/6677), P < 0.01] and a higher proportion of false positives [37.1 % (2480/6677) vs 22.1 % (1478/6677), P < 0.01], when compared with FIB-4 (cutoff 1.30) in staging TE ≥ 8 kPa (Table 2). SAFE (cutoff 100) had a lower proportion of false positives (10.4 %) than FIB-4 (cutoff 1.30) (22.1 %) and NFS (cutoff −1.455) (43.6 %), while retaining a low proportion of missed patients with TE ≥8 kPa (5.5 %) (Table 2). Among at-risk groups, SAFE (cutoff 100) spared more referrals [77.2 % (2518/3260) vs 67.8 % (2210/3260), P < 0.01] than FIB-4, with lower missed TE ≥8 kPa [54.4 % (240/441) vs 59.0 % (260/441), P = 0.02] rate and similar missed TE ≥12 kPa [40.1 % (57/142) vs 47.9 % (68/142), P = 0.08] rate (Table 2-3). Compared with FIB-4, higher NPVs were observed in the subgroup of aged ≥ 65 years (with or without age-specific), diabetes, normal or elevated liver enzymes, obese, and significant hepatic steatosis, indicating the robustness of the SAFE performance in ruling out at-risk individuals with TEs <8.0 kPa (Table 3).
Classification of participants using FIB-4, NFS and SAFE.
| TE | General population (n = 6677) | At-risk subgroup (n = 3260) | ||||||
|---|---|---|---|---|---|---|---|---|
| FIB-4 | ||||||||
| Low FIB-4 cutoff | High FIB-4 cutoff | Low FIB-4 cutoff | High FIB-4 cutoff | |||||
| < 1.3 n = 4973 | ≥ 1.3 n = 1704 | < 2.67 n = 6508 | ≥ 2.67 n = 169 | < 1.3 n = 2210 | ≥ 1.3 n = 1050 | < 2.67 n = 3163 | ≥ 2.67 n = 97 | |
| < 8 kpa | 4604 (69.0) | 1478 (22.1) | 5959 (89.3) | 123 (1.8) | 1950 (59.8) | 869 (26.7) | 2754 (84.5) | 65 (2.0) |
| ≥ 8 kpa | 369 (5.5) | 226 (3.4) | 549 (8.2) | 46 (0.7) | 260 (8.0) | 181 (5.6) | 409 (12.5) | 32 (1.0) |
| <12 kpa | 4871 (73.0) | 1618 (24.2) | 6343 (95.0) | 146 (2.2) | 2142 (65.7) | 976 (29.9) | 3041 (93.3) | 77 (2.4) |
| ≥12 kpa | 102 (1.5) | 86 (1.3) | 165 (2.5) | 23 (0.3) | 68 (2.1) | 74 (2.3) | 122 (3.7) | 20 (0.6) |
| TE | NFS | |||||||
| Low NFS cutoff | High NFS cutoff | Low NFS cutoff | High NFS cutoff | |||||
| < −1.455 n = 3305 | ≥ −1.455 n = 3372 | < 0.676 n = 5985 | ≥ 0.676 n = 6928 | < −1.455 n = 995 | ≥ −1.455 n = 2265 | < 0.676 n = 2676 | ≥ 0.676 n = 584 | |
| < 8 kpa | 3173 (47.5) | 2909 (43.6) | 5558 (83.2) | 524 (7.9) | 925 (28.4) | 1894 (58.1) | 2384 (73.1) | 435 (13.3) |
| ≥ 8 kpa | 132 (2.0) | 463 (6.9) | 427 (6.4) | 168 (2.5) | 70 (2.1) | 371 (11.4) | 292 (9.0) | 149 (4.6) |
| <12 kpa | 3280 (49.1) | 3209 (48.1) | 5868 (87.9) | 621 (9.3) | 2137 (65.6) | 981 (30.1) | 2598 (79.7) | 520 (16.0) |
| ≥12 kpa | 25 (0.4) | 163 (2.4) | 117 (1.8) | 71 (1.1) | 14 (0.4) | 128 (3.9) | 78 (2.4) | 64 (2.0) |
| TE | SAFE | |||||||
| Low SAFE cutoff | High SAFE cutoff | Low SAFE cutoff | High SAFE cutoff | |||||
| < 0 n = 3757 | ≥ 0 n = 2920 | ≤ 100 n = 5756 | > 100 n = 921 | < 0 n = 1267 | ≥ 0 n = 1993 | ≤ 100 n = 2518 | > 100 n = 742 | |
| < 8 kpa | 3602 (54.0) | 2480 (37.1) | 5389 (80.7) | 693 (10.4) | 1181 (36.2) | 1638 (50.2) | 2278 (69.9) | 541 (16.6) |
| ≥ 8 kpa | 155 (2.3) | 440 (6.6) | 367 (5.5) | 228 (3.4) | 86 (2.6) | 355 (10.9) | 240 (7.4) | 201 (6.2) |
| <12 kpa | 3728 (55.8) | 2761 (41.4) | 5662 (84.8) | 827 (12.4) | 1255 (38.5) | 1863 (57.1) | 2461 (75.5) | 657 (20.2) |
| ≥12 kpa | 29 (0.4) | 159 (2.4) | 94 (1.4) | 94 (1.4) | 12 (0.4) | 130 (4.0) | 57 (1.7) | 85 (2.6) |
Reported as number (percentage). FIB-4, Fibrosis-4 Index for Liver Fibrosis; NFS, Nonalcoholic Fatty Liver Disease Fibrosis Score; SAFE, Steatosis-Associated Fibrosis Estimator; TE, transient elastography.
Performance metrics of the NITs to rule out at-risk individuals with TEs <8.0 kPa.
| Test | Cutoff | N | TE ≥8 kpa | Sens (%) | Spec (%) | NPV (%) | PPV (%) | Referral spared (%) | TE ≥8.0 kPa missed (%) |
|---|---|---|---|---|---|---|---|---|---|
| Overall | |||||||||
| FIB-4 | 1.3 | 3260 | 441 | 41.0 | 69.2 | 88.2 | 17.2 | 67.8 | 59.0 |
| NFS | −1.455 | 3260 | 441 | 84.1 | 32.8 | 93.0 | 16.4 | 30.5 | 15.9 |
| SAFE | 0 | 3260 | 441 | 80.5 | 41.9 | 93.2 | 17.8 | 38.9 | 19.5 |
| SAFE | 100 | 3260 | 441 | 45.6 | 80.8 | 90.5 | 27.1 | 77.2 | 54.4 |
| <65 | |||||||||
| FIB-4 | 1.3 | 2198 | 285 | 23.9 | 86.6 | 88.4 | 20.9 | 85.2 | 76.1 |
| NFS | −1.455 | 2198 | 285 | 77.5 | 44.6 | 93.0 | 17.3 | 41.7 | 22.5 |
| SAFE | 100 | 2198 | 285 | 33.0 | 91.1 | 90.1 | 35.6 | 88.0 | 67.0 |
| ≥65 | |||||||||
| FIB-4 | 1.3 | 1062 | 156 | 72.4 | 32.5 | 87.2 | 15.6 | 31.7 | 27.6 |
| FIB-4 | 2 | 1062 | 156 | 31.4 | 76.5 | 86.6 | 18.7 | 75.3 | 68.6 |
| NFS | −1.455 | 1062 | 156 | 96.2 | 7.9 | 92.3 | 15.2 | 7.3 | 3.8 |
| NFS | 0.12 | 1062 | 156 | 71.8 | 47.6 | 90.7 | 19.1 | 44.7 | 28.2 |
| SAFE | 100 | 1062 | 156 | 68.6 | 59.1 | 91.6 | 22.4 | 55.0 | 31.4 |
| Diabetes | |||||||||
| FIB-4 | 1.3 | 931 | 203 | 47.8 | 63.3 | 81.3 | 26.7 | 60.9 | 52.2 |
| NFS | −1.455 | 931 | 203 | 91.6 | 11.4 | 83.0 | 22.4 | 10.7 | 8.4 |
| SAFE | 100 | 931 | 203 | 66.5 | 57.3 | 86.0 | 30.3 | 52.1 | 33.5 |
| Normal liver enzymes | |||||||||
| FIB-4 | 1.3 | 2810 | 316 | 38.6 | 69.2 | 89.9 | 13.7 | 68.3 | 61.4 |
| NFS | −1.455 | 2810 | 316 | 85.8 | 31.3 | 94.6 | 13.7 | 29.4 | 14.2 |
| SAFE | 100 | 2810 | 316 | 42.1 | 82.0 | 91.8 | 22.9 | 79.3 | 57.9 |
| Elevated liver enzymes | |||||||||
| FIB-4 | 1.3 | 450 | 125 | 47.2 | 68.9 | 77.2 | 36.9 | 64.4 | 52.8 |
| NFS | −1.455 | 450 | 125 | 80.0 | 44.3 | 85.2 | 35.6 | 37.6 | 20.0 |
| SAFE | 100 | 450 | 125 | 54.4 | 71.3 | 83.3 | 42.2 | 64.2 | 45.6 |
| BMI≥30 kg/m2 | |||||||||
| FIB-4 | 1.3 | 1821 | 342 | 33.9 | 75.9 | 83.3 | 24.5 | 74.0 | 66.1 |
| NFS | −1.455 | 1821 | 342 | 85.7 | 27.6 | 89.3 | 21.5 | 25.1 | 14.3 |
| SAFE | 100 | 1821 | 342 | 44.2 | 76.2 | 85.5 | 30.0 | 72.4 | 55.8 |
| BMI<30 kg/m2 | |||||||||
| FIB-4 | 1.3 | 1439 | 99 | 65.7 | 61.8 | 96.1 | 11.3 | 59.9 | 34.3 |
| NFS | −1.455 | 1439 | 99 | 78.8 | 38.6 | 96.1 | 8.7 | 37.4 | 21.2 |
| SAFE | 100 | 1439 | 99 | 50.5 | 85.9 | 95.9 | 20.9 | 83.4 | 49.5 |
| CAP≥248 dB/m | |||||||||
| FIB-4 | 1.3 | 2466 | 405 | 38.8 | 71.1 | 85.5 | 20.9 | 69.5 | 61.2 |
| NFS | −1.455 | 2466 | 405 | 84.0 | 30.0 | 90.5 | 19.1 | 27.7 | 16.0 |
| SAFE | 100 | 2466 | 405 | 46.2 | 79.9 | 88.3 | 31.1 | 75.6 | 53.8 |
| CAP<248 dB/m | |||||||||
| FIB-4 | 1.3 | 794 | 36 | 66.7 | 63.9 | 97.6 | 8.1 | 62.5 | 33.3 |
| NFS | −1.455 | 794 | 36 | 86.1 | 40.4 | 98.4 | 6.4 | 39.2 | 13.9 |
| SAFE | 100 | 794 | 36 | 38.9 | 83.2 | 96.7 | 9.9 | 82.2 | 61.1 |
FIB-4, Fibrosis-4 Index for Liver Fibrosis; NFS, Nonalcoholic Fatty Liver Disease Fibrosis Score; NIT, non-invasive test; NPV, negative predictive value; PPV, positive predictive value; SAFE, Steatosis-Associated Fibrosis Estimator; sens, sensitivity; spec, specificity; TE, transient elastography.
Of the 734 adults in our center, the mean age was 43.7 years (standard deviation, 12.6 years) and 55.4 % of them were male. Among the included individuals, there were 163 NAFLD cases, 40 ALD cases, 156 individuals with viral hepatitis, 281 patients diagnosed with autoimmune liver disease, and the remaining 94 cases were categorized as having other etiologies. The prevalences of significant fibrosis (stage ≥2) for NAFLD, ALD, viral hepatitis, autoimmune liver disease or cholestatic liver disease and other etiologies were 30.6 %, 70.0 %, 50.6 %, 39.5 % and 48.0 %, respectively (Supplemental Table 2). In Part 2, SAFE outperformed FIB-4 (P = 0.04) and NFS (P = 0.04) in staging significant fibrosis (≥S2) in NAFLD, while showing similar diagnostic accuracy to FIB-4 and NFS in other etiologies. The SAFE score was comparable to the FIB-4 and NFS for staging advanced fibrosis (≥ S3) (Fig. 3).
 and advanced fibrosis (S ≥ 3) in an Asian center. (A) Diagnostic performance of non-invasive tests in staging significant fibrosis and advanced fibrosis in NAFLD. (B) Diagnostic performance of non-invasive tests in staging significant fibrosis and advanced fibrosis in ALD. (C) Diagnostic performance of non-invasive tests in staging significant fibrosis and advanced fibrosis in viral hepatitis (including chronic hepatitis B and chronic hepatitis C). (D) Diagnostic performance of non-invasive tests in staging significant fibrosis and advanced fibrosis in autoimmune liver disease and cholestatic liver disease. (E) Diagnostic performance of non-invasive tests in staging significant fibrosis and advanced fibrosis in other liver diseases (including drug-induced liver injury, generic,infectious-related liver disease, hepatic vascular disease, and cryptogenic liver disease). ALD, alcohol-related liver disease; CSLD, cholestatic liver disease; DILI, drug-induced liver injury; EAC, excessive alcohol consumption; FIB-4, Fibrosis-4 Index for Liver Fibrosis; NAFLD, non-alcoholic fatty liver disease; NFS, Nonalcoholic Fatty Liver Disease Fibrosis Score; NHANES, National Health and Nutrition Examination Survey; SAFE, Steatosis-Associated Fibrosis Estimator; VH, viral hepatitis.")
Diagnostic performance of FIB-4, NFS, and SAFE for staging significant fibrosis (S ≥ 2) and advanced fibrosis (S ≥ 3) in an Asian center. (A) Diagnostic performance of non-invasive tests in staging significant fibrosis and advanced fibrosis in NAFLD. (B) Diagnostic performance of non-invasive tests in staging significant fibrosis and advanced fibrosis in ALD. (C) Diagnostic performance of non-invasive tests in staging significant fibrosis and advanced fibrosis in viral hepatitis (including chronic hepatitis B and chronic hepatitis C). (D) Diagnostic performance of non-invasive tests in staging significant fibrosis and advanced fibrosis in autoimmune liver disease and cholestatic liver disease. (E) Diagnostic performance of non-invasive tests in staging significant fibrosis and advanced fibrosis in other liver diseases (including drug-induced liver injury, generic,infectious-related liver disease, hepatic vascular disease, and cryptogenic liver disease).
ALD, alcohol-related liver disease; CSLD, cholestatic liver disease; DILI, drug-induced liver injury; EAC, excessive alcohol consumption; FIB-4, Fibrosis-4 Index for Liver Fibrosis; NAFLD, non-alcoholic fatty liver disease; NFS, Nonalcoholic Fatty Liver Disease Fibrosis Score; NHANES, National Health and Nutrition Examination Survey; SAFE, Steatosis-Associated Fibrosis Estimator; VH, viral hepatitis.
In part 3, we included a total of 46,357 adults for outcome assessment. Table 4 shows the baseline characteristics of the included subjects. Among them, 22,419 (48.3 %) were male, and the average age was 47.0 years, with a standard deviation of 19.2 years. Using the suggested cutoffs for the SAFE score, we categorized the study population into three risk groups: low risk (SAFE <0), intermediate risk (SAFE: 0–100), and high risk (SAFE >100). This resulted in 58.3 % of the patients being classified as low probability (n = 27,035), 27.3 % as intermediate probability (n = 12,664), and 14.3 % as high probability of significant fibrosis (n = 6658). Supplemental Fig. 1 displays the Kaplan-Meier survival estimates for the three SAFE score strata. After a median follow-up of 10.3 years, the baseline SAFE score predicted overall survival in the general population. The FIB-4 (Supplemental Fig. 2) and NFS were also associated with survival (Supplemental Fig. 3). SAFE outperformed FIB-4 and NFS with c-statistics for mortality throughout the entire follow-up period, scoring 0.759, 0.738 and 0.736, respectively (all P < 0.01).
Characteristics of the study participants in the NHANES cohort (1999–2016).
| SAFE strata | SAFE<0 (n = 27,034) | SAFE: 0–100 (N = 12,665) | SAFE >100 (n = 6658) |
|---|---|---|---|
| Age | 36.2 ± 14.2 | 59.2 ± 14.6 | 67.8 ± 12.1 |
| Gender, male (%) | 12,404 (45.9) | 6416 (50.7) | 3599 (54.1) |
| BMI | 27.0 ± 6.0 | 30.2 ± 6.8 | 32.2 ± 7.3 |
| Race | |||
| Mexican American (%) | 5477 (20.3) | 2259 (17.8) | 1156 (17.4) |
| Other Hispanic (%) | 2189 (8.1) | 1044 (8.2) | 503 (7.6) |
| Non-Hispanic White (%) | 11,936 (44.2) | 5644 (44.6) | 2914 (43.8) |
| Non-Hispanic Black (%) | 4882 (18.1) | 2879 (22.7) | 1752 (26.3) |
| Other race (%) | 2550 (9.4) | 839 (6.6) | 333 (5.0) |
| Diabetes (%) | 611 (2.3) | 2536 (20.0) | 3532 (53.0) |
| Hypertension (%) | 6267 (23.2) | 7958 (62.8) | 5218 (78.4) |
| Metabolic syndrome* (%) | 5387 (19.9) | 7501 (59.2) | 5085 (76.4) |
| Alcohol⁎⁎ (%) | 1508 (6.6) | 648 (6.3) | 338 (6.7) |
| Serum tests | |||
| Platelets (109/L) | 270.3 ± 67.0 | 244.1 ± 59.2 | 207.4 ± 58.1 |
| GLB (g/L) | 28.7 ± 4.0 | 30.1 ± 4.5 | 32.4 ± 5.7 |
| ALT (U/L) | 23.3 ± 18.0 | 26.0 ± 17.3 | 31.7 ± 47.8 |
| AST (U/L) | 22.7 ± 6.9 | 26.3 ± 10.7 | 35.7 ± 43.9 |
| All-cause mortality⁎⁎⁎ (%) | 1343 (5.0 %) | 2927 (23.1 %) | 2803 (42.1 %) |
Reported as mean ± standard deviation.
ALT, alanine transaminase; AST, aspartate transaminase; BMI, body mass index; FIB-4, Fibrosis-4 Index for Liver Fibrosis; GLB, globulin; GGT, gamma-glutamyl transferase; NAFLD, non-alcoholic fatty liver disease; NFS, Nonalcoholic Fatty Liver Disease Fibrosis Score; SAFE, Steatosis-Associated Fibrosis Estimator.
Compared to individuals in the low SAFE strata (<0), those at intermediate risk (SAFE: 0–100) and high-risk (SAFE >100) experienced an 11 % and a 57 % increases in mortality, respectively (adjusted HR 1.11, 95 % CI 1.03–1.19; adjusted HR 1.57, 95 % CI 1.45–1.70), in the multivariable Cox regression model adjusted for age, gender, and race (Fig. 4). Considering the significant impact of hypertension, diabetes and metabolic syndrome on prognosis, we also adjusted these risk factors. The mortality risk for SAFE >100 remained stable (aHR, 1.32; 95 % CI, 1.21–1.44), whereas SAFE 0–100 (aHR, 1.06; 95 % CI, 0.97–1.12) was no longer associated with increased mortality risk in the entire cohort (Supplemental Table 3). The EASL guidelines recommended NITs to rule out TE <8 kPa in population at risk for chronic liver disease. According to the findings in study part 1, SAFE with a cutoff of 100 was a better choice for this at-risk population as it led to more efficient referrals (Table 3). Compared with the low or intermediate-risk group (SAFE ≤100), the high-risk group (SAFE >100) was independently associated with higher mortality, supported by non-overlapping confidence intervals with the other two strata. This findings remained robust after adjusting the risky cardiometabolic profiles mentioned above (Supplemental Table 3). In the subgroup of NAFLD individuals defined based on the USFLI or HSI, both the intermediate-risk and high-risk groups correlated with all-cause mortality, indicating that the SAFE score is well-suited for assessing NAFLD (Fig. 4).
. Multivariable cox regression model was adjusted with age, gender and race. *Participants at risk for chronic liver disease were defined according to the EASL guideline as having either metabolic syndrome (based on the ATP-III criteria) or excessive alcohol consumption (>20 g/d for women and >30 g/d for men) or viral hepatitis. **Viral hepatitis includes chronic hepatitis B and chronic hepatitis C. ***NAFLD was defined as USFLI ≥30 and exclusion of excessive alcohol consumption and viral hepatitis. ****NAFLD was defined as HSI ≥36 and exclusion of excessive alcohol consumption and viral hepatitis. HR, hazard ratio; HSI, hepatic steatosis index; NAFLD, nonalcoholic fatty liver disease; NHANES, National Health and Nutrition Examination Survey; SAFE, Steatosis-Associated Fibrosis Estimator; USFLI, the US fatty liver index.")
Forest plot depicting the association between SAFE score tiers and all-cause mortality among general population in the NHANES cohort (1999–2016). Multivariable cox regression model was adjusted with age, gender and race.
*Participants at risk for chronic liver disease were defined according to the EASL guideline as having either metabolic syndrome (based on the ATP-III criteria) or excessive alcohol consumption (>20 g/d for women and >30 g/d for men) or viral hepatitis.
**Viral hepatitis includes chronic hepatitis B and chronic hepatitis C.
***NAFLD was defined as USFLI ≥30 and exclusion of excessive alcohol consumption and viral hepatitis.
****NAFLD was defined as HSI ≥36 and exclusion of excessive alcohol consumption and viral hepatitis.
HR, hazard ratio; HSI, hepatic steatosis index; NAFLD, nonalcoholic fatty liver disease; NHANES, National Health and Nutrition Examination Survey; SAFE, Steatosis-Associated Fibrosis Estimator; USFLI, the US fatty liver index.
The current study demonstrated that SAFE could be a valuable tool for noninvasive screening of liver fibrosis in the population, providing insights into future outcomes. Using a cutoff of 100, SAFE displayed higher accuracy than FIB-4 and NFS in staging TE ≥8 kPa (P < 0.01), resulting in more efficient referrals. SAFE outperformed FIB-4 in staging significant fibrosis (≥S2, P = 0.04) in NAFLD, while showing similar diagnostic accuracy to FIB-4 and NFS in other etiologies.
Compared with the FIB-4-based referral strategy recommended by the EASL NIT guideline, SAFE (cutoff 100) could achieve a higher referral spared rate without increasing the missed TE ≥8 kPa rate (Table 3). We found that higher cutoff value (100) is a reasonable threshold for risk stratification in the primary care, supporting the opinion of the authors who proposed SAFE [12]. A lower cutoff would optimize sensitivity at the expense of a large decrease in specificity [23]. SAFE (cutoff 0) did increase the sensitivity and PPV while resulting in a even lower specificity than FIB-4, indicating a poor performance in sparing referral (Table 3). SAFE was firstly developed to differentiate significant fibrosis (≥F2) from minimal fibrosis among presumed NAFLD individuals, which is different from the purpose of ruling out advanced fibrosis (≥ F3) in the primary care recommended by EASL NIT guidelines. The lower cutoff (0) and higher cutoff (100) were proposed to rule out and rule in significant fibrosis (≥ F2) [12]. We found that a higher cutoff (100) for ruling in significant fibrosis worked efficiently in ruling out advanced fibrosis.
The SAFE score, which was initially developed and validated in the U.S. population [24], continued to show superior performance over the FIB-4 in staging significant fibrosis (P = 0.04) in NAFLD patients with lower mean BMI values in Asia. SAFE demonstrated similar performance in liver diseases involving cholestasis, autoimmune factors, or viral hepatitis. However, it's important to note that patients with these diseases typically receive indications through laboratory tests and referrals to hepatologists, regardless of the results of NITs. Elastography-based examination or liver biopsy would be optimal choices for disease staging in this scenario.
The SAFE score could inform survival among the U.S. general population, with higher c-statistics than FIB-4 and NFS. Among the subgroup at risk for chronic liver disease, the intermediate-risk group (FIB-4: 1.30–2.67; NFS: −1.455–0.676; SAFE: 0–100) did not independently associated with increased mortality (P > 0.05) (Fig. 4) (Supplemental Fig. 2–3). Hence, individuals in the intermediate-risk group are recommended to undergo TE examination to identify those with liver stiffness <8 kPa who do not require referral [6]. Based on study part 1, SAFE (cutoff 100) resulted in more efficient referrals than FIB-4 and NFS. As depicted in Fig. 4, the high-risk group (SAFE >100) was independently associated with higher mortality, supported by non-overlapping confidence intervals. In this context, 100 is a reasonable threshold for the SAFE score to guide referral decisions in the general population.
In the present study, we found that the SAFE score was effective at predicting NAFLD severity in both U.S. and Asian populations. Since NAFLD is a multifactorial metabolic disorder that has emerged as the most common chronic liver disease worldwide, other populations with suspected NAFLD from other regions of the world may also benefit from this novel model.
This study has several limitations. Firstly, in study part 1, we used LSM with TE as a surrogate for liver fibrosis. TE is a well-established marker for assessing risk in CLD patients with various etiologies, which has integrated into clinical practice guidelines [25,26]. Additionally, using liver biopsy for screening is impractical and unethical in such low-prevalence settings. Secondly, study part 2 was a retrospective study, introducing the risk of selection bias. Additionally, this single-center study was conducted primarily on a middle-aged, nonobese Asian population. Multinational studies are warranted to ensure the generalizability of findings across various etiologies of livers diseases. Thirdly, we were unable to assess liver-related mortality due to the unavailability of data from the National Center for Health Statistics to the public. Nevertheless, we believe that the association of SAFE with long term overall mortality remains highly relevant in primary care.
5ConclusionsCollectively, compared to the recommended FIB-4, using a SAFE-based referral pathway reduced futile referrals without raising the missed TE ≥8 kPa rate. Additionally, SAFE was more effective than FIB-4 and NFS in staging significant fibrosis in NAFLD individuals. Furthermore, SAFE is correlated with all-cause mortality in the general U.S. population, supporting its role as a primary care gatekeeper.
Data availabilityAuthors will share data upon reasonable request with researchers who provide a methodologically viable proposal and can do analyses that achieve the aims of the proposal. Data sharing requests can be directed to BW by email. A data access agreement is needed to gain access to data. For the NHANES analysis, data are publicly available at https://www.cdc.gov/nchs/nhanes/.htm.
CRediT authorship contribution statementMingkai Li: Formal analysis, Investigation, Methodology, Software, Writing – original draft. Ying Lin: Formal analysis, Investigation, Methodology, Software, Writing – original draft. Hongsheng Yu: Formal analysis, Investigation, Methodology, Software, Writing – original draft. Weichun Lin: Data curation, Formal analysis, Investigation, Methodology, Software, Writing – original draft. Jianning Chen: Investigation. Yidong Yang: Conceptualization, Data curation, Supervision, Writing – review & editing. Bin Wu: Conceptualization, Data curation, Supervision, Writing – review & editing.


