Introduction
One of the most common indications in echocardiography is the evaluation of left ventricular function. It has traditionally been evaluated as left ventricular ejection fraction and left ventricular end-systolic volume, both remaining as the simplest and most widely used parameters for global assessment of left ventricular function.1
Traditionally, two-dimensional echocardiography has been routinely used in clinical practice to measure left ventricle (LV) dimensions, wall thickness, and function, the latter focused in the measurement of ejection fraction which is based upon tracing the left ventricular borders and calculating left ventricular volumes using geometric assumptions.2 The use of these assumptions may introduce considerable miscalculations, particularly for patients with odd-shaped ventricles and wall-motion abnormalities. Besides, the inadvertent use of foreshortened views can raise its inaccuracy and low reproducibility. Alternatively, LV function can be assessed by Doppler techniques through the measurements of stroke volume using the continuity equation. However, calculations of stroke volume by Doppler are dependent on the accuracy of left ventricle outflow tract measurement (LVOT); errors in the measurement, which are squared in the calculation of the LVOT area, limit the reliability of this parameter.3,4
In search of a method to quantify LV volumes and left ventricle ejection fraction, real-time three-dimensional echocardiography is an important step forward in cardiac ultrasound. Multiple studies have demonstrated the superior accuracy and reproducibility of real-time three-dimensional echocardiography over two-dimensional echo-cardiography for assessment of cardiac function.5,6
Nevertheless, segmental wall motion has been more difficult to evaluate. Regional myocardial function by echocardiography is usually evaluated by visual assessment of endocardial motion and wall thickening using two-dimensional echocardiography. This approach, however, suffers from being subjective providing only semi- quantitative data and is limited by huge intra- and inter-observer variability. Visual assessment has limited ability to detect more subtle changes in function and in timing of myocardial motion throughout systole and diastole. Recently, echo-cardiographic modalities for objective quantification of global and regional function have been developed such as tissue Doppler and speckle tracking imaging.
In this article, we review in a concise manner the methodology behind the development, usefulness, and shortcomings of these echocardiographic techniques.
Deformation - strain
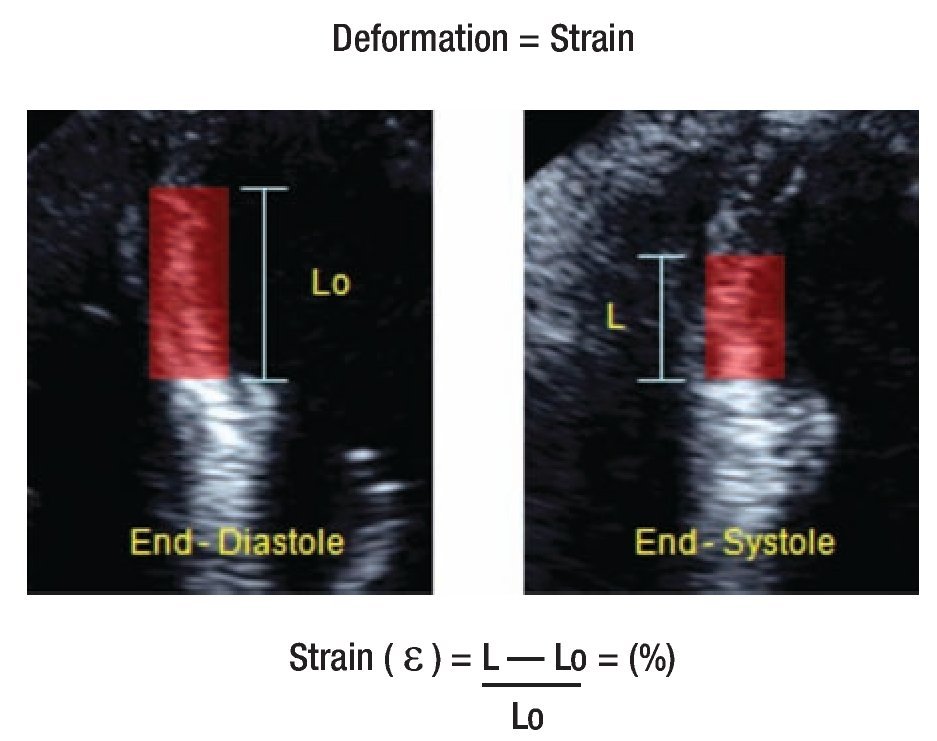
In cardiac muscle physiology, strain is a measurement of deformation representing shortening or stretching of the tissue or myocardial fibers. The Greek letter epsilon (ε) is commonly used as a symbol for strain. The strain value is dimensionless and can be represented as a fractional number or as a percentage change from an object's original dimension (Figure 1). As the ventricle contracts, muscle shortens in the circumferential and longitudinal dimensions (a negative strain) and thickens in the radial and transversal direction (a positive strain). As a result, for the left ventricle, three normal strain values (longitudinal, circumferential, radial/transversal) are used to describe LV deformation in three dimensions (Figure 2).
Figure 1. Strain is defined as the fractional change in length of an element of the object when compared to its original length.
Figure 2. Cardiac mechanics: Main left ventricle strain vectors in short axis and apical views.
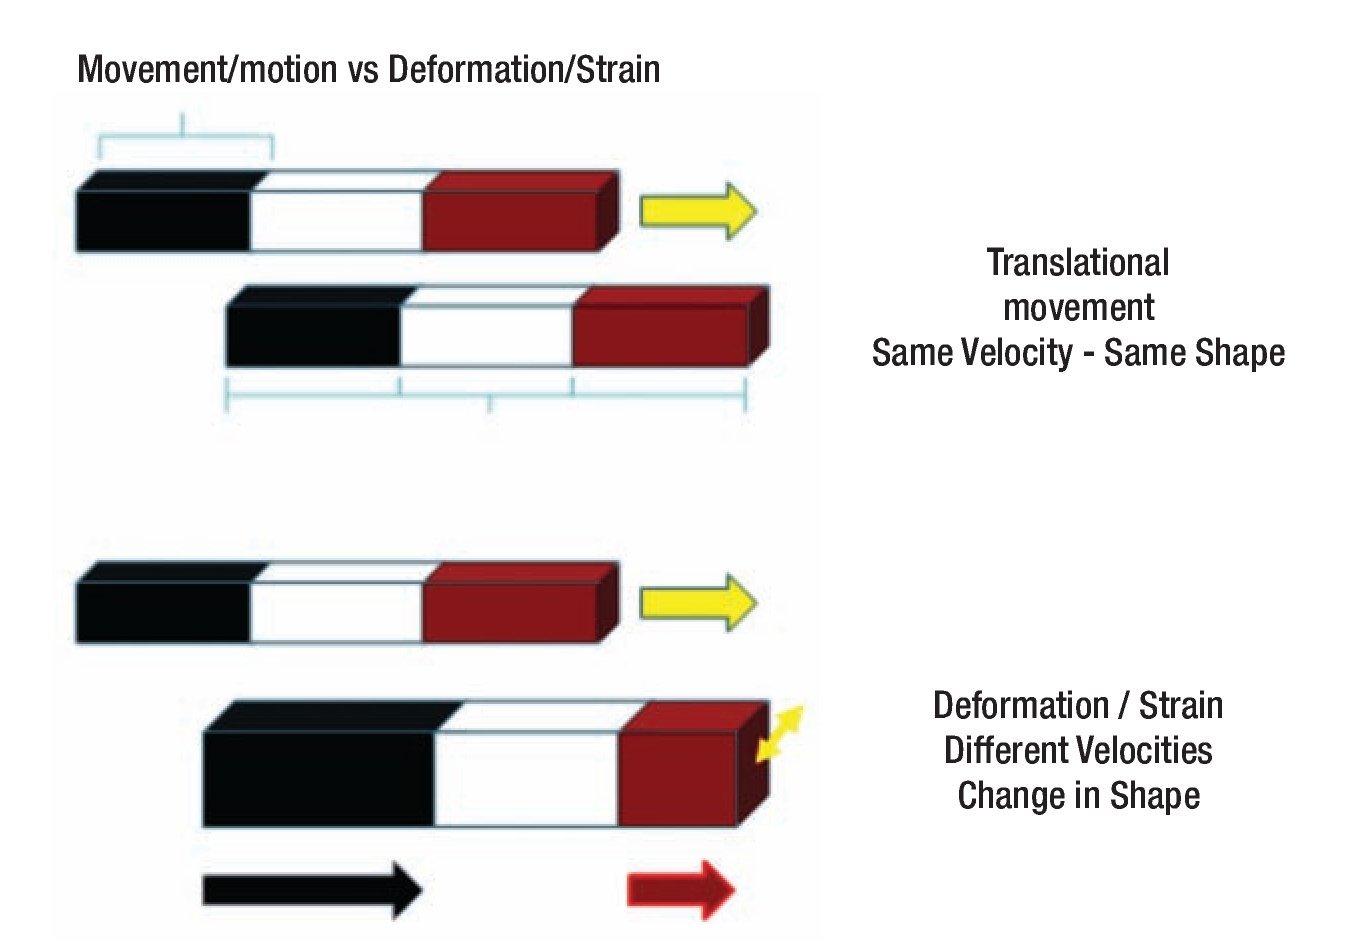
Theoretically, strain values are not affected by the uniform translational motion of the heart and, as a consequence, they offer a clear advantage over velocity and displacement to assess the local functionality of the myocardium.7,8 The superiority of deformation parameters for assessing cardiac function compared to motion/ velocity/displacement parameters is related to the basic strain-algorithm, which subtracts the motion due to the contraction of neighboring segments (tethering effects and translational motion). Completely passive segments can show motion relative to the transducer due to tethering, but without any deformation, making velocity and displacement information completely unreliable for the characterization of such regions. Strain parameters, on the other hand, are referred to as motion-deformation between two points in the myocardial wall, which is unrelated to the motion towards the transducer, and this fact discriminates the actual passive movement from true contraction in any myocardial region (Figure 3).9
Figure 3. Movement vs. Deformation: A moving object is not necessarily suffering deformation so long as every part of it moves with the same velocity. Deformation occurs when different elements in the same object move at different velocities so the object has to change shape during its movement.
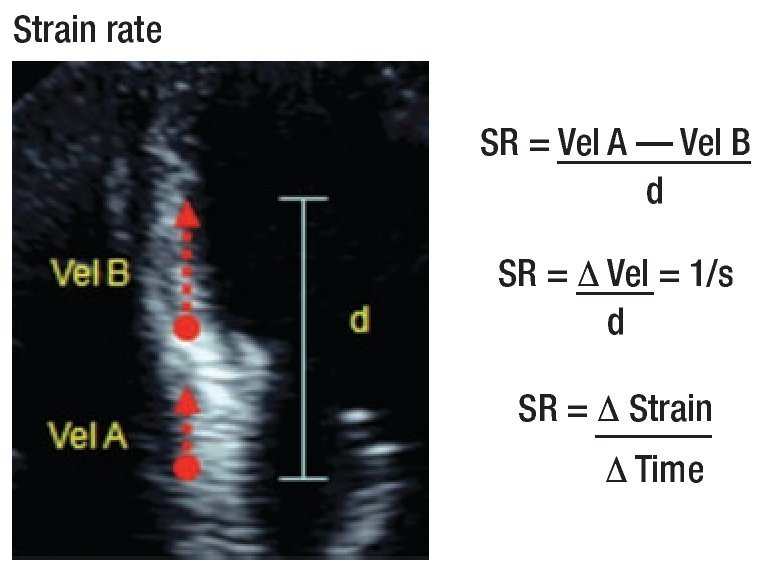
Strain rate (SR) is the rate at which deformation occurs, i.e., change of strain per unit of time. By definition it is the temporal derivative of strain and expresses the rate of shortening or lengthening of a part of the heart. As strain rate describes the velocity of deformation, its unit of measurement is 1/s (Figure 4).
Figure 4. Strain rate describes the velocity of deformation.
Currently, the principal strain vectors and their velocity derivatives (Strain Rate) can be assessed by tissue Doppler and speckle tracking echocardiography.
Tissue Doppler imaging
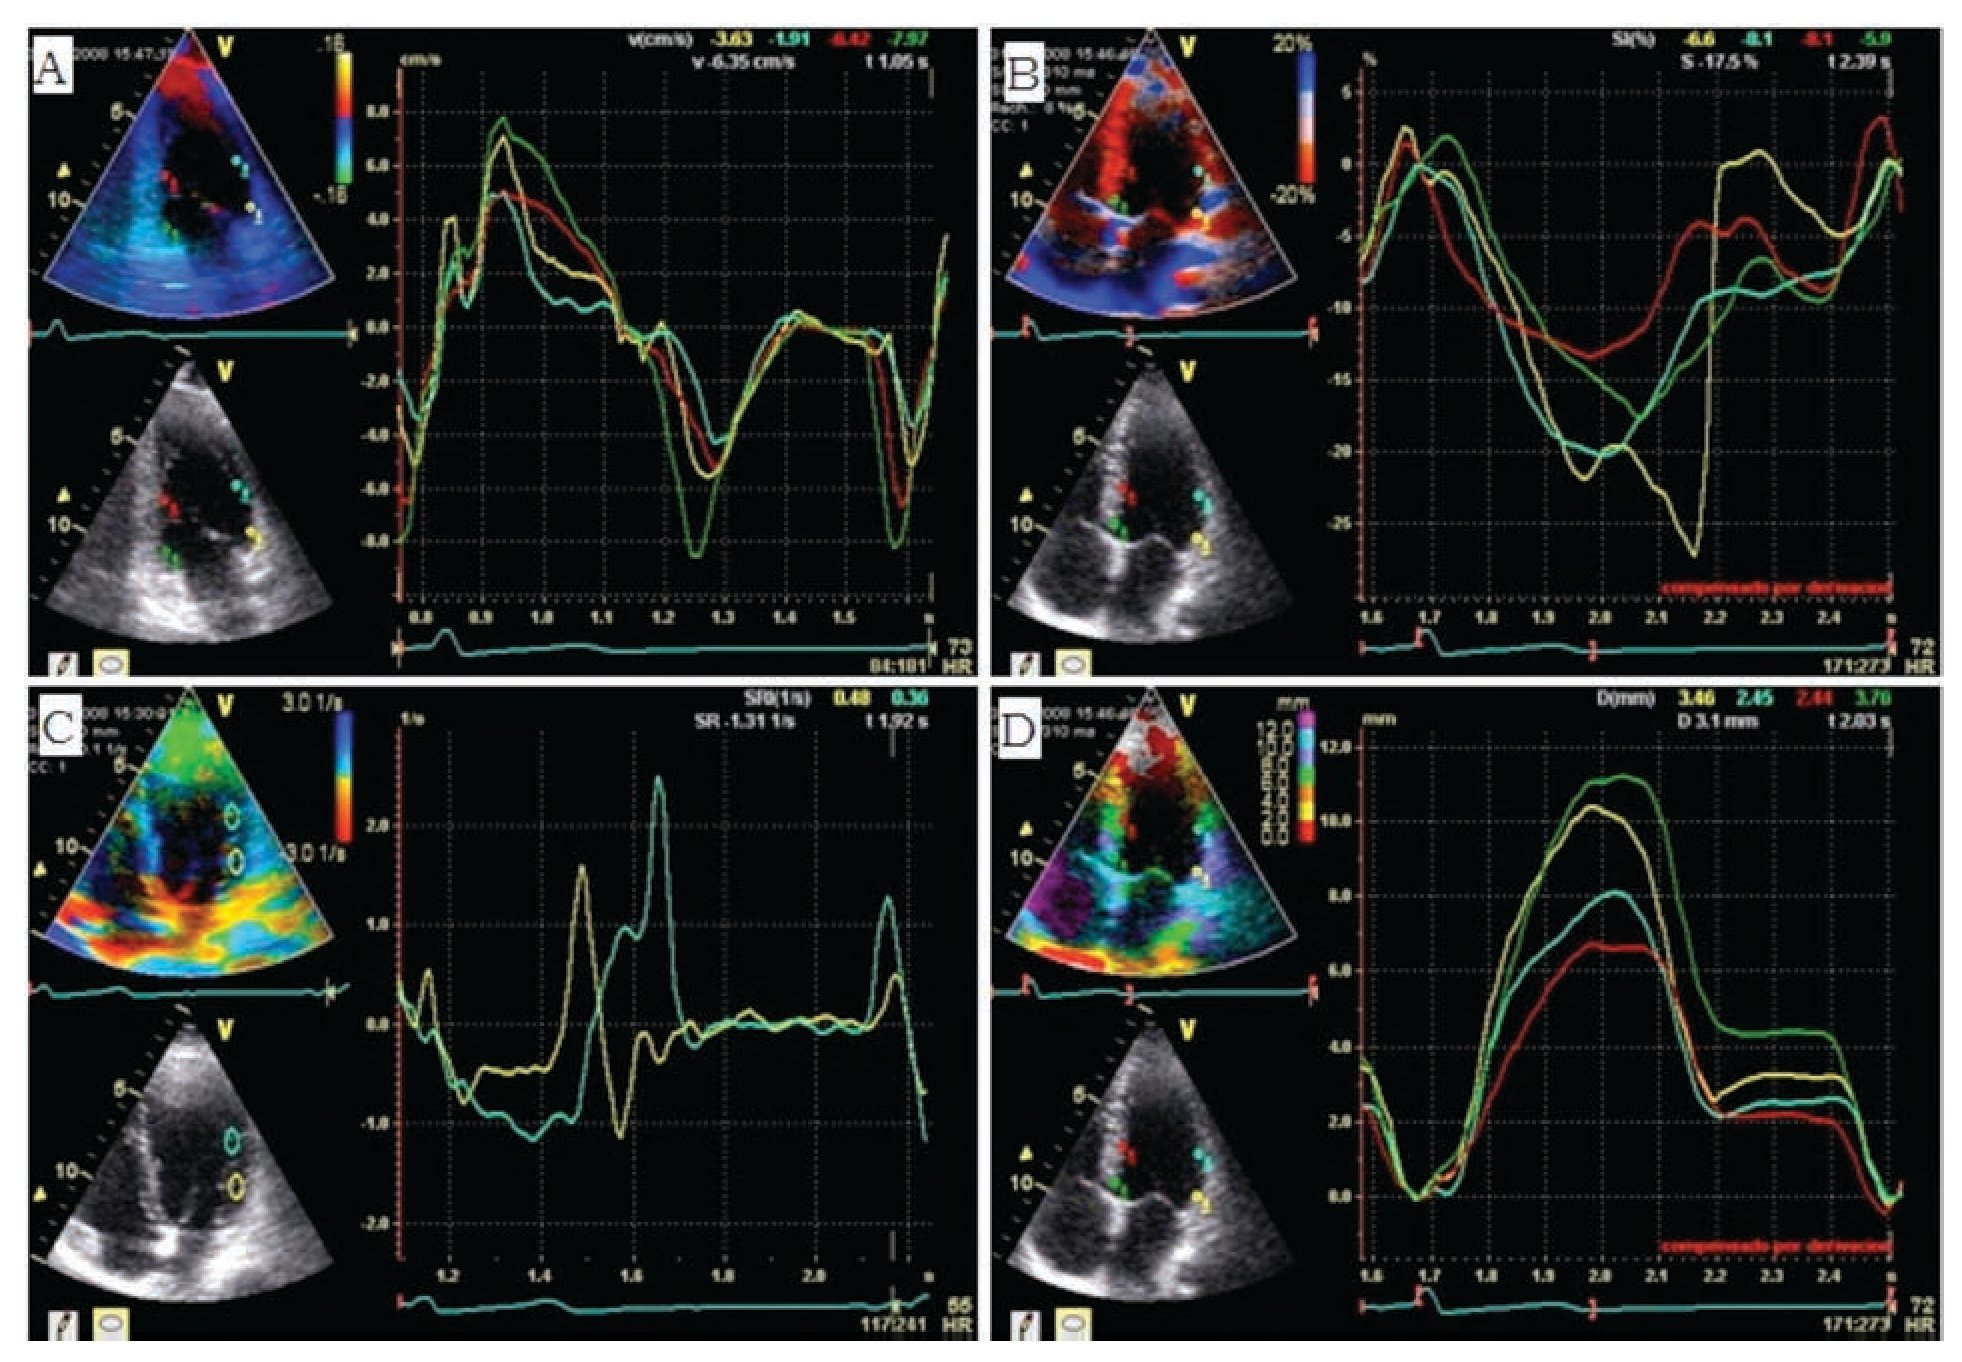
Rather than assessing the rapid velocity blood pool as with conventional Doppler, uses filters to remove these signals to concentrate solely on the lower velocity myocardial motion. Velocities in the myocardial wall are much lower than that of the blood pool and are typically less than 15 cm/s. Tissue Doppler imaging allows a quantitative analysis of the motion pattern of the cardiac walls. Some published studies have suggested that tissue velocity, strain, and strain rate by tissue Doppler are more accurate methods for evaluation of global and regional function10-12 when compared with conventional echocardiographic methods (Figure 5). Several groups of investigators have demonstrated that strain analysis of a broader area is probably superior to tissue velocity data at one site and wall motion score for tracking local systolic function.13-17
Figure 5. Examples of Tissue Doppler imaging measurements: A) myocardial longitudinal segmental velocity in four regions of the anterior and inferior LV walls; B) myocardial longitudinal segmental strain in lateral and septal LV walls; C) myocardial longitudinal segmental strain rate in two regions in the lateral wall demonstrating some decrease in the velocity of deformation in the region represented by the yellow line; D) myocardial longitudinal tissue displacement.
Clinical applications: Tissue Doppler Imaging (TDI) has been evaluated in several experimental and clinical studies. One of the most important clinical applications of TDI is the quantification of global LV systolic function; this can be done by measuring the myocardial peak systolic velocities of the mitral valve annulus at several locations and to derive an average of them. Gulati et al, reported an excellent correlation between systolic mitral annulus velocity Sm averaged from the apical views and LV ejection fraction.18,19 Others have shown a good correlation between Sm and peak positive dP/dt in patients with dilated cardiomyopathy and hypertensive heart disease.20 In addition, this parameter was found to be the strongest independent echocardiographic predictor of prognosis in patients with chronic heart failure.21 Moreover, TDI permits quantification of individual LV segments by measuring the velocities, strain and strain rate of various LV segments.
In the assessment of LV diastolic function, TDI provides valuable information. In an interesting study, Sohn et al, were able to differentiate subjects with pseudonormal filling from normal by an E' velocity < 8.5 cm/s and an E'/A' ratio < 1, with a sensitivity of 88% and a specificity of 67%.22 Furthermore, this technique can be used in the non-invasive evaluation of LV filling pressure, which is assessed through the ratio of transmitral early peak flow velocity (E) over early diastolic mitral annulus velocity (E') or E/E'. Nagueh et al, demonstrated that the E/E' ratio correlated well with pulmonary capillary wedge pressure measured invasively. An E/E' ratio > 10 detected a mean pulmonary capillary wedge pressure > 15 mmHg with a sensitivity of 97% and a specificity of 78%.23 Ommen et al proposed a higher cut-off value of 15 for E/E', which is now commonly used.24 The different cut-off values can be explained by the fact that Nagueh et al, used the lateral mitral valve annulus whereas Ommen et al used the medial mitral valve annulus.
Other applications of TDI in clinical practice comprise the differentiation between restrictive cardiomyopathy and constrictive pericarditis,25,26 the early identification of cardiomyopathies,27-30 detection of ischemia and evaluation of viability,31-35 and the study of patients with dys-synchrony.36-37
Limitations of tissue doppler imaging: The angle dependency is a serious limitation of all Doppler-based techniques, including Doppler-derived myocardial velocities and strain.12 Tissue Doppler imaging is only able to estimate strain along the ultrasound beam and thus cannot reliably measure strain in the azimuth or perpendicular plane. This limits the use of TDI-derived strain measurements primarily to longitudinal fibers, with the inability to quantify deformation in the radial plane. Therefore, it is essential that the ultrasound beam is aligned parallel to the left ventricle wall in long-axis imaging to obtain longitudinal segmental measurements, and perpendicular to the wall for radial measurements in the short axis. This implies that strain measurements from myocardial segments close to the left ventricle apical curvature cannot be reliably assessed by tissue Doppler imaging.13
Two-dimensional speckle tracking echocardiography
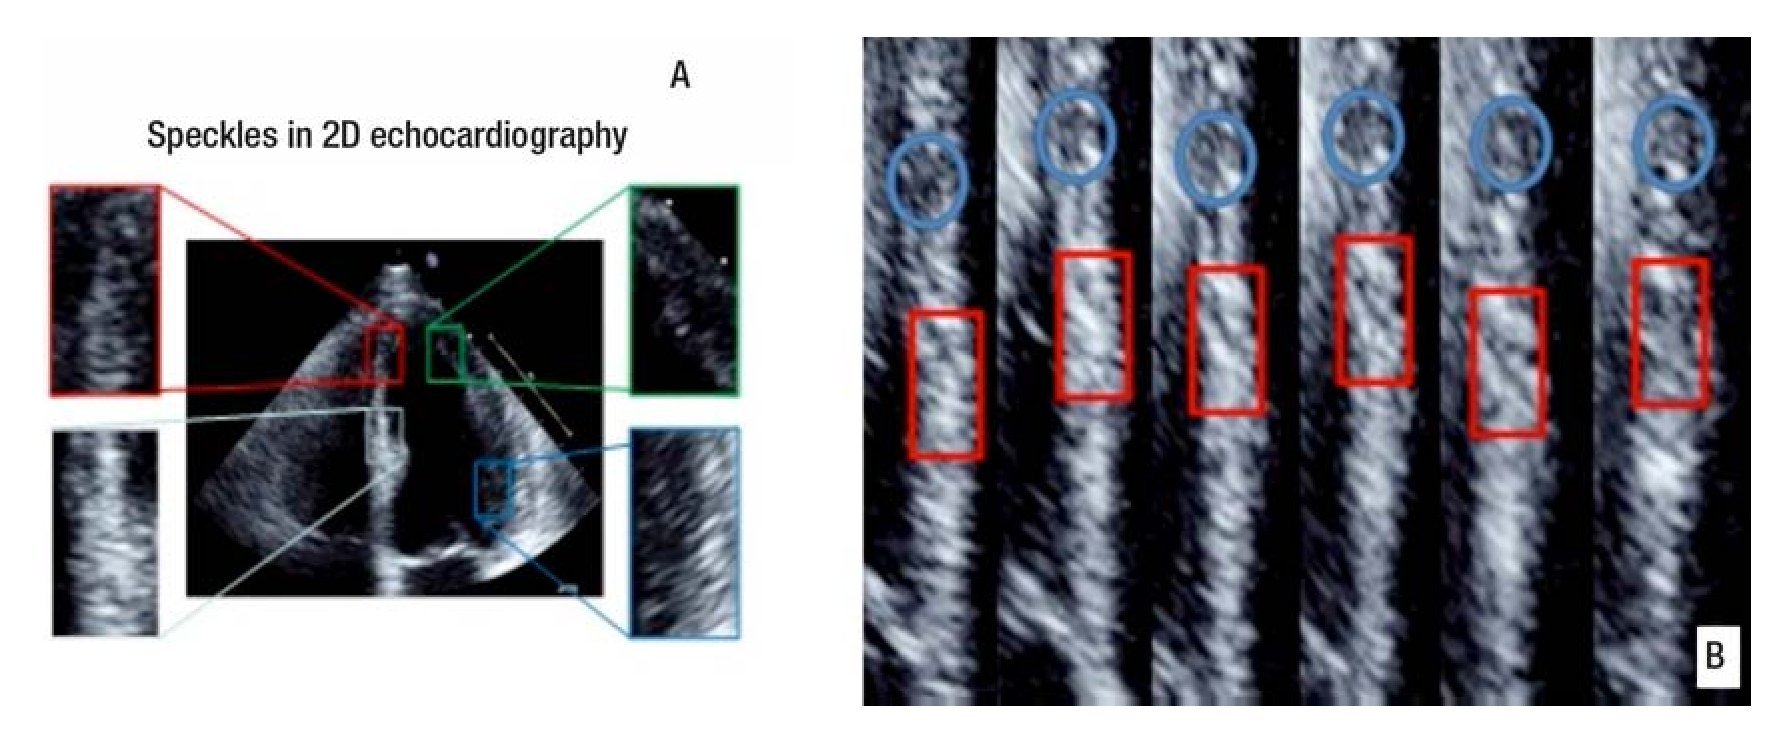
Speckle-tracking echocardiography (STE) has been introduced as a technique for angle-independent quantification of multidirectional myocardial strain. Speckle tracking is an application of pattern-matching technology to ultrasound cine data. Speckles are natural acoustic markers that occur as small and bright elements in conventional gray scale ultrasound images. The speckles are backscattered from structures smaller than a wavelength of ultrasound. These speckles are distributed all through the myocardium on the ultrasound image.1,38
In the speckle tracking methodology, a small area of the myocardium with its unique speckle pattern can be defined (it is called "kernel") and tracked, following a search algorithm based on optical flow method, trying to recognize the most similar speckle pattern from one frame to another. The algorithm searches for an area with the smallest difference in the total sum of pixel values, which is the smallest sum of absolute differences39 (Figure 6).
Figure 6. Speckle tracking technology: A) speckles are acoustic markers in conventional grayscale ultrasound images, they form small areas or patterns called "kernel"; B) a speckle pattern is defined and tracked frame by frame based on block-matching-optical flow method.
For accurate speckle tracking, a high frame rate is important. Speckle patterns change over the course of the cardiac cycle because of deformation of the heart and out-of-plane motion. A high frame rate decreases the speckle change between frames, allowing better tracking.40-41 Currently there are different programs available that have the ability to assess myocardial strain, strain rate, velocities and displacement from these speckles. Measurements can be done simultaneously from multiple regions of interest within an image plane from conventional gray-scale B-mode recordings. The distance between selected speckles is measured within a predefined myocardial area as a function of time, and parameters of myocardial deformation can be calculated. This is in contrast to Doppler-based measurements where the sample volume is a fixed area in space and all measurements are done with reference to an external point (the transducer). Strain measurements from the speckle-tracking technique are therefore direct measures of myocardial deformation while tissue Doppler imaging calculates strain by integrating strain rate. Another important advantage by using the new technique is independence from insonation angle and cardiac translation.42-44
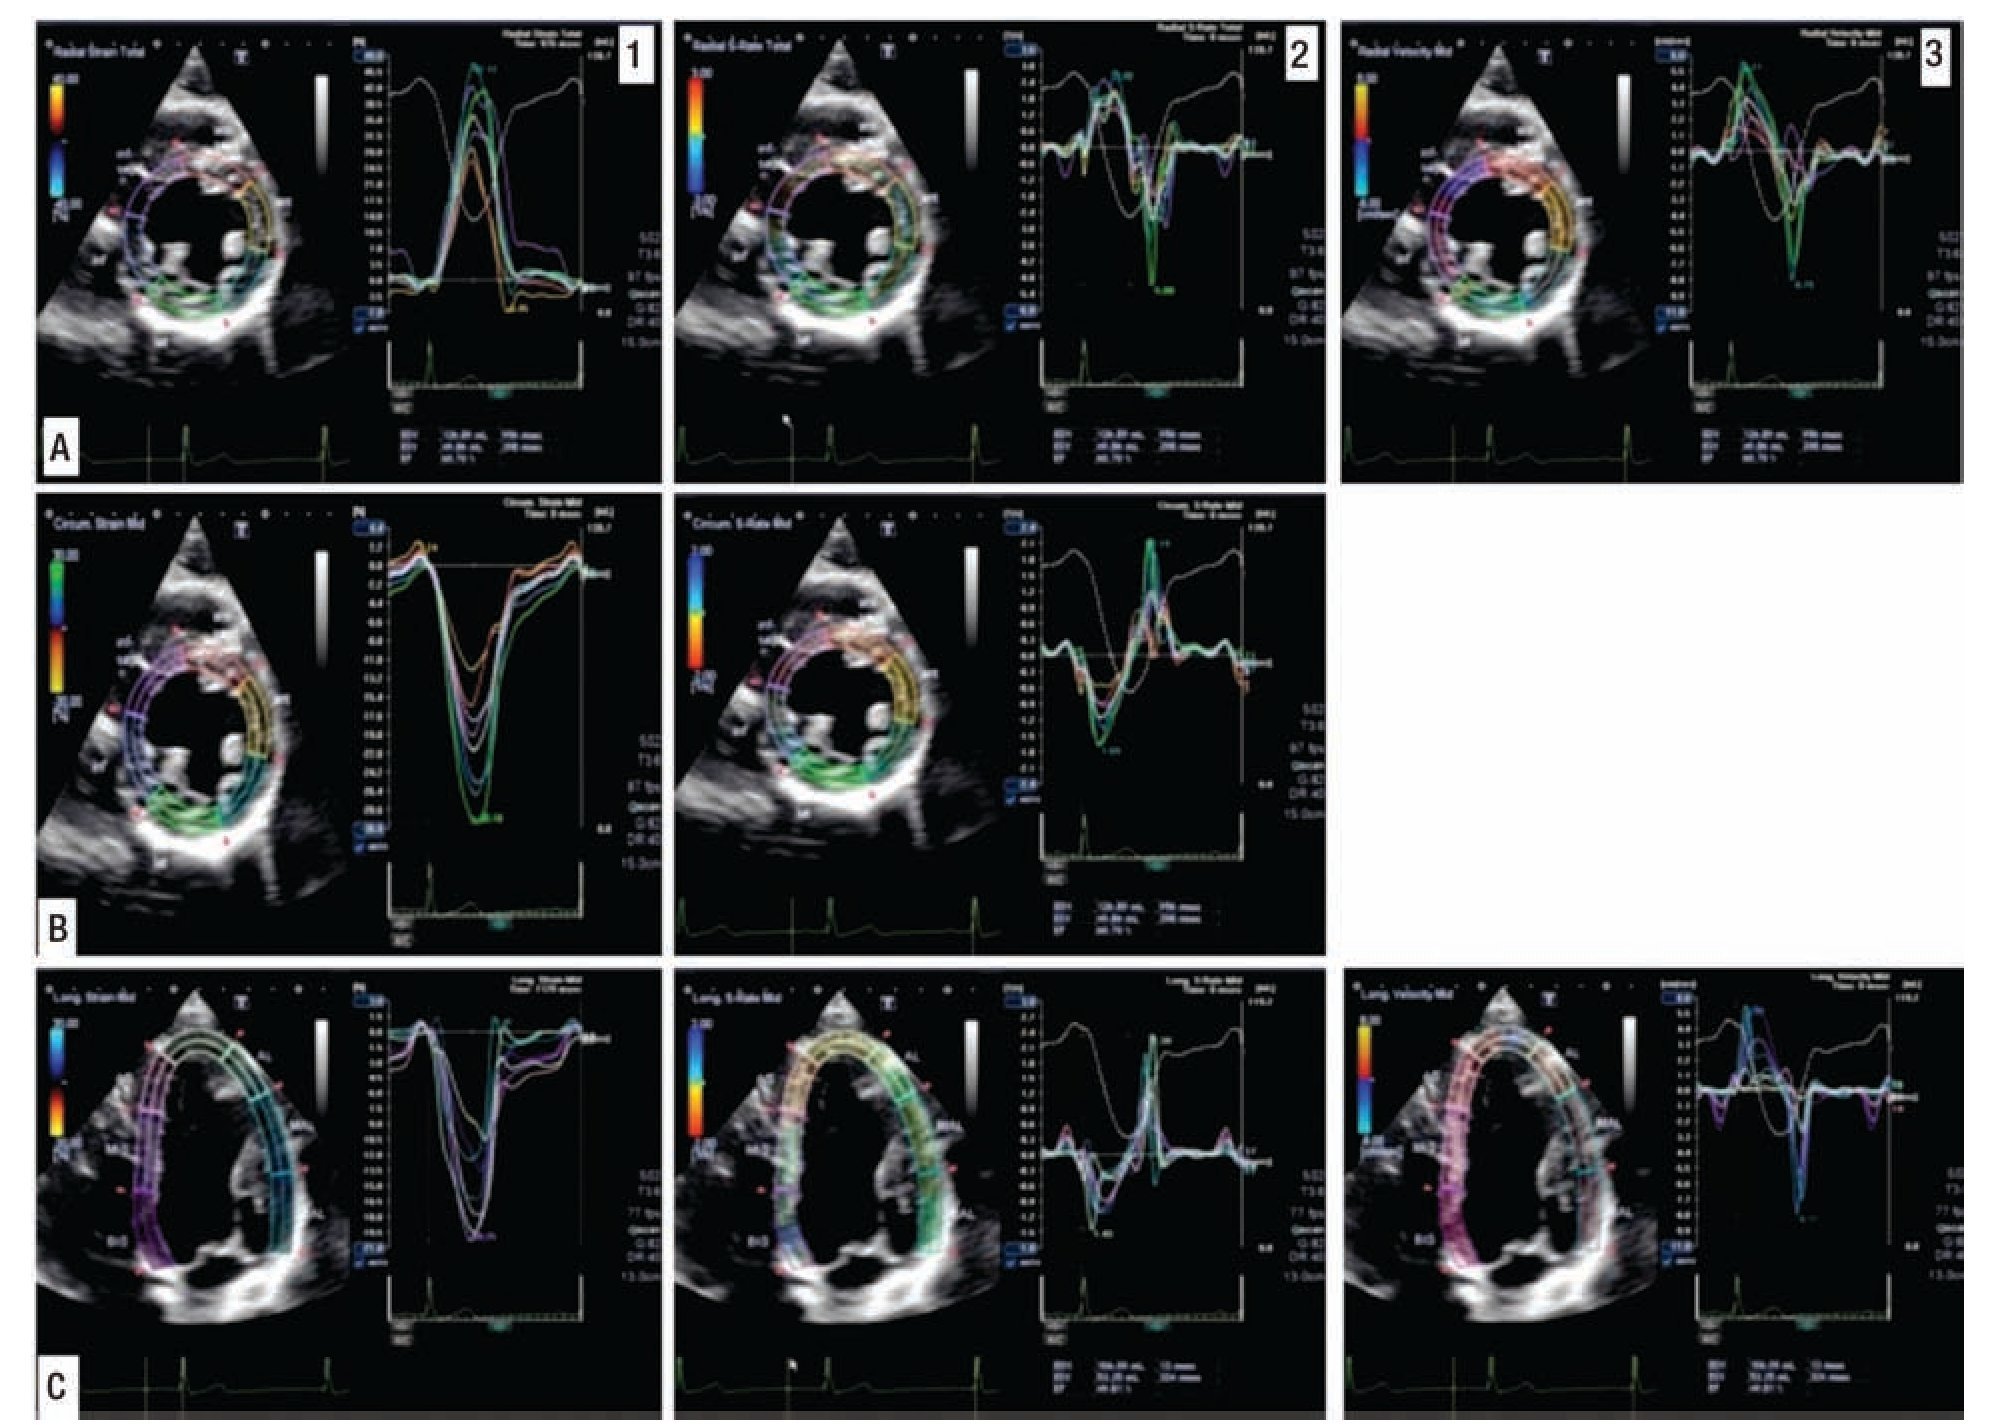
In the short-axis view, radial strain and circumferential strain can be calculated. These values are not independent, one is positive (wall thickening) when the other is negative (segment shortening) in a normal heart. In the apical four-, three-, and two-chamber views, transversal strain and longitudinal strain can be calculated45 (Figure 7).
Figure 7. Assessment of the main principal strain axes by two-dimensional speckle tracking in a healthy volunteer: A) radial, B) circumferential, and C) longitudinal axis. The first column represents measurement of strain in each main principal strain axis; the second column represents measurements of strain rate, and the third column tissue velocity.
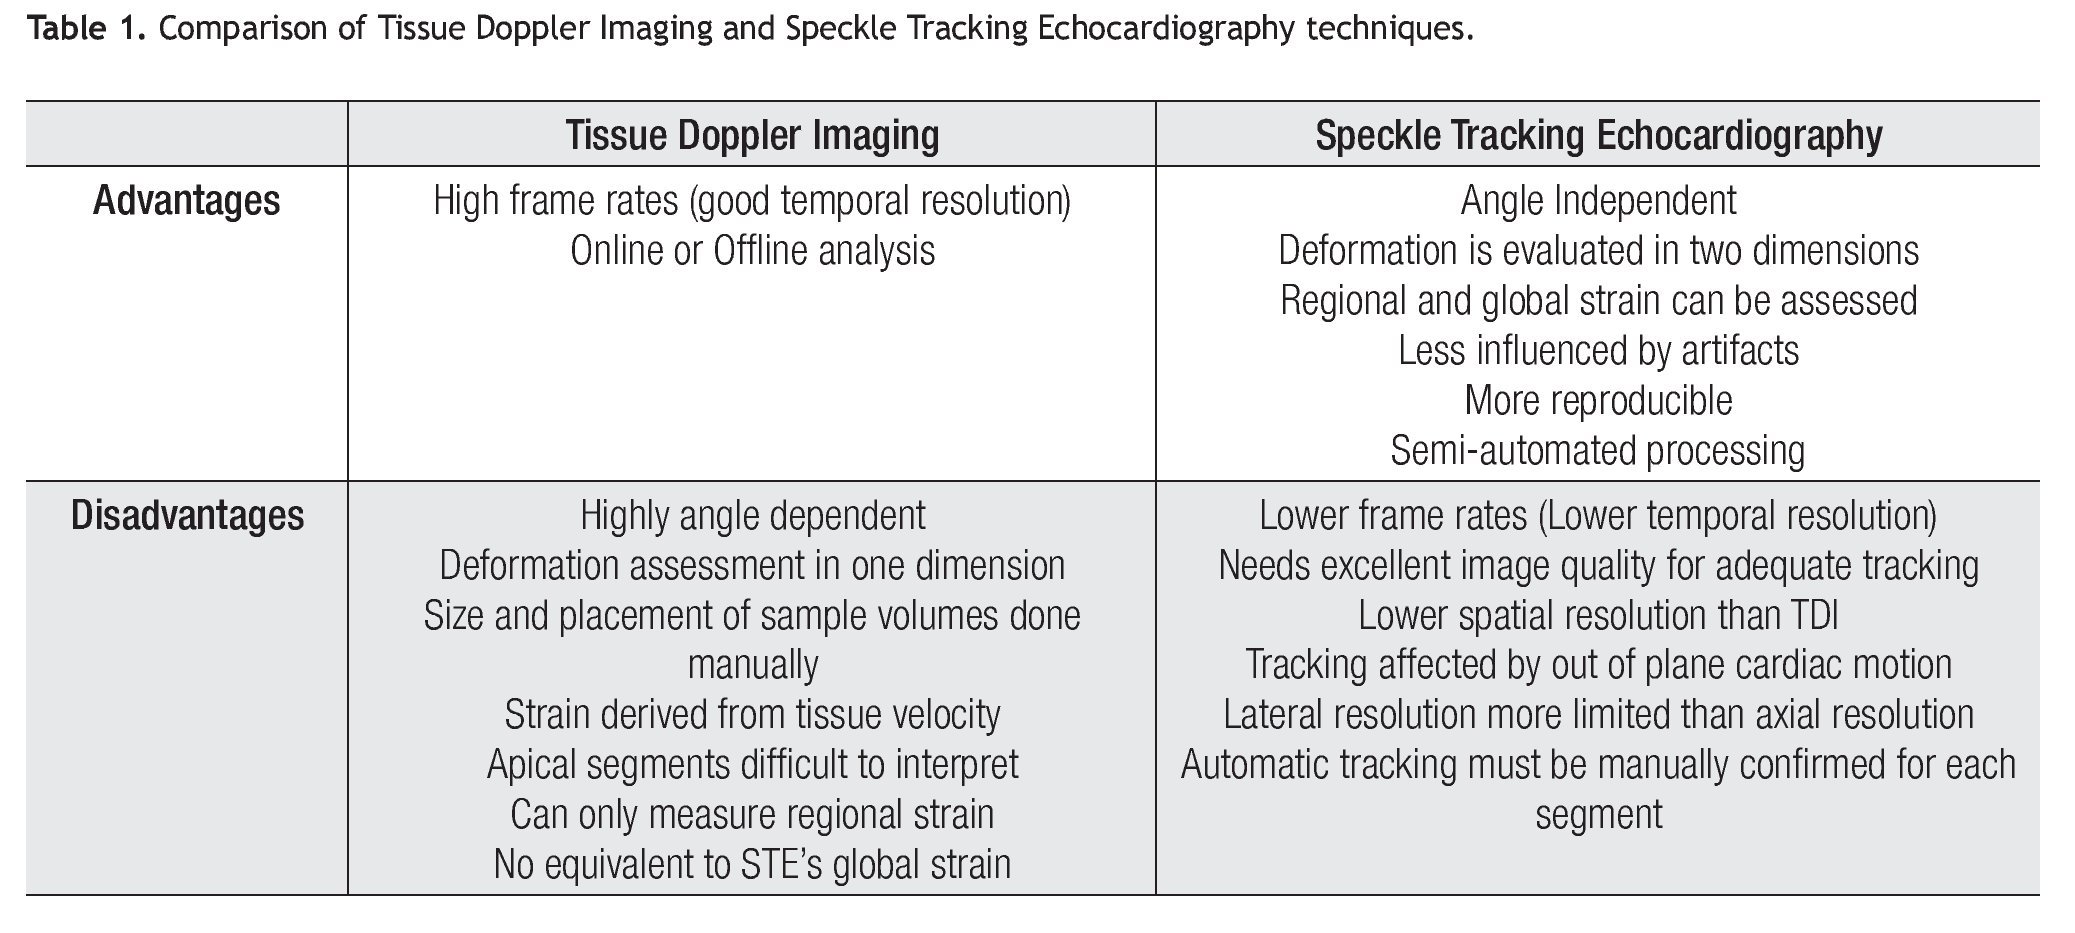
For these reasons, speckle tracking echocardiography provides a direct measure of myocardial deformation and appears to be a more robust method than Doppler-based strain imaging, which estimates strain as the time integral of spatial velocity gradients (Table 1).
Clinical applications: The potential of 2D speckle tracking echocardiography has been investigated in numerous experimental and clinical studies for exploration of systolic and diastolic ventricular function, assessing ischemia, dyssynchrony, and other cardiac conditions,46 some of which will be cited representatively in this review. In initial studies, Becker et al, used 2D speckle tracking imaging to assess regional LV function. They compared a healthy group with a group of patients with previous myocar-dial infarction. They assessed radial and circumferential strains, and tried to distinguish between normokinesis, hypokinesis, and akinesis based on the 16-segment American Heart Association model. All subjects underwent cardiac magnetic resonance imaging (CMRI). They found excellent correlation between the values obtained for peak radial and circumferential strains and the visual assessment of the MRI images. The sensitivity and specificity of this technique in the detection of dyssynergy were 83.5%. Furthermore, they demonstrated that this technique had good inter- and intra-observer variability when both measurements were performed using the same cardiac cycle.47 Even in acute clinical settings, such as myocardial infarction, this technique seemed to be of value in detection of transmurality and infarct size, systolic recovery after reperfusion, and diastolic dysfunction.48-49 Other groups centered their attention on ventricular torsion mechanics and compared it with tagged magnetic resonance imaging (MRI). The results of these studies demonstrated concordance in the estimation of LV torsion between speckle tracking and tagged MRI and made the assessment of LV rotation and torsion available in clinical cardiology.50,51 Furthermore, some groups have investigated its utility in evaluating diastolic dysfunction in different clinical settings.52,53 Additionally, two-dimensional speckle tracking enables the assessment of LV dyssynchrony and is a valuable tool to identify potential responders to cardiac resynchronization therapy.54
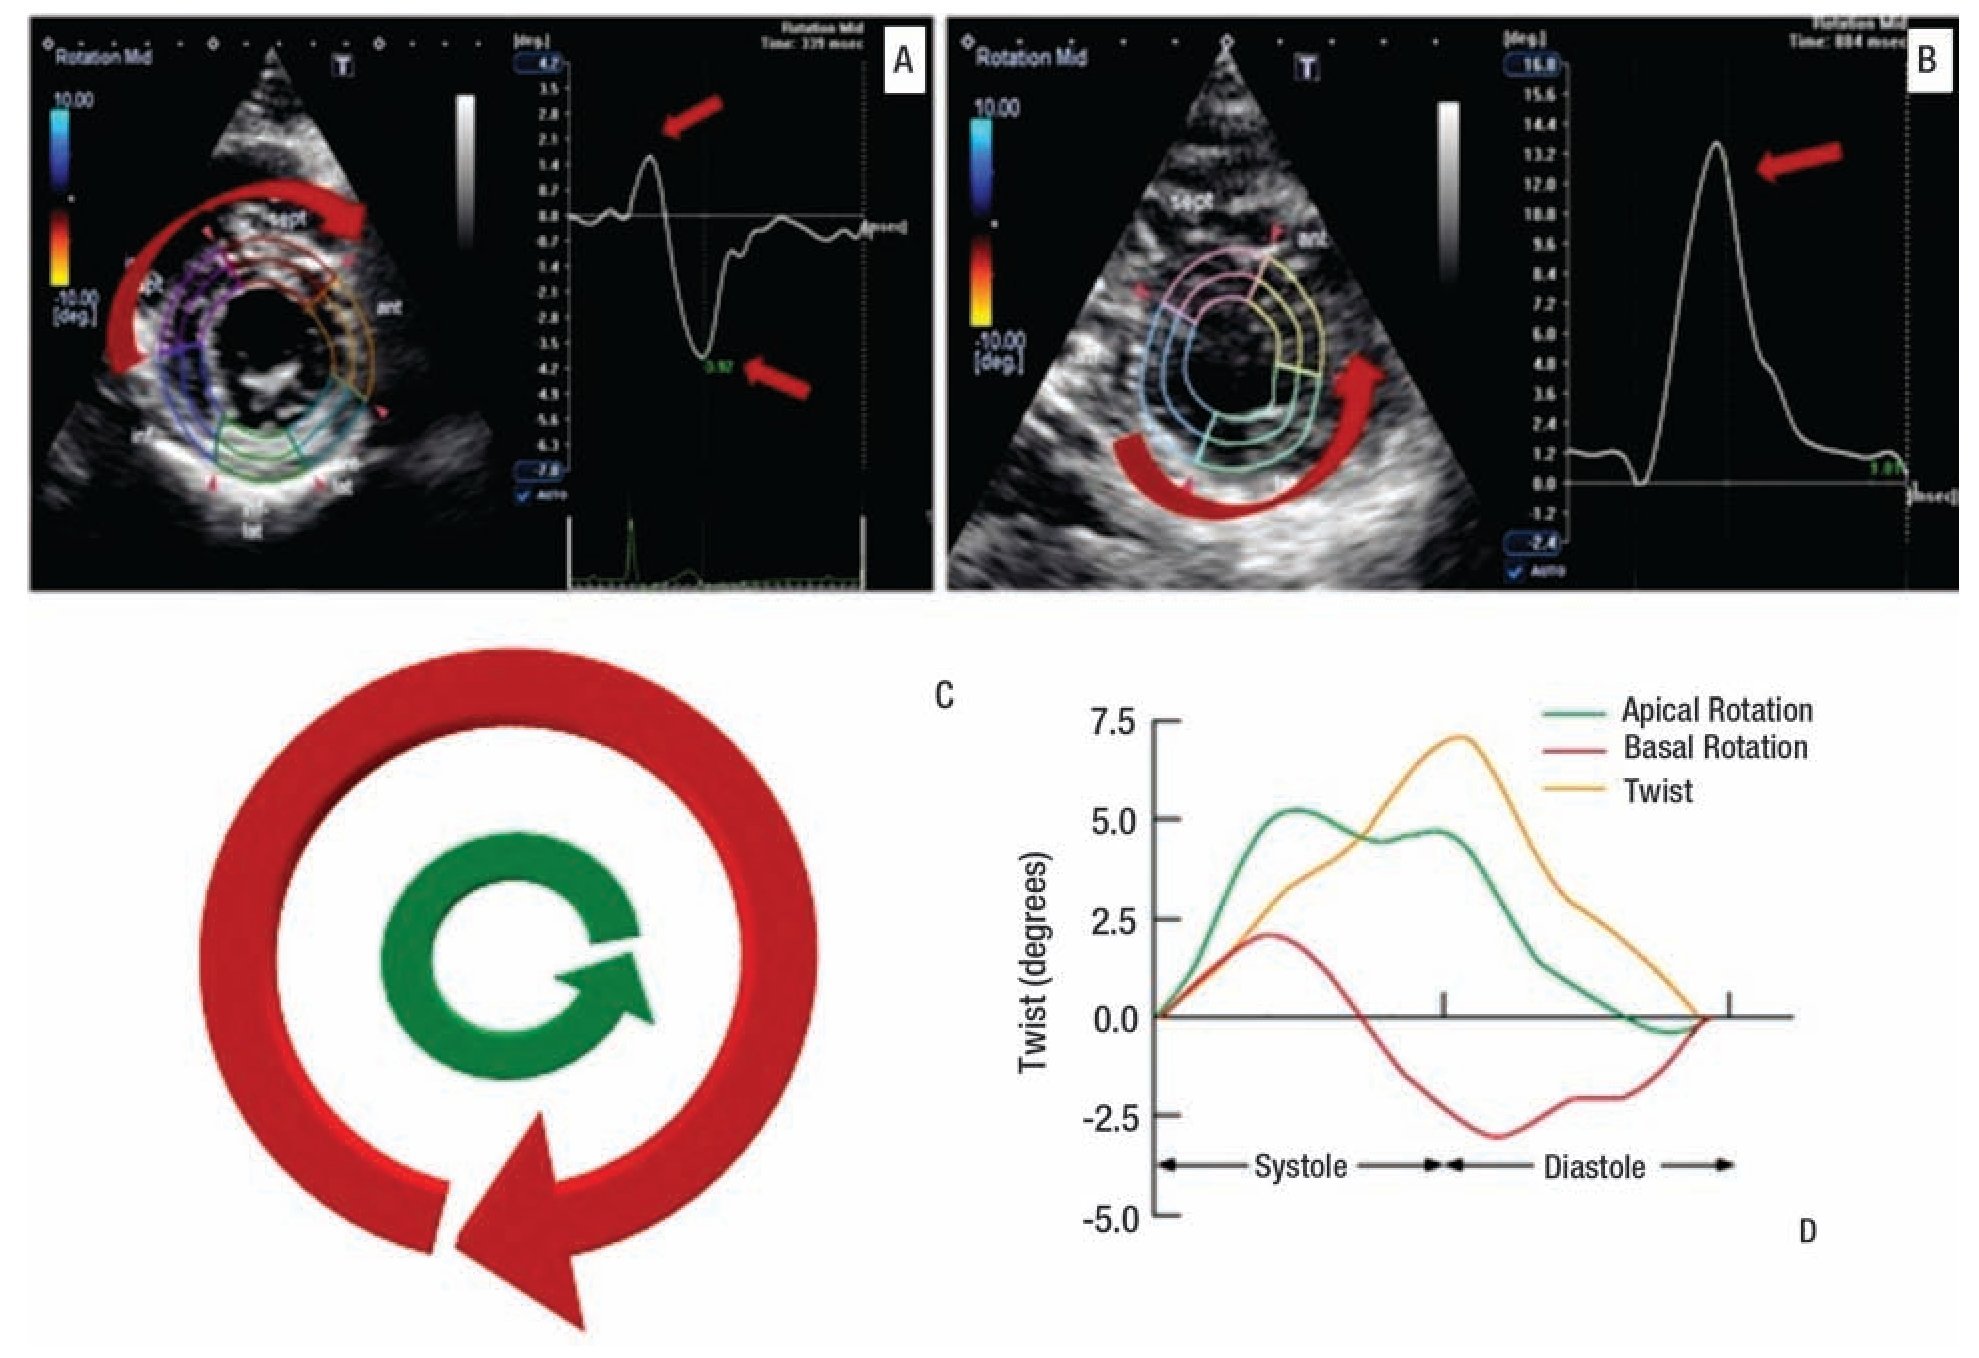
Torsion-twist: Left ventricular torsion is a critical component of cardiac biomechanics because it is important for normal ejection and suction and is a feature of the normal spread of excitation and connections among fibers. The human heart has a specific helical arrangement of the myofibers with a right-hand orientation from the base toward the apex in the endocardial layers and a left-hand orientation in the epicardial layers.55 In systole, the LV apex rotates counterclockwise (as viewed from the apex), whereas the base rotates clockwise, creating a torsional deformation originating in the dynamic interaction of oppositely wound epicardial and endocardial myocardial fiber helices. The difference between apex and base in the rotation angle is called twist and contributes significantly to LV ejection, in addition to myocardial shortening and thickening. It also has an important role in diastole since it contributes to diastolic suction in the early phases of ventricular filling in a process called untwist. Left ventricular torsion can be quantified by speckle tracking echocardiography. By measuring apical and basal rotation from LV short-axis recordings, twist has been explored in both clinical and experimental studies56,57 (Figure 8).
Figure 8. Above: Assessment of rotation by two-dimensional speckle tracking at the level of the base A) and apex, B) the figure at the right bottom, C) shows the rotational direction at base (red arrow) and apical (green arrow) levels of the left ventricle, and the plot, D) corresponds to their representation through the cardiac cycle and their relation with cardiac twist.
Three-dimensional speckle tracking echocardiography
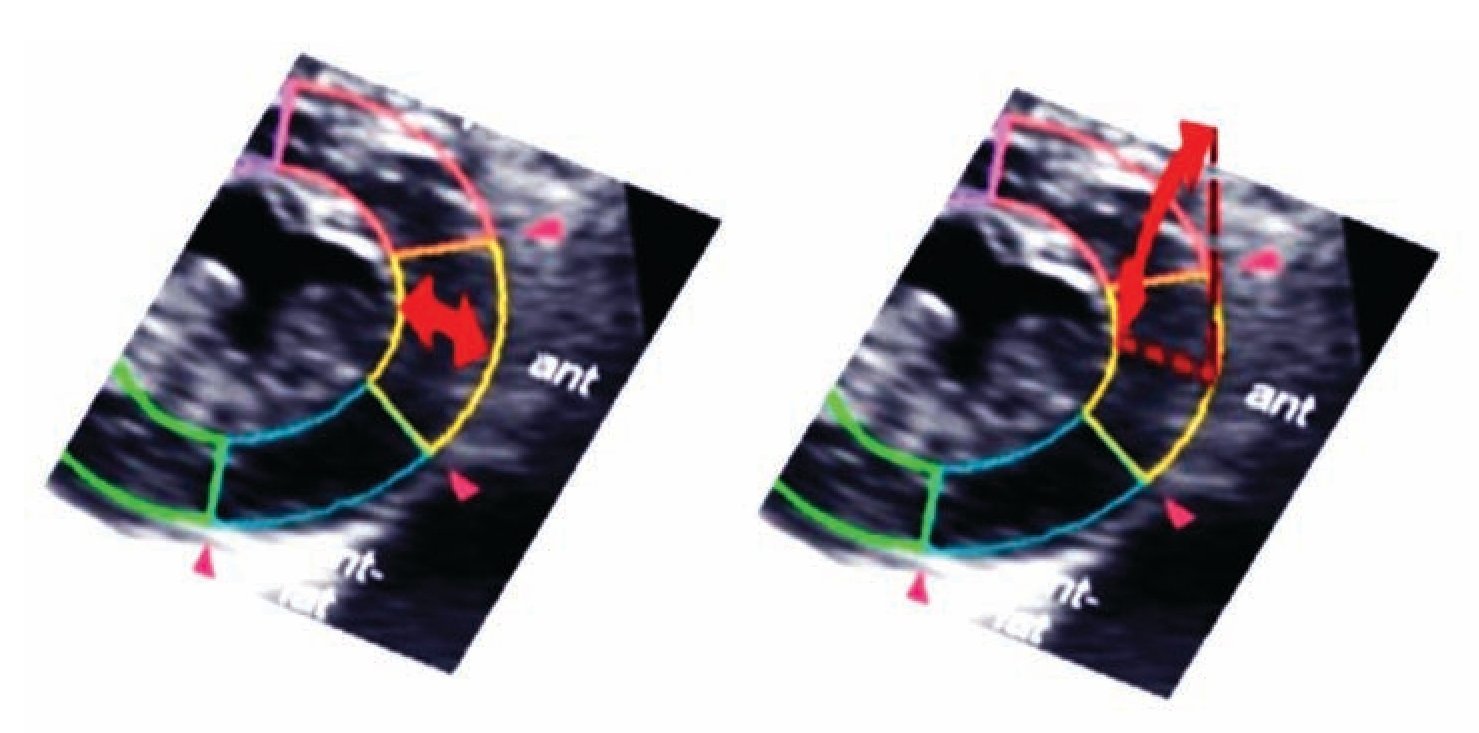
The interpretation of echocardiographic images requires a complex mental integration of different planes to understand anatomic structures and physiologic functions. Two-dimensional speckle tracking echocardiography and tissue Doppler imaging are limited to two-dimensional analysis (Figure 9).
Figure 9. Tracking in Two-dimensional images is affected by out of plane cardiac motion.
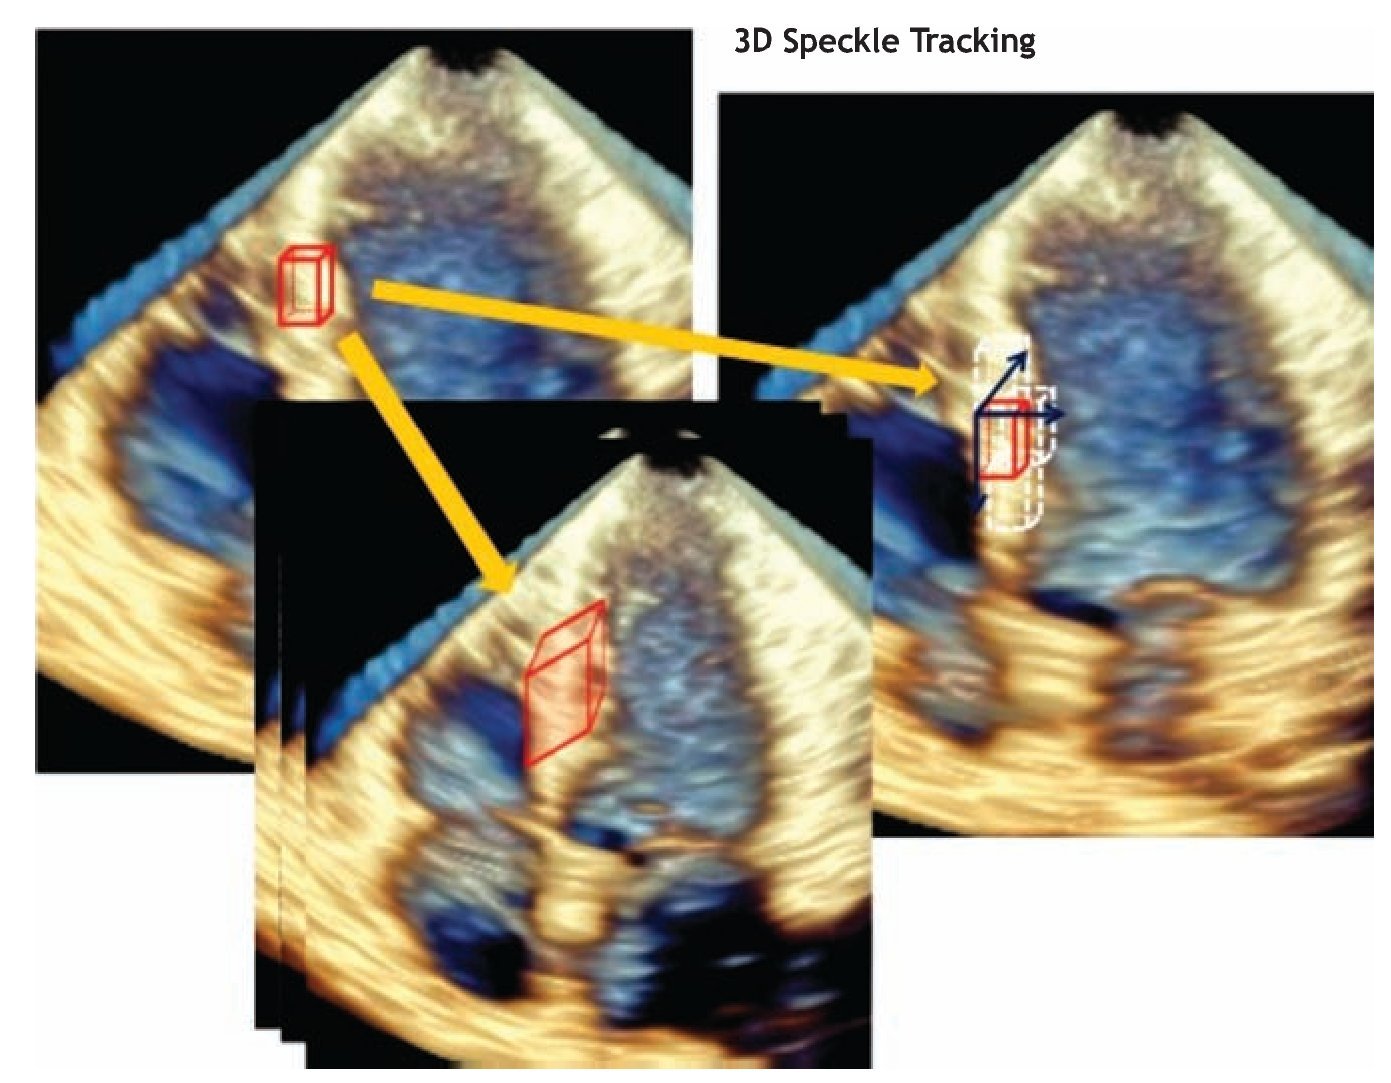
The recent development of ultrasound systems with the capability to acquire real-time full volume data of the whole left ventricle makes it possible to perform speckle tracking in three dimensions, and thereby track the real motion of the myocardium. Instead of using two-dimensional templates to view two-dimension movement, cubic templates allow motion analysis of the entire ventricle in three-dimension.58,59 As a consequence, three-dimensional speckle tracking is emerging as a new instrument that can be used for regional wall motion analysis of the entire left ventricle, allowing acquisition and evaluation of real three-dimensional indices and wall motion accurately.60
Three-Dimensional speckle tracking takes into account the motion of the cardiac wall not only in a concrete plane (radial, longitudinal, circumferential, and transversal) but also in three dimensions. The rationale for this is that from only one apical position, the entire ventricle may be analyzed; a 90 × 90° triggered full volume is obtained and the echocardiographer does not need to change to different positions to obtain different planes61 (Figure 10). That is why the three-dimensional format more closely represents reality and better accuracy than the two-dimensional format.62
Figure 10. Using a full 3D template, the software can track the complete speckle's movement through the cardiac cycle, avoiding out of plane cardiac motion.
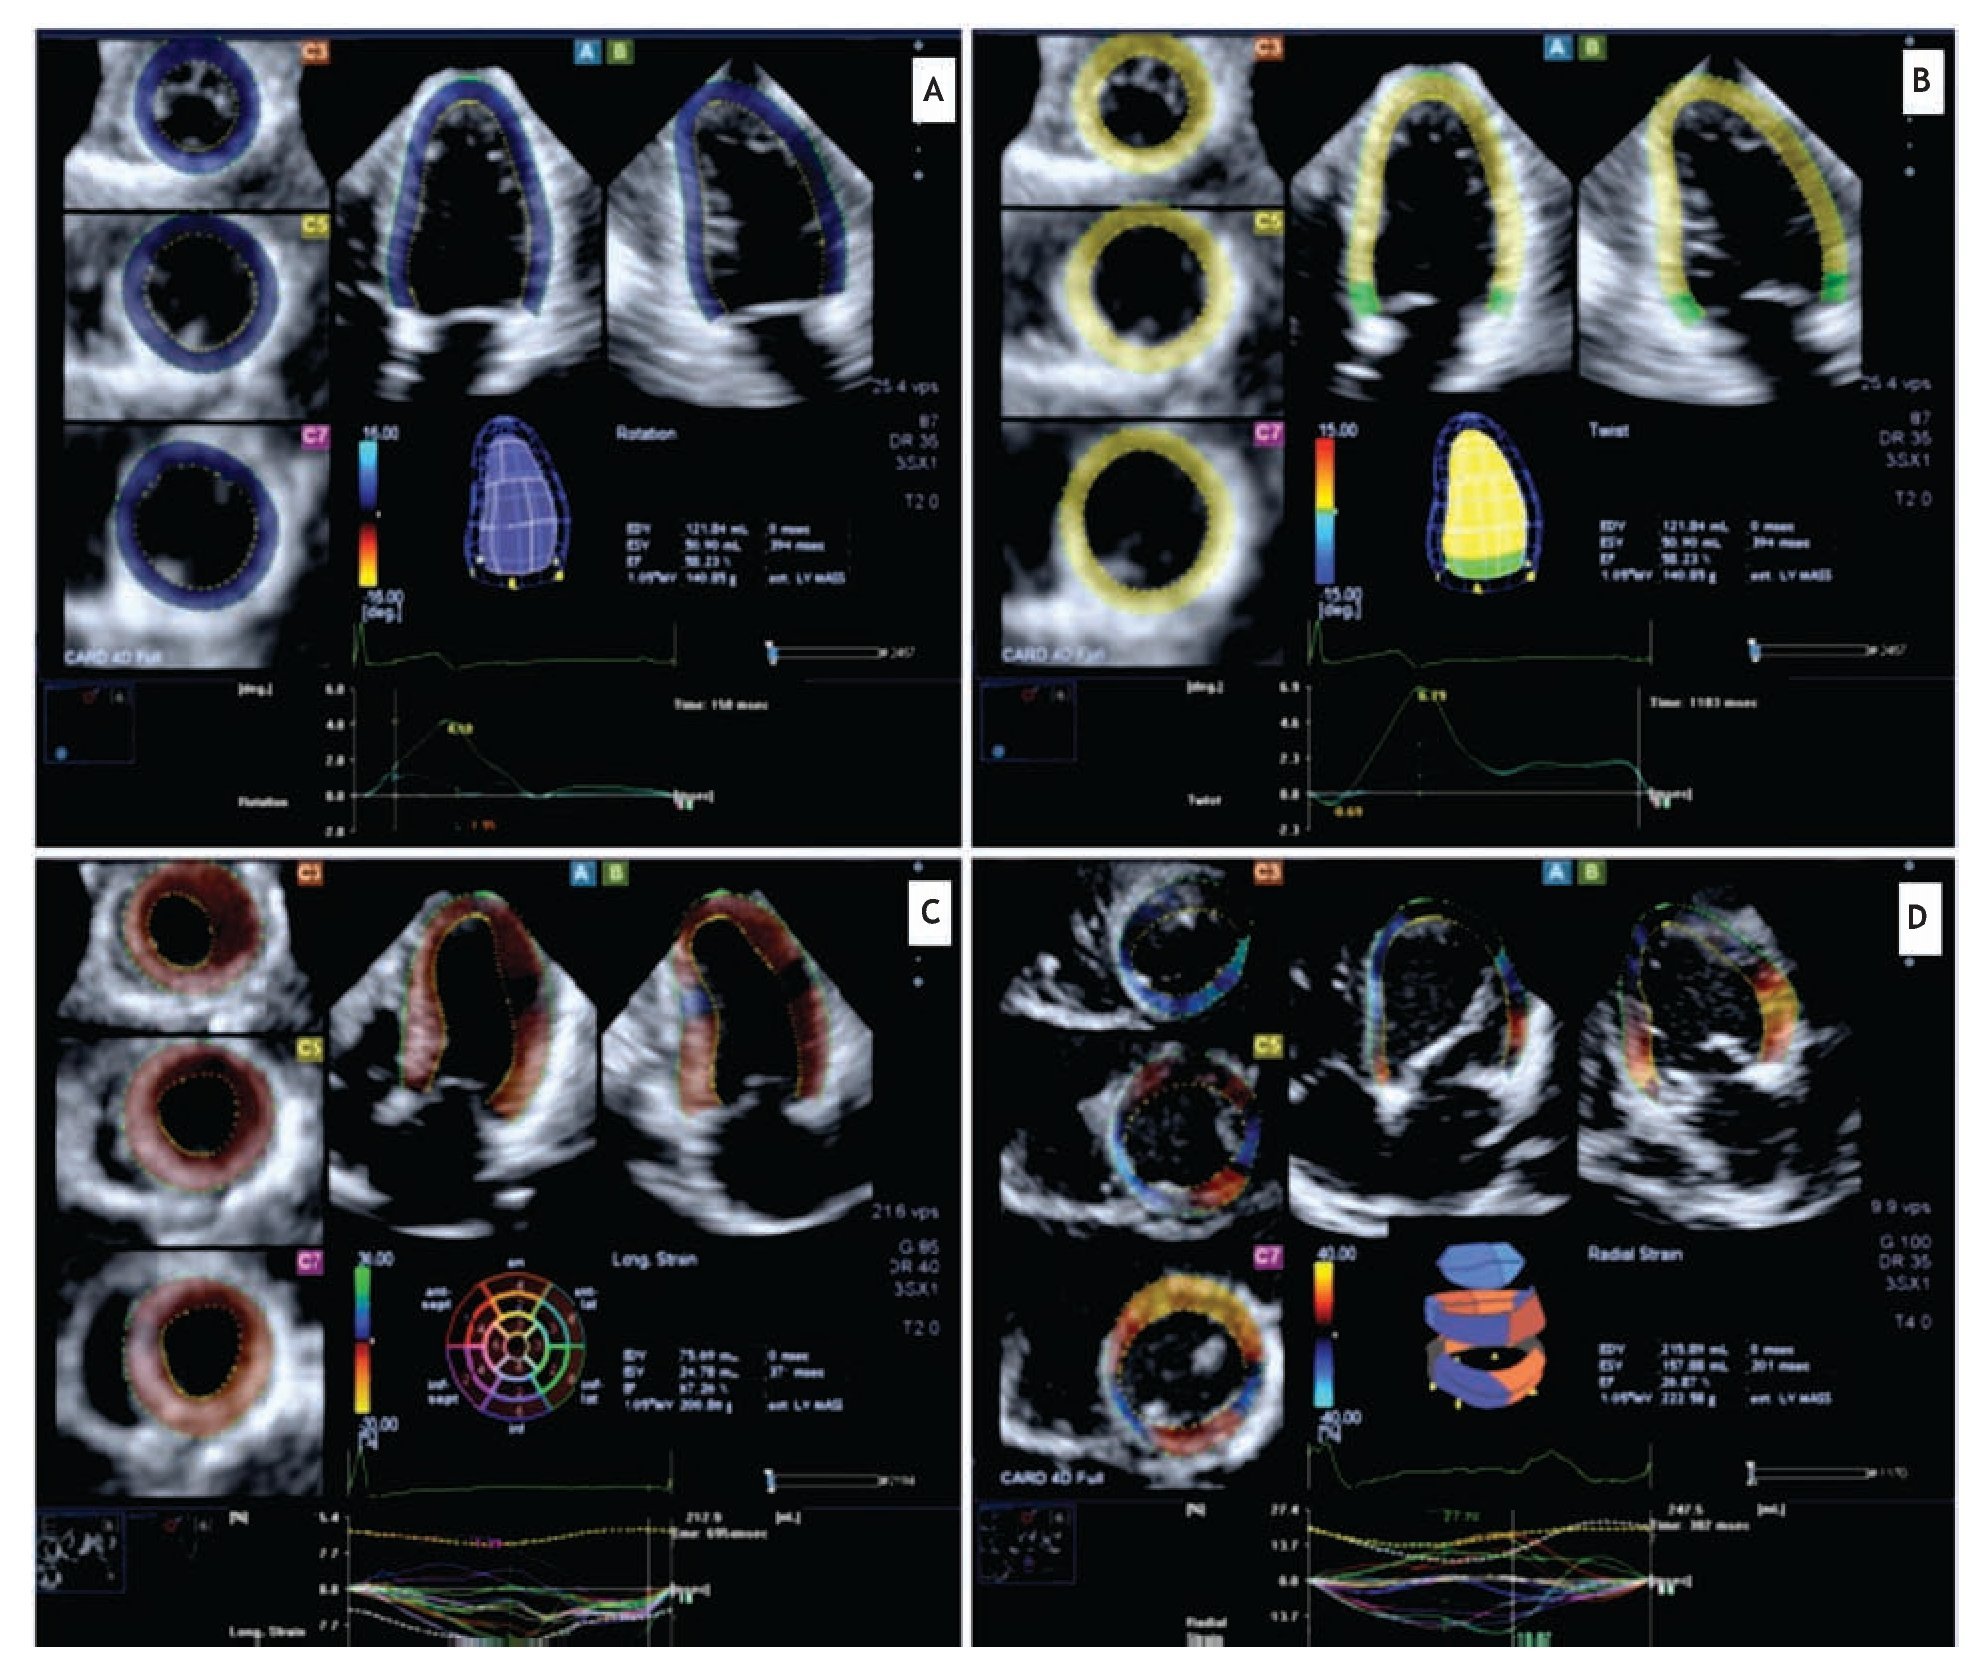
Clinical application: Three dimensional speckle tracking is a recent modality and its clinical application is currently being evaluated. In an early work with 3D speckle tracking echocardiography, Pérez de Isla et al, studied 30 patients with different pathology (namely, coronary artery disease, diabetes mellitus, hypertension, and hyperlipidemia), and they found that this technique was able to quickly and accurately evaluate cardiac deformation in its three main vectors when it was compared with 2D speckle tracking imaging.61 Saito and coworkers performed further research measuring radial, longitudinal, and circumferential strain in a normal population and comparing it with 2D speckle tracking. They concluded that 3D speckle tracking "is a simple, feasible, and reproducible method to measure strain". They also reported differences in strain measurements and time to perform a complete 3DSTE analysis compared with 2D speckle tracking results.60 Maffessanti et al recently published work exploring the utility of this technique in normal populations and patients with cardiac disease (dilated myocardiopathy, coronary artery disease, myocardiopathy secondary to myocarditis and valvular disease), finding superiority of this technique with respect to 2D STE in regards to quantification of global and regional function and detection of regional abnormalities.63 Three-dimensional speckle tracking echocardiography is a promising technique that has the advantage of measuring real myocardial function compared with conventional 2D speckle tracking echocardiography. Currently 3D STE is being applied in the clinical field by several groups around the world.64,65 Examples of the current clinical applications of 3D speckle tracking are demonstrated in Figure 11.
Current limitations of speckle tracking echo-cardiography
The dependence of speckle tracking echocardiography on frame-by-frame tracking of the myocardial pattern makes it dependent on image factors including reverberation artifacts and attenuation; technical proficiency remains important in image processing: (1) misplacing points at the time of tracing endocardial borders might result in apparent wall motion abnormalities and misleading outcomes or result in poor tracking, (2) excessive region of interest width (e.g., including the pericardium) might have an adverse influence on tracking quality, and (3) insufficient region of interest width might increase the variability of strain by compromising the reproducibility of these measurements. In three-dimensional speckle tracking, the number of beams needed in full-volume acquisition of the left ventricle limits its frame rate (commercial systems are currently able to assess full volume images of the left ventricle at a rate of about 20 to 30 frames per second)46,66 resulting in low temporal and spatial resolution (Table 1 Advantages and Disadvantages of Speckle Tracking). Further improvement of spatial and temporal resolution of 3D STE is likely to overcome these drawbacks. As speckle tracking echocardiography evolves and becomes familiar, it will be mandatory to ensure standardization of terminology, steps in data acquisition, and optimal training to increase data accuracy and reproducibility.
Conclusion
A developing body of evidence suggests that assessment of LV mechanics by tissue Doppler imaging and speckle tracking echocardiography offers valuable information in several clinical scenarios. Understanding such events could provide novel insight into the mechanisms of LV dys-function, and may have the potential to identify subtle changes in LV mechanics in patients with subclinical myocar-dial dysfunction. With the advent of 3D echocardiography, three dimensional speckle tracking is emerging as a new tool that combines the usefulness of myocardial motion tracking with a better integration of the anatomic structures and physiologic function of the heart. The evidence for the utility of this tool is growing and offers valuable advantages over TDI and two dimensional speckle tracking echocardiography, holding the promise for a better understanding of the mechanisms of LV dysfunction and tracking the impact of current and future therapies.
Figure 11. Three-dimensional speckle tracking: A) Example of rotation assessment at three different levels of the left ventricle in a healthy volunteer and its relation with twist, B and C) patient with hypertrophic cardiomyopathy, evaluation of longitudinal strain, D) patient with dilated myocardiopathy assessment of left ventricular volumes and radial strain.
Corresponding author: José Antonio Arias Godínez.
Instituto Nacional de Cardiología Ignacio Chávez. Juan Badiano Núm. 1, Col. Sección XVI, Delegación Tlalpan, 14080 México, D.F. México.
E- mail:antonioarias1407@gmail.com
Received on May 13, 2010;
accepted on February 13, 2011.


