


To assess the association between dietary patterns and glycemic control among patients with type II diabetes mellitus (T2DM).
DesignA cross-sectional study.
SiteThe 2015–2018 National Health and Nutrition Examination Survey (NHANES).
ParticipantsA total of 1646 T2DM patients were included, of whom 854 were hyperglycemia.
MethodsMain dietary patterns were identified using the sparse principal components analysis (SPCA). Logistic regression analysis was applied to investigate the association between each dietary pattern and the risk of hyperglycemia with odds ratios (OR) and 95% confidence intervals (CI). SPCA analysis yielded five significant principal components (PC), which represented five main dietary patterns.
ResultsPC1, characterized by a high intake of sweets, red meat and processed meat, was associated with higher odds of hyperglycemia in patients who underwent hyperglycemic drug or insulin treatments (OR: 1.71, 95% CI: 1.10–2.64). PC5, characterized by high in red meat, while low in coffee, sweets, and high-fat dairy consumption. The relationship between the PC5 and hyperglycemia was marginal significance (OR: 0.63, 95% CI: 0.38–1.02). PC2 was characterized by a high consumption of green vegetables, other vegetables, and whole grains, and low intake of potatoes and processed meat. In patients with the hyperglycemic drug and insulin free, higher PC2 levels were related to lower odds of hyperglycemia (OR: 0.45, 95% CI: 0.21–0.96).
ConclusionsHigh intake of sweets, red meat, and processed meat might be detrimental to glycemic control in patients with drug-treated T2DM. High in red meat, while low in coffee, sweets, and high-fat dairy consumption may be beneficial to glycemic control. In addition, high consumption of green vegetables, other vegetables, and whole grains, and low intake of potatoes and processed meat may be good for glycemic control in patients without drug-treated T2DM.
Evaluar la relación entre el patrón dietético y el control de la glucosa en sangre en los pacientes con diabetes mellitus tipo II (DM2).
DiseñoEstudio transversal.
SitioEncuesta Nacional de Salud y Nutrición 2015-2018 (NHANES).
ParticipantesUn total de 1.646 pacientes con DM2 fueron incluidos, de los cuales 854 fueron pacientes con hiperglucemia.
MétodoSe utilizó el método de análisis de componentes principales escasos (SPCA) para determinar el modo dietético principal. Se aplicó un análisis de regresión logística para estudiar la relación entre cada patrón dietético y el riesgo de hiperglucemia con una relación de relación (OR) y un intervalo de confianza (IC) del 95%. El análisis del SPCA ha obtenido 5 componentes principales importantes (PC), que representan los 5 principales patrones alimenticios.
ResultadosEl PC1 se caracteriza por una alta ingesta de dulces, carnes rojas y procesadas, y se asocia con una mayor probabilidad de hiperglucemia en los pacientes tratados con medicamentos hiperglucémicos o insulina (OR: 171; IC 95%: 1,10-2,64). El PC5, que se caracteriza por un alto contenido de carne roja, mientras que el consumo de café, dulces y productos lácteos ricos en grasas es bajo. La relación entre PC5 y la hiperglucemia fue marginal (OR: 0,63; IC 95%: 0,38-1,02). El PC2 se caracteriza por un alto consumo de verduras verdes, otras verduras y cereales integrales, y una baja ingesta de patatas y carne procesada. Los niveles más altos de PC2 se asociaron con una menor probabilidad de hiperglucemia (OR: 4,45; IC 95%: 0,21-0,96) en los pacientes que tomaban medicamentos hiperglucémicos y no tenían insulina.
ConclusiónLa alta ingesta de dulces, carnes rojas y procesadas puede no ser propicia para el control de la glucosa en sangre en los pacientes con DM2 tratados con medicamentos. La ingesta de carne roja alta, café bajo, dulces y productos lácteos ricos en grasas puede favorecer el control de la glucosa en sangre. Además, el alto consumo de verduras verdes, otras verduras y cereales integrales, la baja ingesta de patatas y de carne procesada pueden favorecer el control de la glucosa en sangre en los pacientes con DM2 sin tratamiento farmacológico.
Diabetes mellitus (DM), affecting 10.5% of adults aged 20–79 years worldwide in 2021, is predicted to influence 783.2 million people by 2045, according to the International Diabetes Federation (IDF).1 Globally, the direct annual economic cost relating to diabetes is estimated to be $966 billion in 2021, and the expenditure is projected to reach $1054 billion by 2045.1 The most prevalent type of diabetes is type II DM (T2DM), characterized by chronic hyperglycemia and insulin resistance as the results of pancreatic beta-cell dysfunction, which accounts for approximately 90% of the diabetes cases.2,3 Common T2DM complications are diabetic retinopathy, poor oral health, gestational diabetes, cardiovascular disease, renal disease, and neuropathy,3,4 leading to increased risk of early death and low life quality.
When examining the therapeutic effect of diet on T2DM, certain food groups and micronutrients, such as whole grains, fruits, dairies, red meat, processed meat, sugar-sweetened beverages, vitamin D, and zinc, are found to associate with T2DM.5,6 However, dietary patterning studies have been increasingly favored over studies on a single nutrient intake or specific dietary components because human dietary consumption is holistic rather than atomistic. Several diets have been proposed to be effective in glycemic control, including but not limited to low-carbohydrate diet, vegetarian, and Mediterranean diet.7–10
Although current T2DM dietary patterning studies provide some perspectives for managing T2DM,8,10,11 the findings are confined to general interpretations and applications. For instance, the consumption of whole grain, a type of carbohydrate, showed a protective effect of T2DM.12 Yet, low-carbohydrate diet restricts carbohydrate intake in general, ignoring the salutary effect of whole grain and potentially obstructing optimal glycemic management through dietary intervention. Therefore, precisely identifying the distinctive features of the food components is essential in diet patterning studies.
Addressing distinctions of food components precisely while maintaining a holistic perspective is extremely challenging in dietary patterning study. Sparse principal components analysis (SPCA) is a statistical approach that extracts food components and derive dietary patterns in terms of variance.13,14 The analytic method reduced the complication of the data by ignoring the weak association and is therefore practical for analysis of various food components. In the current study, we aimed to examine the relationship between dietary patterns and glycemic control among T2DM patients with a more detailed classification of the food groups.
MethodsStudy design and participantsThis cross-sectional study retrieved data from the 2015–2018 National Health and Nutrition Examination Survey (NHANES). The NHANES was a nation-wide health-related program conducted by the National Center for Health Statistics (NCHS), aiming to provide representative estimates of the total noninstitutionalized civilians in the United States.15 As a multi-stage continuous survey, the NHANES sampled approximately 5000 people annually, the data of which were released on the NHANES official website for public use (https://www.cdc.gov/nchs/nhanes/index.htm). Consisting of two parts, the NHANES performed a physical examination in the Mobile Examination Center (MEC) and an in-person health interview in each cycle. Blood, urine, and other biological specimens were collected during the MEC examination, while questionnaires were administered during the interview.
All protocols were approved by the NCHS Research Ethics Review Board, and informed consent was obtained from the participants before the study. The full procedures of the interview and physical examination were available for review at the NHANES official website (https://wwwn.cdc.gov/nchs/nhanes/ContinuousNhanes/Manuals.aspx?BeginYear=2015). This study analyzed de-identified public database, and thus was exempt from future ethics review board approval of the Qingdao Municipal Hospital. The NHANES 2015–2016 and 2017–2018 were selected in this research to ensure the consistency of the study design and recency of the database. After excluding patients with type I diabetes, or missing data, 1646 T2DM patients were eligible for the study.
Diabetes definitionDiabetic patients were determined based on the following three criteria:
- (i)
Diabetes Questionnaire (DIQ)16: question DIQ010 asked, “The next questions are about specific medical conditions. {Other than during pregnancy, {have you/has SP}/{Have you/Has SP}} ever been told by a doctor or health professional that {you have/{he/she/SP} has} diabetes or sugar diabetes?” Participants who answered “yes” were considered diabetic.
- (ii)
Prescription medication use questionnaire (RXQ)17: participants who reported using chlorpropamide, diazoxide, glipizide, glyburide, insulin, tolazamide, metformin, acarbose, glimepiride, miglitol, troglitazone, repaglinide, rosiglitazone maleate, pioglitazone, and nateglinide, were classified as diabetic patients. Patients who reported taking medication other than the aforementioned drugs were defined as using other hyperglycemic drugs.
- (iii)
Blood sample from laboratory data18,19: fasting blood glucose level ≥126mg/dL or hemoglobin A1c ≥6.5%.
The glycemic control was defined as a glycated hemoglobin level of less than 7.0%.20 Hemoglobin A1c ≥7.0% was categorized into the hyperglycemia group.
Dietary assessmentTwo 24-h dietary recalls of two days were administered to the participants by NHANES, the information of which was collected using the validated USDA Automated Multiple-Pass Method.21 Dietary Interview dataset was used to identify the individual food intake and classify the food groups.22 Food group categorization considered food groups that were associated with T2DM and its complication and comorbidities.6,8,11,23,24 Fourteen food components were initially identified: meat, fish, eggs, dairy, alcoholic beverages, caffeinated beverages, fruits, juice, vegetables, grains, snacks, sweets, nuts and seeds, beverages, with certain elements sub-divided due to their distinctive features. Meat was further divided into processed meat, red meat, organ meat, and poultry. Dairy was sub-divided to low-fat and high-fat dairies. Alcoholic drinks were classified as beer, wine, and liquor. Caffeinated drinks included coffee and tea. The vegetable category contained green vegetables, yellow vegetables, legumes, potatoes, and other vegetables. Grains were categorized as whole grains and refined grains. A total of 27 food groups were determined in the final analysis of this research.
Potential covariatesThe influencing factors of T2DM, such as environment, genetics, lifestyle, and diet, were multifaced and interacting with one another.25 Since one study can only contain and assess a limited number of covariates, this study examined significant covariates and demographics relating to T2DM, including sex, age, body mass index (BMI), ethnicity, marital status, education level, smoking, poverty income ratio (PIR), and hyperglycemic medication use.
Statistical analysisDescriptive statistics presented normally distributed continuous variables in mean and standard error (SE) and categorical variables in frequencies and percent distribution (n, %). Intergroup comparison of the continuous and categorical variables was made by the Pearson chi-square test or Student t-test when appropriate.
SPCA was applied to generate the five most prominent principal components (PC), which represented five different dietary patterns. Each PC was further divided into Q for logistic regression analysis. The multivariate logistic regression model adjusting for potential covariates was implemented to compare the five dietary patterns and obtain the odds ratio (OR) and 95% confidence interval (95% CI).
Each NHANES year purposely oversampled a particular group of people to increase the representativeness of the sample in the U.S. Sample weight (full sample 2-year MEC examination weight) of the 2015–2018 cycle was applied to all analyses in this study. A P-value of less than 0.05 was considered significant. All statistical analyses were two-tail tests and were performed using SAS 9.4 (SAS Institute, Inc., Cary, NC, USA) and Python 3.7 (Python Software Foundation, Beaverton, OR, USA).
ResultsPC identificationFive prominent PC was identified using the SPCA, as shown in Fig. 1. PC1 characterized by a high intake of sweets, red meat, and processed meat, while PC2 was characterized by a high consumption of green vegetables, other vegetables, and whole grains, and low intake of potatoes, and processed meat. In PC3, a high intake of snacks, liquor, and wine was identified. The dietary pattern of PC4 was concentrated on high energy drinks consumption. The characteristics of PC5 dietary pattern were high in red meat, while low in coffee, sweets, and high-fat dairy consumption. Each PC was further divided into quartiles to analyze the potential association between the dietary pattern and glycemic control.
Characteristics of study population
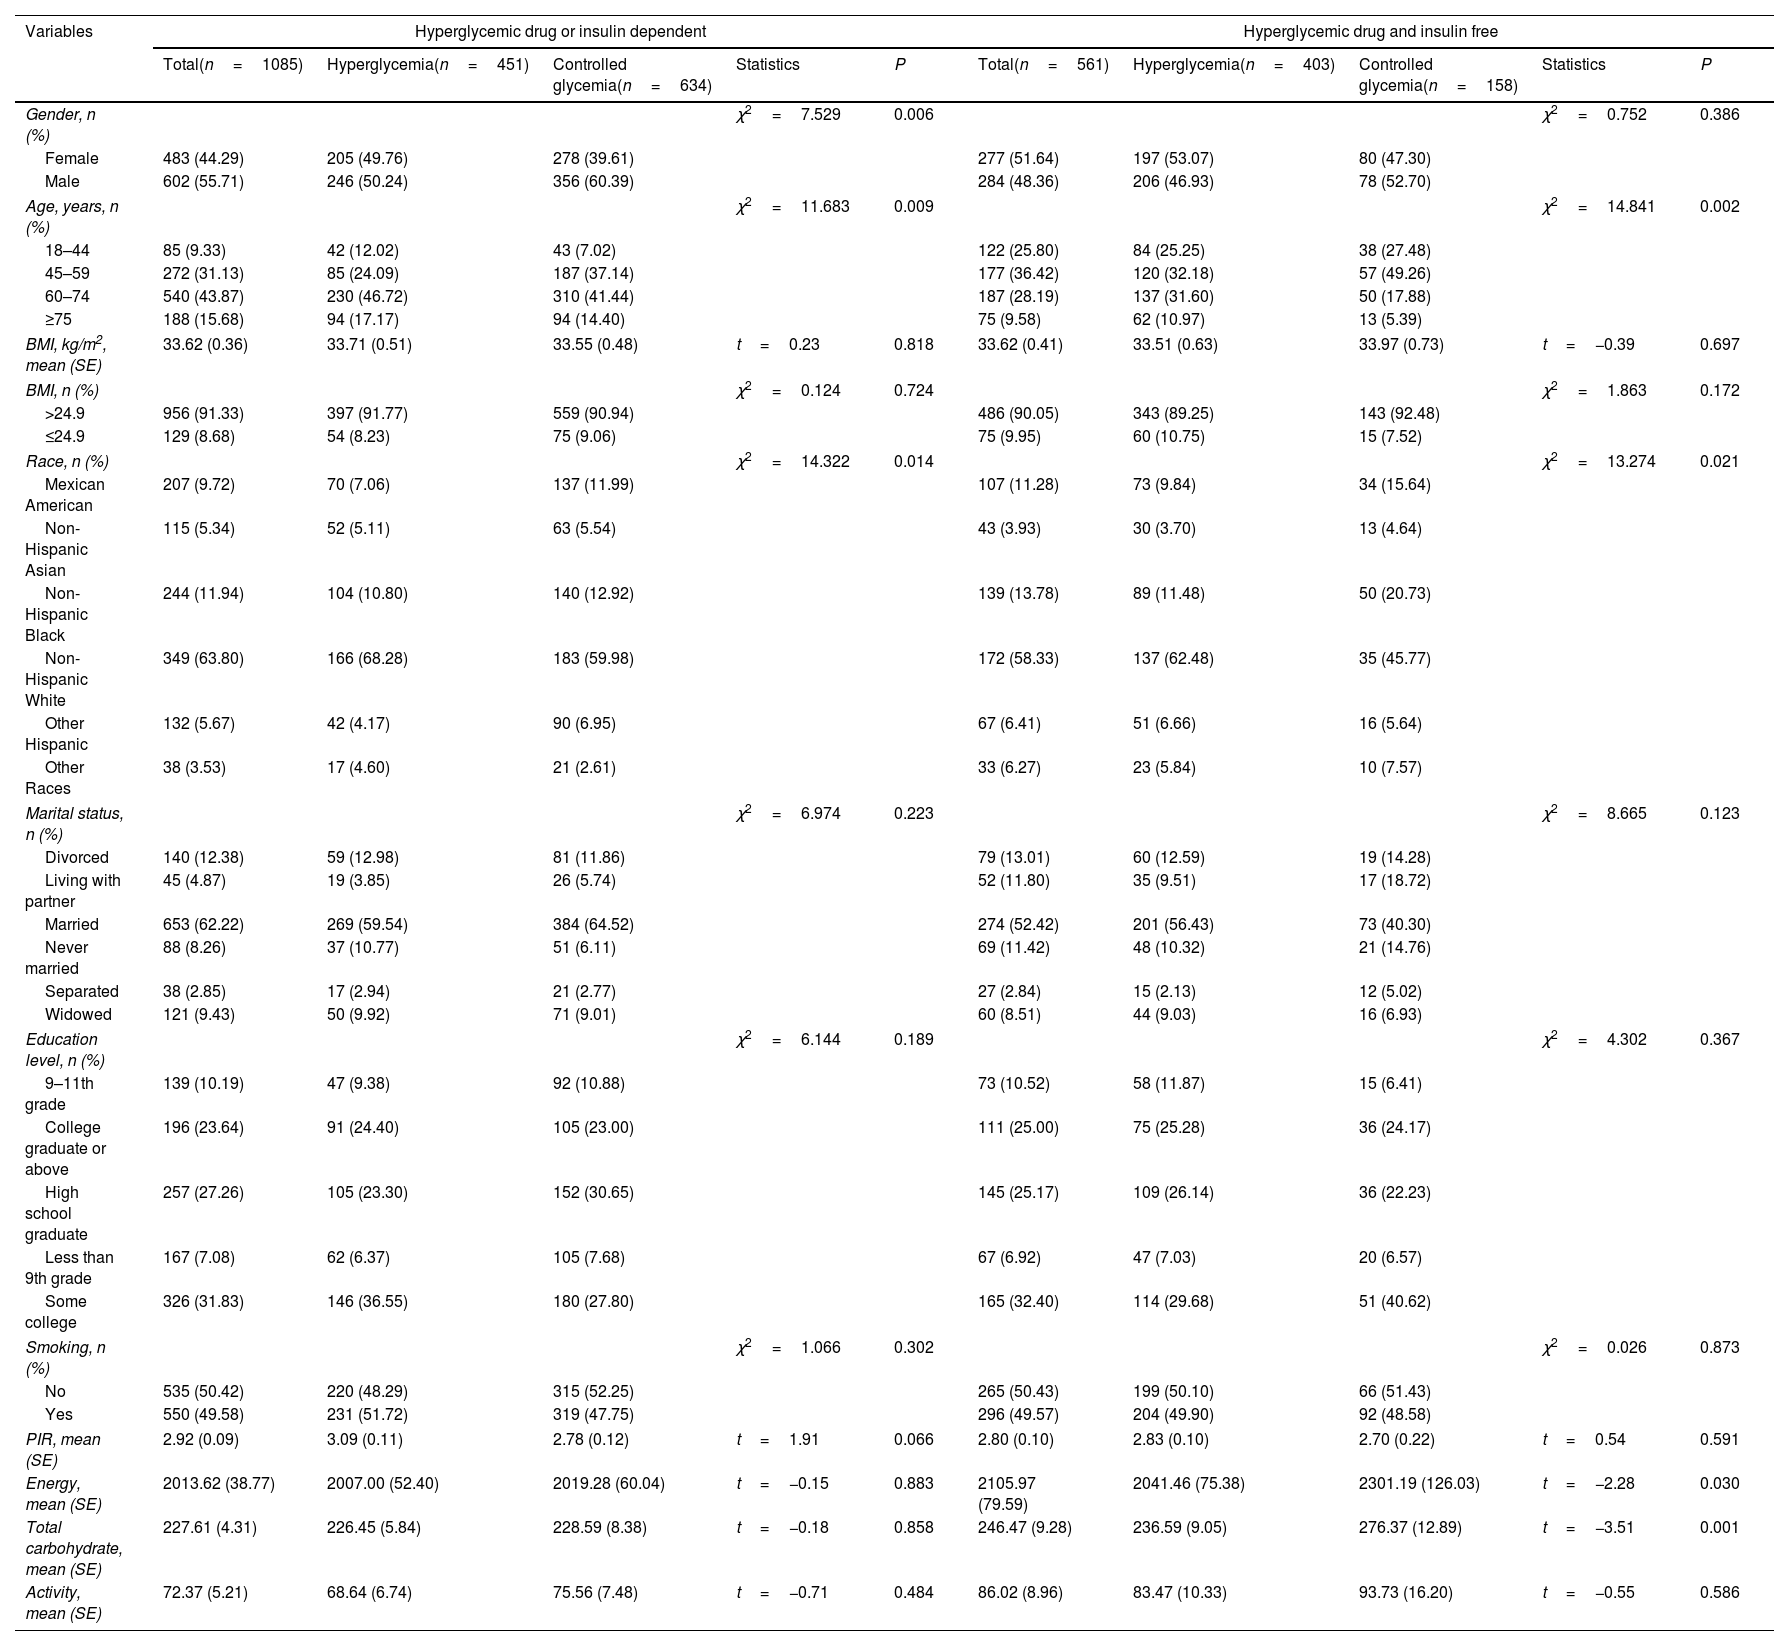
The demographic characteristics of the overall population were summarized in Table 1. Of the included 1646 participants, 1085 were hyperglycemic drug or insulin dependent, and 561 were hyperglycemic drug and insulin free. Among patients who received hyperglycemic drugs or insulin treatment, the age, and race were statistical differences between the hyperglycemia and controlled glycemia groups (all P<0.05). Among patients who did not receive hyperglycemic drugs or insulin treatment, the gender, age, race, energy, and total carbohydrate were statistical differences between the two groups (all P<0.05).
Characteristics of the study participants.
| Variables | Hyperglycemic drug or insulin dependent | Hyperglycemic drug and insulin free | ||||||||
|---|---|---|---|---|---|---|---|---|---|---|
| Total(n=1085) | Hyperglycemia(n=451) | Controlled glycemia(n=634) | Statistics | P | Total(n=561) | Hyperglycemia(n=403) | Controlled glycemia(n=158) | Statistics | P | |
| Gender, n (%) | χ2=7.529 | 0.006 | χ2=0.752 | 0.386 | ||||||
| Female | 483 (44.29) | 205 (49.76) | 278 (39.61) | 277 (51.64) | 197 (53.07) | 80 (47.30) | ||||
| Male | 602 (55.71) | 246 (50.24) | 356 (60.39) | 284 (48.36) | 206 (46.93) | 78 (52.70) | ||||
| Age, years, n (%) | χ2=11.683 | 0.009 | χ2=14.841 | 0.002 | ||||||
| 18–44 | 85 (9.33) | 42 (12.02) | 43 (7.02) | 122 (25.80) | 84 (25.25) | 38 (27.48) | ||||
| 45–59 | 272 (31.13) | 85 (24.09) | 187 (37.14) | 177 (36.42) | 120 (32.18) | 57 (49.26) | ||||
| 60–74 | 540 (43.87) | 230 (46.72) | 310 (41.44) | 187 (28.19) | 137 (31.60) | 50 (17.88) | ||||
| ≥75 | 188 (15.68) | 94 (17.17) | 94 (14.40) | 75 (9.58) | 62 (10.97) | 13 (5.39) | ||||
| BMI, kg/m2, mean (SE) | 33.62 (0.36) | 33.71 (0.51) | 33.55 (0.48) | t=0.23 | 0.818 | 33.62 (0.41) | 33.51 (0.63) | 33.97 (0.73) | t=−0.39 | 0.697 |
| BMI, n (%) | χ2=0.124 | 0.724 | χ2=1.863 | 0.172 | ||||||
| >24.9 | 956 (91.33) | 397 (91.77) | 559 (90.94) | 486 (90.05) | 343 (89.25) | 143 (92.48) | ||||
| ≤24.9 | 129 (8.68) | 54 (8.23) | 75 (9.06) | 75 (9.95) | 60 (10.75) | 15 (7.52) | ||||
| Race, n (%) | χ2=14.322 | 0.014 | χ2=13.274 | 0.021 | ||||||
| Mexican American | 207 (9.72) | 70 (7.06) | 137 (11.99) | 107 (11.28) | 73 (9.84) | 34 (15.64) | ||||
| Non-Hispanic Asian | 115 (5.34) | 52 (5.11) | 63 (5.54) | 43 (3.93) | 30 (3.70) | 13 (4.64) | ||||
| Non-Hispanic Black | 244 (11.94) | 104 (10.80) | 140 (12.92) | 139 (13.78) | 89 (11.48) | 50 (20.73) | ||||
| Non-Hispanic White | 349 (63.80) | 166 (68.28) | 183 (59.98) | 172 (58.33) | 137 (62.48) | 35 (45.77) | ||||
| Other Hispanic | 132 (5.67) | 42 (4.17) | 90 (6.95) | 67 (6.41) | 51 (6.66) | 16 (5.64) | ||||
| Other Races | 38 (3.53) | 17 (4.60) | 21 (2.61) | 33 (6.27) | 23 (5.84) | 10 (7.57) | ||||
| Marital status, n (%) | χ2=6.974 | 0.223 | χ2=8.665 | 0.123 | ||||||
| Divorced | 140 (12.38) | 59 (12.98) | 81 (11.86) | 79 (13.01) | 60 (12.59) | 19 (14.28) | ||||
| Living with partner | 45 (4.87) | 19 (3.85) | 26 (5.74) | 52 (11.80) | 35 (9.51) | 17 (18.72) | ||||
| Married | 653 (62.22) | 269 (59.54) | 384 (64.52) | 274 (52.42) | 201 (56.43) | 73 (40.30) | ||||
| Never married | 88 (8.26) | 37 (10.77) | 51 (6.11) | 69 (11.42) | 48 (10.32) | 21 (14.76) | ||||
| Separated | 38 (2.85) | 17 (2.94) | 21 (2.77) | 27 (2.84) | 15 (2.13) | 12 (5.02) | ||||
| Widowed | 121 (9.43) | 50 (9.92) | 71 (9.01) | 60 (8.51) | 44 (9.03) | 16 (6.93) | ||||
| Education level, n (%) | χ2=6.144 | 0.189 | χ2=4.302 | 0.367 | ||||||
| 9–11th grade | 139 (10.19) | 47 (9.38) | 92 (10.88) | 73 (10.52) | 58 (11.87) | 15 (6.41) | ||||
| College graduate or above | 196 (23.64) | 91 (24.40) | 105 (23.00) | 111 (25.00) | 75 (25.28) | 36 (24.17) | ||||
| High school graduate | 257 (27.26) | 105 (23.30) | 152 (30.65) | 145 (25.17) | 109 (26.14) | 36 (22.23) | ||||
| Less than 9th grade | 167 (7.08) | 62 (6.37) | 105 (7.68) | 67 (6.92) | 47 (7.03) | 20 (6.57) | ||||
| Some college | 326 (31.83) | 146 (36.55) | 180 (27.80) | 165 (32.40) | 114 (29.68) | 51 (40.62) | ||||
| Smoking, n (%) | χ2=1.066 | 0.302 | χ2=0.026 | 0.873 | ||||||
| No | 535 (50.42) | 220 (48.29) | 315 (52.25) | 265 (50.43) | 199 (50.10) | 66 (51.43) | ||||
| Yes | 550 (49.58) | 231 (51.72) | 319 (47.75) | 296 (49.57) | 204 (49.90) | 92 (48.58) | ||||
| PIR, mean (SE) | 2.92 (0.09) | 3.09 (0.11) | 2.78 (0.12) | t=1.91 | 0.066 | 2.80 (0.10) | 2.83 (0.10) | 2.70 (0.22) | t=0.54 | 0.591 |
| Energy, mean (SE) | 2013.62 (38.77) | 2007.00 (52.40) | 2019.28 (60.04) | t=−0.15 | 0.883 | 2105.97 (79.59) | 2041.46 (75.38) | 2301.19 (126.03) | t=−2.28 | 0.030 |
| Total carbohydrate, mean (SE) | 227.61 (4.31) | 226.45 (5.84) | 228.59 (8.38) | t=−0.18 | 0.858 | 246.47 (9.28) | 236.59 (9.05) | 276.37 (12.89) | t=−3.51 | 0.001 |
| Activity, mean (SE) | 72.37 (5.21) | 68.64 (6.74) | 75.56 (7.48) | t=−0.71 | 0.484 | 86.02 (8.96) | 83.47 (10.33) | 93.73 (16.20) | t=−0.55 | 0.586 |
BMI: body mass index; PIR: poverty income ratio.
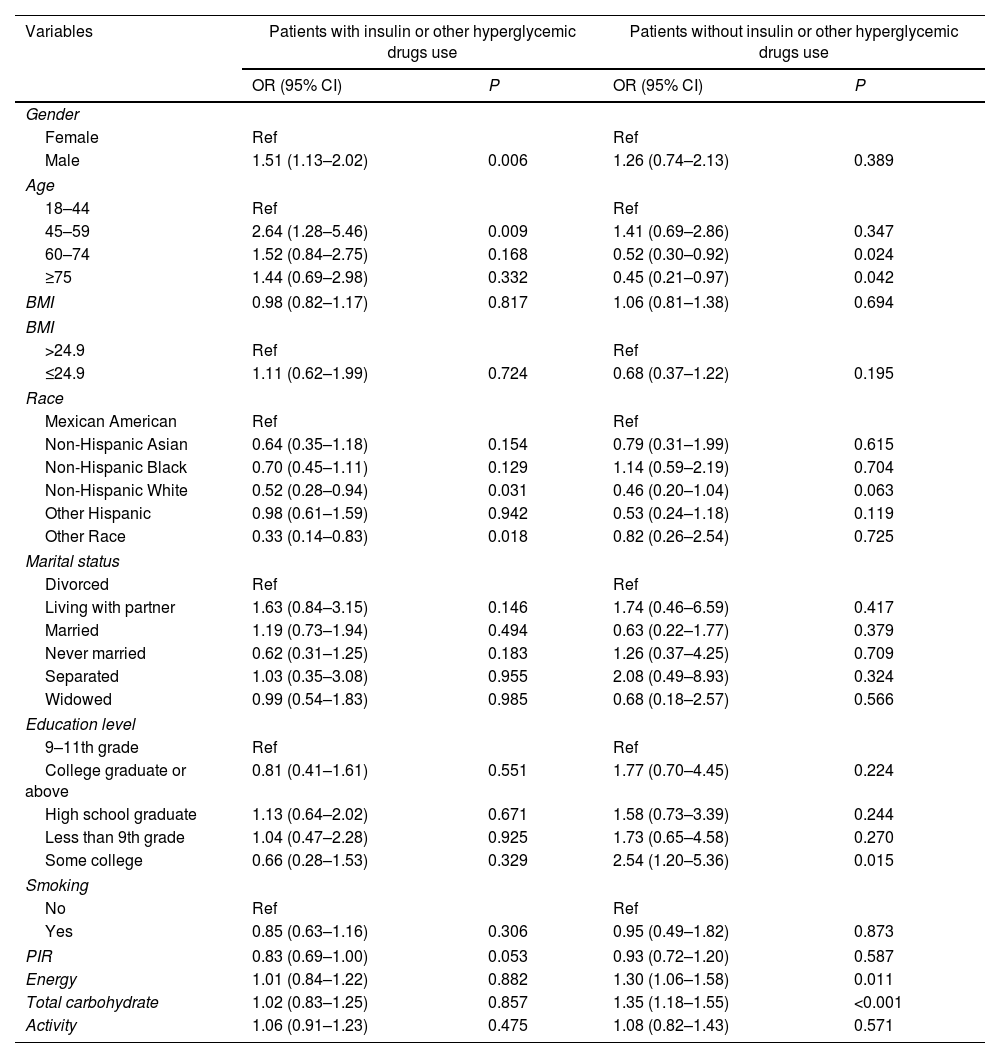
The covariate screening of hyperglycemia in T2DM patients with and without insulin or other hyperglycemic drugs use was shown in Table 2.
The covariate screening of hyperglycemia.
| Variables | Patients with insulin or other hyperglycemic drugs use | Patients without insulin or other hyperglycemic drugs use | ||
|---|---|---|---|---|
| OR (95% CI) | P | OR (95% CI) | P | |
| Gender | ||||
| Female | Ref | Ref | ||
| Male | 1.51 (1.13–2.02) | 0.006 | 1.26 (0.74–2.13) | 0.389 |
| Age | ||||
| 18–44 | Ref | Ref | ||
| 45–59 | 2.64 (1.28–5.46) | 0.009 | 1.41 (0.69–2.86) | 0.347 |
| 60–74 | 1.52 (0.84–2.75) | 0.168 | 0.52 (0.30–0.92) | 0.024 |
| ≥75 | 1.44 (0.69–2.98) | 0.332 | 0.45 (0.21–0.97) | 0.042 |
| BMI | 0.98 (0.82–1.17) | 0.817 | 1.06 (0.81–1.38) | 0.694 |
| BMI | ||||
| >24.9 | Ref | Ref | ||
| ≤24.9 | 1.11 (0.62–1.99) | 0.724 | 0.68 (0.37–1.22) | 0.195 |
| Race | ||||
| Mexican American | Ref | Ref | ||
| Non-Hispanic Asian | 0.64 (0.35–1.18) | 0.154 | 0.79 (0.31–1.99) | 0.615 |
| Non-Hispanic Black | 0.70 (0.45–1.11) | 0.129 | 1.14 (0.59–2.19) | 0.704 |
| Non-Hispanic White | 0.52 (0.28–0.94) | 0.031 | 0.46 (0.20–1.04) | 0.063 |
| Other Hispanic | 0.98 (0.61–1.59) | 0.942 | 0.53 (0.24–1.18) | 0.119 |
| Other Race | 0.33 (0.14–0.83) | 0.018 | 0.82 (0.26–2.54) | 0.725 |
| Marital status | ||||
| Divorced | Ref | Ref | ||
| Living with partner | 1.63 (0.84–3.15) | 0.146 | 1.74 (0.46–6.59) | 0.417 |
| Married | 1.19 (0.73–1.94) | 0.494 | 0.63 (0.22–1.77) | 0.379 |
| Never married | 0.62 (0.31–1.25) | 0.183 | 1.26 (0.37–4.25) | 0.709 |
| Separated | 1.03 (0.35–3.08) | 0.955 | 2.08 (0.49–8.93) | 0.324 |
| Widowed | 0.99 (0.54–1.83) | 0.985 | 0.68 (0.18–2.57) | 0.566 |
| Education level | ||||
| 9–11th grade | Ref | Ref | ||
| College graduate or above | 0.81 (0.41–1.61) | 0.551 | 1.77 (0.70–4.45) | 0.224 |
| High school graduate | 1.13 (0.64–2.02) | 0.671 | 1.58 (0.73–3.39) | 0.244 |
| Less than 9th grade | 1.04 (0.47–2.28) | 0.925 | 1.73 (0.65–4.58) | 0.270 |
| Some college | 0.66 (0.28–1.53) | 0.329 | 2.54 (1.20–5.36) | 0.015 |
| Smoking | ||||
| No | Ref | Ref | ||
| Yes | 0.85 (0.63–1.16) | 0.306 | 0.95 (0.49–1.82) | 0.873 |
| PIR | 0.83 (0.69–1.00) | 0.053 | 0.93 (0.72–1.20) | 0.587 |
| Energy | 1.01 (0.84–1.22) | 0.882 | 1.30 (1.06–1.58) | 0.011 |
| Total carbohydrate | 1.02 (0.83–1.25) | 0.857 | 1.35 (1.18–1.55) | <0.001 |
| Activity | 1.06 (0.91–1.23) | 0.475 | 1.08 (0.82–1.43) | 0.571 |
OR: odds ratio; CI: confidence interval; ref: reference; BMI: body mass index; PIR: poverty income ratio.
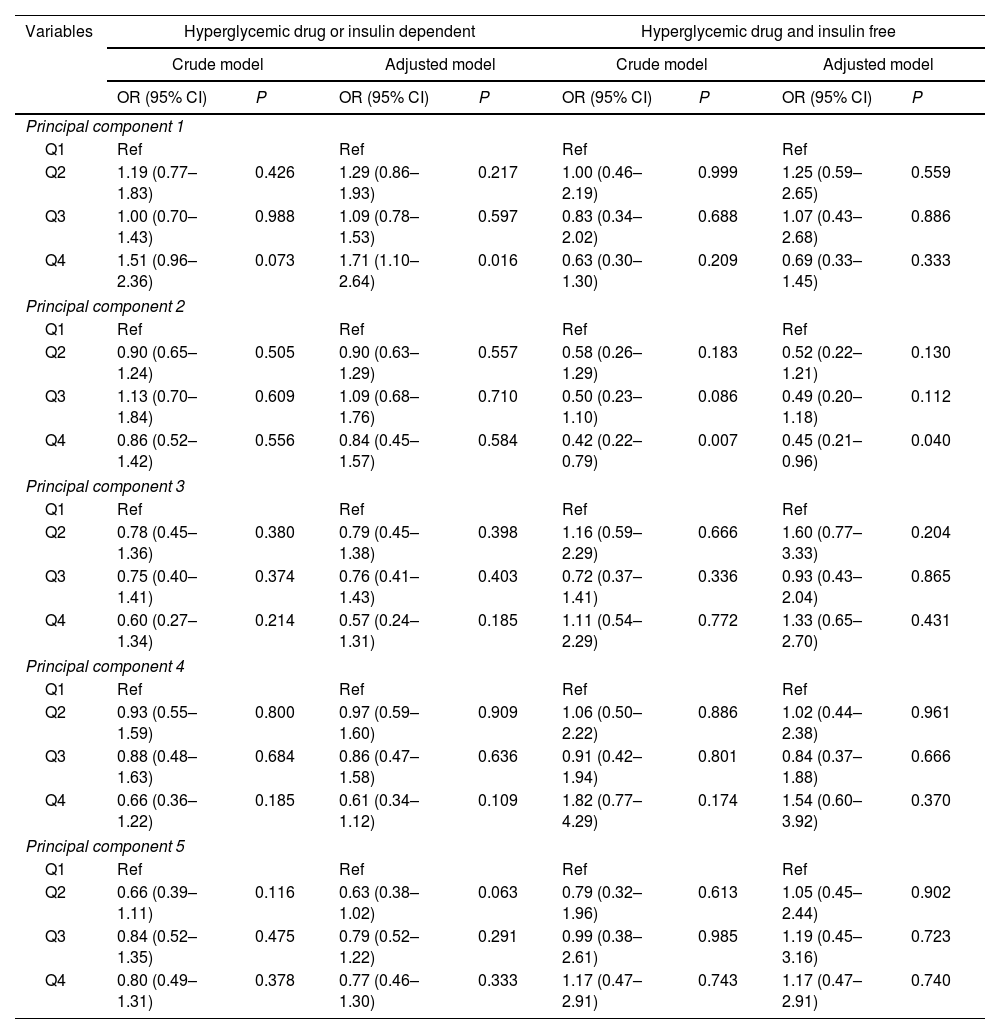
The first quartile (Q1) of each PC was set as the reference group. The association between dietary patterns and hyperglycemia risk was displayed in Table 3. After controlled for covariates, the Q4 of PC1 showed higher odds of hyperglycemia than the reference in patients who underwent hyperglycemic drug or insulin treatments (OR: 1.71, 95% CI: 1.10–2.64, P=0.016). The relationship between the Q2 of PC5 and hyperglycemia was marginal significance (OR: 0.63, 95% CI: 0.38–1.02, P=0.063). For the hyperglycemic drug and insulin free, the OR of the Q4 of PC2 was significantly lower than that of Q1 (OR: 0.45, 95% CI: 0.21–0.96, P=0.040), indicating that higher PC2 level was associated with lower odds of hyperglycemia.
Association between dietary patterns and the risk of hyperglycemia.
| Variables | Hyperglycemic drug or insulin dependent | Hyperglycemic drug and insulin free | ||||||
|---|---|---|---|---|---|---|---|---|
| Crude model | Adjusted model | Crude model | Adjusted model | |||||
| OR (95% CI) | P | OR (95% CI) | P | OR (95% CI) | P | OR (95% CI) | P | |
| Principal component 1 | ||||||||
| Q1 | Ref | Ref | Ref | Ref | ||||
| Q2 | 1.19 (0.77–1.83) | 0.426 | 1.29 (0.86–1.93) | 0.217 | 1.00 (0.46–2.19) | 0.999 | 1.25 (0.59–2.65) | 0.559 |
| Q3 | 1.00 (0.70–1.43) | 0.988 | 1.09 (0.78–1.53) | 0.597 | 0.83 (0.34–2.02) | 0.688 | 1.07 (0.43–2.68) | 0.886 |
| Q4 | 1.51 (0.96–2.36) | 0.073 | 1.71 (1.10–2.64) | 0.016 | 0.63 (0.30–1.30) | 0.209 | 0.69 (0.33–1.45) | 0.333 |
| Principal component 2 | ||||||||
| Q1 | Ref | Ref | Ref | Ref | ||||
| Q2 | 0.90 (0.65–1.24) | 0.505 | 0.90 (0.63–1.29) | 0.557 | 0.58 (0.26–1.29) | 0.183 | 0.52 (0.22–1.21) | 0.130 |
| Q3 | 1.13 (0.70–1.84) | 0.609 | 1.09 (0.68–1.76) | 0.710 | 0.50 (0.23–1.10) | 0.086 | 0.49 (0.20–1.18) | 0.112 |
| Q4 | 0.86 (0.52–1.42) | 0.556 | 0.84 (0.45–1.57) | 0.584 | 0.42 (0.22–0.79) | 0.007 | 0.45 (0.21–0.96) | 0.040 |
| Principal component 3 | ||||||||
| Q1 | Ref | Ref | Ref | Ref | ||||
| Q2 | 0.78 (0.45–1.36) | 0.380 | 0.79 (0.45–1.38) | 0.398 | 1.16 (0.59–2.29) | 0.666 | 1.60 (0.77–3.33) | 0.204 |
| Q3 | 0.75 (0.40–1.41) | 0.374 | 0.76 (0.41–1.43) | 0.403 | 0.72 (0.37–1.41) | 0.336 | 0.93 (0.43–2.04) | 0.865 |
| Q4 | 0.60 (0.27–1.34) | 0.214 | 0.57 (0.24–1.31) | 0.185 | 1.11 (0.54–2.29) | 0.772 | 1.33 (0.65–2.70) | 0.431 |
| Principal component 4 | ||||||||
| Q1 | Ref | Ref | Ref | Ref | ||||
| Q2 | 0.93 (0.55–1.59) | 0.800 | 0.97 (0.59–1.60) | 0.909 | 1.06 (0.50–2.22) | 0.886 | 1.02 (0.44–2.38) | 0.961 |
| Q3 | 0.88 (0.48–1.63) | 0.684 | 0.86 (0.47–1.58) | 0.636 | 0.91 (0.42–1.94) | 0.801 | 0.84 (0.37–1.88) | 0.666 |
| Q4 | 0.66 (0.36–1.22) | 0.185 | 0.61 (0.34–1.12) | 0.109 | 1.82 (0.77–4.29) | 0.174 | 1.54 (0.60–3.92) | 0.370 |
| Principal component 5 | ||||||||
| Q1 | Ref | Ref | Ref | Ref | ||||
| Q2 | 0.66 (0.39–1.11) | 0.116 | 0.63 (0.38–1.02) | 0.063 | 0.79 (0.32–1.96) | 0.613 | 1.05 (0.45–2.44) | 0.902 |
| Q3 | 0.84 (0.52–1.35) | 0.475 | 0.79 (0.52–1.22) | 0.291 | 0.99 (0.38–2.61) | 0.985 | 1.19 (0.45–3.16) | 0.723 |
| Q4 | 0.80 (0.49–1.31) | 0.378 | 0.77 (0.46–1.30) | 0.333 | 1.17 (0.47–2.91) | 0.743 | 1.17 (0.47–2.91) | 0.740 |
OR: odds ratio; CI: confidence interval; ref: reference.
The American Diabetes Association has recommended Medical Nutrition Therapy (MNT), a nutritional diagnostic, therapy, and counseling service provided by a registered dietitian or nutrition professional, for pre-diabetic and diabetic patients to achieve optimal disease management goals.26 The dietary patterning studies have long been digging potential therapeutic diet for diabetic patients.27–29 This research analyzed the cumulative effect of diet patterns on glycemic control, the findings of which may be implemented for diabetes management and prevention. Furthermore, the analytic method may be adopted in future dietary patterning studies to derive a more “tailor-made” dietary pattern for different target populations. The result of this study uncovers three dietary patterns, PC1, PC2 and PC5, that impose a significant impact on glycemic control. The Q4 of PC1 was related to higher odds of hyperglycemia, while the Q2 of PC5 was associated with lower odds of hyperglycemia in patients who underwent hyperglycemic drug or insulin treatments. The Q4 of PC2 was associated with lower odds of hyperglycemia in patients without hyperglycemic drug and insulin treatments. It was suggested that high intake of sweets, red meat, and processed meat might be detrimental to glycemic control in patients with drug-treated T2DM. High in red meat, while low in coffee, sweets, and high-fat dairy consumption may be beneficial to glycemic control. In addition, high consumption of green vegetables, other vegetables, and whole grains, and low intake of potatoes and processed meat may be good for glycemic control in patients without drug-treated T2DM.
Previous researches provide evidence that supports the potential beneficial effect of PC2. Although the association between total vegetable intake and the incidence of T2DM remains controversial, the protective effect of green leafy vegetables on T2DM has been proposed due to the high magnesium content.30 On the other hand, the consumption of green vegetables, other vegetables, and whole grains increases the intake of dietary fibers. In previous review study, high fiber diet and diet high in whole grain have been associated with better management of glycemic control, lipid profile, body weight, and inflammation.31 Moreover, lower consumption of potatoes, a starchy vegetable, in PC2 may lead to a reduction in carbohydrate intake. An earlier study discovered a positive effect of low-carbohydrate and ketogenic diet in T2DM management.32
The PC5 dietary pattern is characterized by low consumption in coffee, sweets, and high-fat dairy consumption, while high in red meat. Sweets, including cakes, cookies, brownies, pies, doughnuts, pastries, chocolate candies, and fudges, are mainly consisted of refined carbohydrates. Thus, sweets intake increases serum glucose level dramatically, and induces hyperglycemia. Noteworthy, although excessive animal product consumption has long been associated with cardiovascular disease and T2DM, the intake of red meat is not related to the risk of T2DM.33 One possible explanation is that low red meat consumption reduces proteins and fat intake, which leaves more daily calories to be occupied by carbohydrate intake. The protective effect of dairy products has been observed in low-fat dairies, which may be attributed to the vitamin D and calcium content.34 Coffee consumption has also been proposed to have a preventative effect on T2DM by increasing insulin sensitivity and involving in glucose metabolism.35,36 Yet, PC5 of this study revealed a decreased risk of T2DM when consuming little high-fat dairies and coffee along with sweets and liquor. The disparities reflect the difference between dietary patterning study and single food component study, implying a potential synergic effect of distinct food groups. Moreover, the discrepancies may also uncover the actual consumption habits or the influence of food culture.
Previous T2DM dietary studies focus on specific nutrients, such as carbohydrates, protein, and vitamins, which ignore the intercorrelation and synergic effect of different food.5,6,8,10 Moreover, previous T2DM dietary patterning studies on T2DM that considered food interaction addressed limited food groups, such as cereal; dairy products; meat, fish, eggs; fat/oil, fruit and vegetables, sugar-sweetened beverages, and the definition of food groups was too general to reveal the various features of food.23 In contrast, this dietary patterning study examined 27 food groups with the consideration of diabetes-related complications and comorbidities, which has not been performed in studies before. The holistic thinking combined with more multifaced and individualized examination is the greatest strength of this study.
The analytic method is another strength of the current study. In nutrition epidemiology study, common factor analysis (FA) and principal component analysis (PCA) are widely used statistical approaches to extract empirical dietary patterns.37 Comparing to FA, PCA is conceptually simpler and relatively empirical to reduce the dimension of a large set of variables,38 and is therefore preferred in recent dietary patterning studies. However, each PC of the PCA is linearly combined, and difficult to interpret the derived dietary patterns.39 SPCA, on the other hand, silences the less significant association to zero association and addresses several limitations of PCA.13 Using the SPCA method, this study is able to identify the food groups in a quantitative and probabilistic manner, which increases the robustness of the results.
Nevertheless, some shortcomings required caution in interpreting our findings. This observational study only uncovers a potential association of the dietary pattern and T2DM, while no causal relationship is established. Data were extracted from the years 2015–2018, updated data need to further validate our findings. In addition, using the current analytic method, the intake amount of each food component of the dietary pattern cannot be quantified. Therefore, future studies are needed to investigate the specific amount of each dietary pattern to establish a more quantified dietary recommendation for T2DM patients.
ConclusionsHigh intake of sweets, red meat, and processed meat might be detrimental to glycemic control in patients with drug-treated T2DM. High in red meat, while low in coffee, sweets, and high-fat dairy consumption may be beneficial to glycemic control. In addition, high consumption of green vegetables, other vegetables, and whole grains, and low intake of potatoes, and processed meat may be good for glycemic control in patients without drug-treated T2DM.
Ethics approval and consent to participateNot applicable.
Consent for publicationNot applicable.
FundingNone declared.
Authors’ contributionsYe Qiang and Yuchao Zhang: conceiving and designing the study; Ye Qiang and Xingchen Lu: collecting the data; Ye Qiang and Xingchen Lu: analyzing and interpreting the data; Ye Qiang: writing the manuscript; Yuchao Zhang and Ye Qiang: providing critical revisions that are important for the intellectual content; Ye Qiang, Xingchen Lu, and Yuchao Zhang: approving the final version of the manuscript.
Conflicts of interestThe authors declare that there is no conflict of interest regarding the publication of this paper.
Data availabilityThe data used to support the findings of this study are available from the corresponding author upon request.
