Determining frailty situation in older adults allows to detect a group of elderly people who although independent, are unstable and at risk of functional loss and dependence.1 So there should be a relationship between the presence of frailty and the worsening in the biomedical and psychosocial levels.
The main objective of this research is to establish the differences between robust, prefrail, frail and dependent institutionalized elderly people in relation to the data offered in the comprehensive geriatric assessment.
The sample was composed by 194 institutionalized seniors from Spain. The median age was 86.5 years. 73.6% were women and 26.4% men.
To assess frailty, Short Physical Performance Battery (SPPB) was used; validated in different populations. It is a reliable tool for detecting frailty and predicting disability.1 It has got four cut-off points: dependent (0–3); frail (4–6); prefrail (7–9); or robust (10–12).
The rest of the variables were evaluated with specific tools, all with good psychometric properties and commonly used.
Among the participants, 91 are dependent (46.91%), 52 are frail (26.80%), 33 are prefrail (17.01%) 18 are robust (9.28%). The average score obtained is 4.17.
Frailty and clinical assessmentAnova shows significant differences between groups (F(3,190)=.998, p=.032) in relation to comorbidity; in the screening score (F(3,188)=1.497, p=.001) and total score (F(3,128)=.092, p=.008) of Mini Nutritional assessment; in risk of falls (F(3,187)=22.237, p=.001); and risk of pressure ulcers (F(3,187)=62.486, p=.001).
Frailty and functional assessmentThe differences between the frailty groups are significant in relation to basic (F(3,190)=111.656, p=.001) and instrumental (F(3,190)=12.261, p=.001) activities of daily living.
Frailty and mental assessmentSignificant differences appear in relation to cognitive function (F(3,189)=24.654, p=.001); anxiety (F(3,175)=4.358, p=.005); depression (F(3,175)=9.719, p=.001); caregiver's exhaustion subscale in neuropsychiatric state (F(3,188)=5.631, p=.001) and apathy (F(3,189)=11.709, p=.001).
Frailty and social assessmentThe Anova shows differences between groups in relation to quality of life (F(3,190)=22.802, p=.001).
As frailty grows and approaches de dependence extreme; malnutrition, comorbidity, risk of fall and ulcers, caregiver's exhaustion, anxiety, depression and apathy increase; while cognitive function and activities of daily living development decrease.
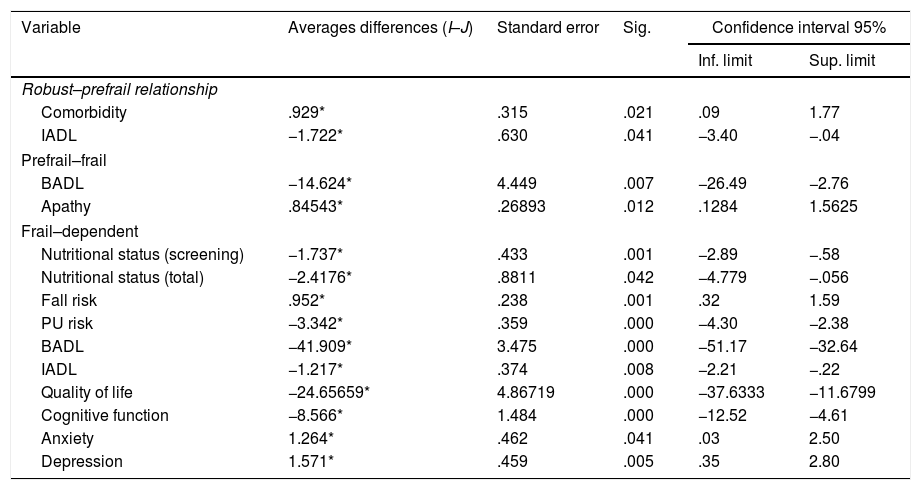
Differences especially relevant are those that occur in robust–prefrail, prefrail–frail and frail–dependent relationships as they are correlative groups in the continuum robustness–prefrailty–frailty–dependence; post hoc analysis shows this differences in Table 1.
Post hoc–Bonferroni.
| Variable | Averages differences (I–J) | Standard error | Sig. | Confidence interval 95% | |
|---|---|---|---|---|---|
| Inf. limit | Sup. limit | ||||
| Robust–prefrail relationship | |||||
| Comorbidity | .929* | .315 | .021 | .09 | 1.77 |
| IADL | −1.722* | .630 | .041 | −3.40 | −.04 |
| Prefrail–frail | |||||
| BADL | −14.624* | 4.449 | .007 | −26.49 | −2.76 |
| Apathy | .84543* | .26893 | .012 | .1284 | 1.5625 |
| Frail–dependent | |||||
| Nutritional status (screening) | −1.737* | .433 | .001 | −2.89 | −.58 |
| Nutritional status (total) | −2.4176* | .8811 | .042 | −4.779 | −.056 |
| Fall risk | .952* | .238 | .001 | .32 | 1.59 |
| PU risk | −3.342* | .359 | .000 | −4.30 | −2.38 |
| BADL | −41.909* | 3.475 | .000 | −51.17 | −32.64 |
| IADL | −1.217* | .374 | .008 | −2.21 | −.22 |
| Quality of life | −24.65659* | 4.86719 | .000 | −37.6333 | −11.6799 |
| Cognitive function | −8.566* | 1.484 | .000 | −12.52 | −4.61 |
| Anxiety | 1.264* | .462 | .041 | .03 | 2.50 |
| Depression | 1.571* | .459 | .005 | .35 | 2.80 |
Differences are significant level 0.05.
IADL: instrumental activities of daily living; BADL: basic activities of daily living; PU: pressure ulcer.
Assessment instruments: Comorbidity – Charlson Index Brief. Nutritional status – Mini Nutritional Assessment. Fall risk – J. H. Downton. PU – Norton Scale. BADL – Barthel Index. IADL – Lawton & Brody Scale. Cognitive function – Mini Mental State Examination. Axiety and depression – Goldber Anxiety and Depression Scale. Neuropsichiatric status – Neuropsychiatric Status NPI-Q. Apathy – Dementhia Apathy Interview and Rating. Quality of life – GENCAT.
Due to the reversibility of frailty; this study provides that a percentage of 43.81% of people living in these centres could reverse it.
Although no literature that performs this type of analysis of the differences between these four groups of fragility has been found, there are studies related to the variables used, as; comorbidity1,2; risk of falls1,3; activities of daily living3,5; quality of life4; cognitive function1,3,5; depression2,3; regard to apathy.6
This studio has found that there is a continuum robustness–prefrailty–frailty–dependency as there are significant differences between groups. However, due to the non-probabilistic and convenience sample, results may not be generalized.
Knowing the differences between groups allows an early and more specific diagnosis, these differences will also determine the type of treatments that each group should receive since the associated deficits will not be the same or have the same severity.
The differences between robust and prefrail allow to differentiate this state of prefrailty in an early way; between prefrail make possible an earlier detection and better prognosis and reversion; and, between frail-dependent allow to prevent a state of dependence or disability from being reached.
In relation to this, interventions aimed at physical activity, nutrition, activities of daily living, analysis and adaptation of activities and environment, medication review, cognitive stimulation, fall and pressure ulcers prevention; are proposed; with an interdisciplinary approach focused on preventing or reversing frailty, dependence and other adverse effects, including death.
Grupo Norte, group of companies that provided four of its centres for data collection implying for this purpose their own professionals.


