Introduction
References are made in the literature on the variation in referral rates between health care levels depending on the geographical area (rural areas compared to urban), as well as the influence of the sociodemographic characteristics of the population, their state of health, the primary care doctors, and the level of specialised services available.1-4
This last variable appears as one of the most relevant explanatory factors.5
The objective of the study is to determine, in our area, and in the context of providing a public health service, what factors associated to the care population and the organisation of the providers determine the referral rates between primary care (PC) and specialised care (SC). Identifying this is important in tailoring the provision of services to the real needs, instead of basing it on the application of standard ratios.
Pacients and Methods
Design
Population-based cross-sectional ecological study (Community of Madrid) in which the unit of analysis is the basic health zone (BHZ).
Variables and Sources of Information
The dependent variable is the population referral rate (PRR). This is obtained by dividing the total referrals of the BHZ during the year 2001 by the population of the BHZ in the same year.
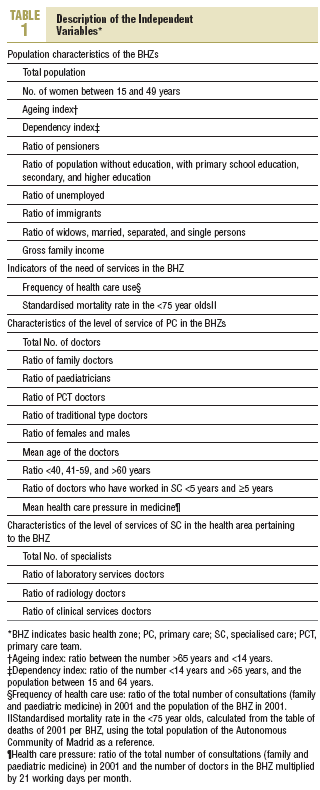
The independent variables are the population of the zone and its characteristics, the measures associated to the need of services, the characteristics of the provision and the PC organisation and the SC provision (Table 1).
The sources of information used were the population census and the data base individual health cards of the year 2001, the Mortality tables in the Register of Deaths, the summary of family gross disposable income in the year 2000 from the Autonomous Community of Madrid Institute of Statistics, and the 2001 INSALUD Hospital Register data base.
The data of activity and referrals have been obtained from the PC Managers 2001 Activity Information System of each health area.
Analysis and Statistical Tests
The distribution of the quantitative variables has been analysed to determine its normality, and the measures of central tendency and dispersion were calculated. The nominal variables were used as a ratio of the total in the BHZ.
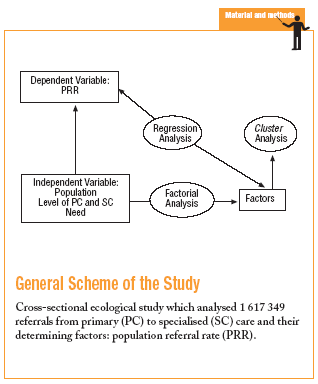
A principal components factor analysis has been performed to control the multicollinearity and obtain orthogonal variables.
The extracted components have been used as independent variables. The number of components has been determined using the Scree test: these were rotated by the Varimax procedure and were included in a least squares regression analysis.
The degree of spatial autocorrelation using the Geary index on the basis of the calculation of a contiguity matrix with weight of 1 for all the zones which had contact with the zone in the study. The spatial correlation of the residuals has been calculated by re-applying the Geary I.
The principal components significantly associated with the PRR have been subjected to a hierarchical grouping analysis.
The graphical representations of the functional BHZs were produced by the Cartography of the Institutional Geographic Information System (SIGI).
The statistical analyses were performed using the SPSS (v.11) statistics package and with R software.
Results
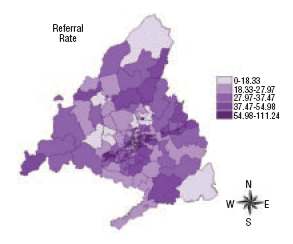
In the year 2001, there were 1 617 349 referrals in the Autonomous Community of Madrid. The mean PRR was 31.94±0.87 per 100 inhabitants. Its distribution is skewed to the right with some extreme values. The geographical distribution of the PRR values (Figure 1) shows a non-random pattern. There is spatial autocorrelation (0.84; P<.0001), with a tendency for similar values to group in certain zones.
Fig. 1. Geographic distribution of the population referral rates in the Autonomous Community of Madrid.
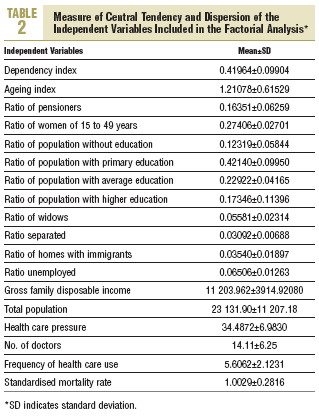
The measures of central tendency and dispersion of the independent variables included in the factorial analysis are shown in Table 2. The Bartlett test (P<.0001) confirms the presence of a high degree of correlation between variables. In the analysis, there are 5 components which explain 81.87% of the variation. The commonality of some variables exceeded 95%.
The first component is positively associated with variables related to ageing (state of widowhood, independence, and ageing index) and negatively associated with the female population between 15 to 49 years. The second component, the socioeconomic status, maintains a positive relationship with the levels of secondary and higher education, and with high income level, and negative with no and primary education and unemployment index.
The third component, the total population, is positively associated with the total population of the area and the number of doctors. The fourth component, the need of services, is positively related with the standardised mortality rate and the care frequency. Lastly, the fifth component, which we have called social mobility, is positively associated with the ratio of homes with immigrants and the level of marriage separations.
Only 3 of the components achieved statistical significance in the regression analysis (R2=0.18). The functional relationship is positive with the degree of need (B=3.58) (95% confidence intervale [CI], 2.01-5.1). The socioeconomic status component had a negative coefficient of 3.26 (95% CI, 4.8 to 1.7) and the relationship with the social mobility component
B=2.92) is also negative (95% CI, 4.5 to 1.4).
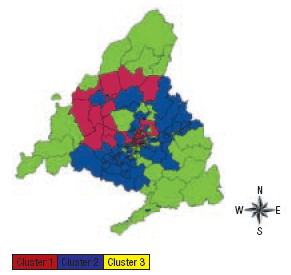
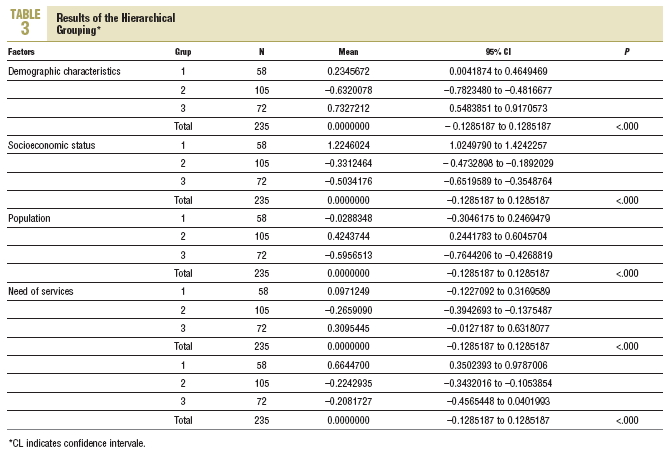
In the hierarchical grouping analysis 3 different groups have been detected (Figure 2 and Table 3) and all the factors in the analysis of variance reached statistical significance (P<.0001).
Fig. 2. Geographic distribution of the groups in the Autonomous Community of Madrid.
Discussion
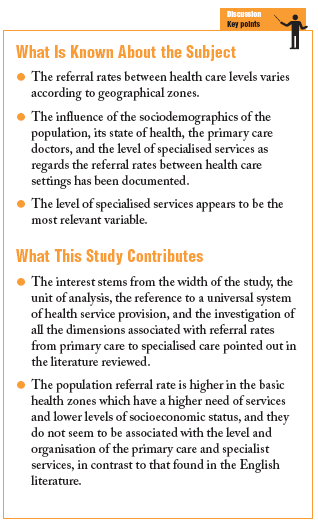
The PRR is greater in the BHZs which have a greater need of services and lower socioeconomic and mobility levels, and do not appear to be associated with the provision and the organisation of the PC or SC services. This is in contrast to that found in the English literature, where the referral rate is higher when there is a higher provision of specialised services.
The interesting aspect of our study lies in its range (more than 5 million users), the unit of analysis (BHZ) and the fact that it refers to a universal system of health service provision, as well as having investigated all the dimensions associated with referrals from PC to SC pointed out in the literature reviewed.
The results appear consistent with that observed in daily practice. The people who use the health services more often are normally chronic patients, with multiple diseases and medication, which require monitoring by one or more specialists. In the BHZs with higher income levels, the PRR is lower, probably associated with higher levels of health and use of private SC providers. The lower level of use by the separated and divorced group is noted, and in the case of immigrants, it could be related to the barriers associated with accessibility by this sector.
The non-random geographic pattern of PRR is explained on placing the BHZs of the Madrid Community into 3 groups: Group 1, population with medium values of ageing component, high income level and a low need component; group 2, population with low values of ageing, socioeconomic level and need; and group 3, population with high values of ageing and need components and low socioeconomic level. The PRR of groups 2 and 3 are similar and are significantly higher than those in the BHZs of group 1. The population of groups 1 and 2 are probably the majority users of public services.
However, and to conclude, it has to be emphasised that the study is based on an ecological design and its results are subject to ecological fallacy. The group results obtained, in the strict sense, cannot be extrapolated or considered that they are individually applicable. This fact may be due to the absence of a correlation between the PRR and the level of services.
However, our work serves to demonstrate that in the planning of health care provisions, predefined ratios can no longer be applied. The need to use the available resources efficiently requires the planners to take the variables associated with the population characteristics into account, their level of health at the time of quantifying the health service provision and its typology.
Acknowledgements
We thank the managers and those responsible for the information systems in the 11 health areas of Madrid for access to the information in a form suitable for carrying out this study.


