


To determine the prevalence and related factors of diagnosed osteoarthrosis (DO) and undiagnosed osteoarthrosis (UO) in the general Spanish adult population.
SettingCross-sectional study with data from the Spanish National Health Survey 2017.
ParticipantsN=23,089 adults. Three groups of people were defined: DO, UO, and no osteoarthrosis (NO).
Main measurementsSociodemographic information, lifestyle (tobacco, alcohol, physical activity, body mass index) and health factors (intensity of pain, pain drug consumption, mental health, self-perceived health status, pain involvement in daily living) were collected. Descriptive and bivariate analyses were performed, and a multinomial logistic regression model for the factors associated with each group.
ResultsThe prevalence of DO was 22.4% (95%CI=21.8;22.9) and 0.9% (95%CI=0.8;1) of UO. With respect to NO, risk factors for DO and UO included higher pain levels and pain drug consumption. Better self-perceived health status was inversely related with both. More pain involvement in daily living was associated with increased risk of DO, but reduced risk of UO.
ConclusionsThe prevalence of DO and UO was similar to that reported in Europe, but slightly higher than in low/middle-income countries. It was more prevalent in females, older people, people with worse perceived health status and worse mental health. Higher pain levels and pain drug consumption were risk factors for DO and UO. Better self-perceived health status was protective. Pain involvement in daily living was a risk factor for DO, but protective for UO. Different public health strategies should be considered in view of this.
Determinar la prevalencia y factores asociados a la artrosis diagnosticada (DO) y no diagnosticada (UO) en la población general adulta española.
EmplazamientoEstudio transversal con datos de la Encuesta Nacional de Salud en España 2017.
Participantesn=23.089 adultos. Tres grupos definidos: DO, UO y sin artrosis (NO).
Mediciones principalesDatos sociodemográficos, estilo de vida (tabaco, alcohol, actividad física, índice de masa corporal [IMC]) y salud (intensidad del dolor, consumo de analgésicos, salud mental, estado de salud autopercibido, impacto del dolor en la vida diaria). Se realizaron análisis descriptivos, bivariados y un modelo de regresión logística multinomial para los factores asociados a cada grupo.
ResultadosLa prevalencia de DO fue 22,4% (intervalo de confianza [IC] 95%=21,8;22,9) y UO, 0,9% (IC 95%=0,8;1). Los factores de riesgo para DO y UO incluyeron mayores niveles de dolor y consumo de analgésicos. El mejor estado de salud autopercibido se relacionó inversamente con ambos. El mayor impacto del dolor en la vida diaria se asoció con un mayor riesgo de DO, pero menor riesgo de UO.
ConclusionesLa prevalencia de DO y UO fue similar a la europea, pero ligeramente superior a países de bajo/medio nivel de ingresos, más prevalente en mujeres, personas mayores, con peor estado de salud autopercibido y peor salud mental. Los mayores niveles de dolor y consumo de analgésicos fueron factores de riesgo para DO y UO. El mejor estado de salud fue protector. El impacto del dolor en la vida diaria fue un factor de riesgo para DO, pero protector para UO. Se deben considerar diferentes estrategias de salud pública en vista de estos resultados.
Osteoarthrosis (OA) is one of the main causes of chronic pain (CP)1–4 and is estimated to affect over 40 million people across Europe.5 It is characterised by joint pain tending to initially affect knees, hips, and spine. Furthermore, pain can be localised in one or several joints. The pain is usually described as intense and deep, worsened by movement and relieved by rest or analgesic medication.6 However, current treatment guidelines recommend measures such as information and education, weight loss for overweight patients, and physical therapy as the base of conservative treatments.
Some studies have analysed the effect of CP on patient's lives, highlighting the strong correlation between this condition and reduced physical activity.7 Pain affects people with OA8 and leads to the avoidance of certain everyday activities, impacting the quality of life. Likewise, there is a significant relationship between CP and the individual's capacity to work since people suffering CP needed to take sick leave and some of them lost their jobs.9 Although there are limited data specifically about OA and its impact on work productivity,5 it is known that CP is associated with a considerable economic cost in developed countries, and between 1% and 2.5% of gross domestic product10 is related to the cost of work absenteeism, health care costs, and the use of community and social services.
OA is a clinically heterogeneous disease with different definitions and a strong impact on epidemiological data.11 Its diagnosis is primarily based on pain and physical examination. However, over time, other joint symptoms became more constant and less predictable of the disease8 and other ways to detect the earliest phases of cartilage damage of OA, such as radiographic evidence, have been used.11,12 In this context, globally, the age-standardised prevalence of OA is 9.3% (95%CI:8–10.7%),13 with some differences between rural/urban communities.14 In Spain, a study carried out in clinical settings reported a prevalence of 29.35% (95%CI:27.77–30.97) in 2016,15 but specifically in subjects ≥40 years old.
Several factors associated with OA have been described. Some of them are being women, older than 50 years, obesity, trauma/injury to joints, genetics (significant family history), reduced levels of sex hormones, muscle weakness, repetitive use of the join (i.e., jobs requiring heavy labour and bending), and occupation, among others.6,12 To the best of our knowledge, other health factors such as mental status, drug consumption, and other factors related to the lifestyle, including physical activity, have not been assessed in Spain. Considering the potential impact that OA has on an individual's life and the economic cost, we should be aware of the different characteristics of these patients to make better management based on a biopsychosocial approach. Thus, in this study, we first aimed to determine the prevalence of people with diagnosed and undiagnosed OA in the general Spanish adult population and to analyse sociodemographic, lifestyle, and health factors associated with each of these groups.
Materials and methodsDesignSecondary data from the 2017 National Health Survey (SNHS) in Spain were used in this cross-sectional study. The SNHS was carried out on a representative sample of non-institutionalised Spaniards, through a personal interview, conducted by the Spanish National Institute of Statistics (INE) and the Ministry of Health, Social Services and Equality (MSSI) between October/2016 and October/2017. The SNHS uses a probabilistic multistage sampling with stratification to the first-stage units. The data are available and anonymised on the INE and MSSI websites. More details about the methodology are described elsewhere.16
ParticipantsThis study included a total of 23,089 participants>15 years, with Spanish nationality and landline telephone at home (Fig. 1).
Instruments
Participants were asked about sociodemographic variables: gender, age, marital status, and employment status.
The presence of OA (excluding arthritis) was determined with the following questions in the SNHS: “have you suffered from OA in the last 12 months?” and “has it been diagnosed by a doctor?” Diagnosed osteoarthrosis (DO) was defined when participants answered “yes” to both questions, undiagnosed osteoarthrosis (UO) when they answered “yes” to the first question and “no” to the second one, and no osteoarthrosis (NO) when they answered “no” to the first question.
The lifestyle variables collected included alcohol consumption (yes/no), smoking habits (smoker, ex-smoker, non-smoker), and body mass index (BMI), calculated as weight(kg)/size(m)^217 and categorised according to the World Health Organization (WHO) criteria (<18.5kg/m^2, underweight; 18.5–24.9kg/m^2, normal weight; 25.0–29.9kg/m^2, overweight; and ≥30kg/m^2, obesity).18 Physical activity (PA), defined as the level of self-reported engagement across IPAQ (International Physical Activity Questionnaire),19 was measured in metabolic equivalents of task (MET) and classified into three levels: low, moderate, and vigorous. This questionnaire, however, was administered only to people<70 years.
Health status variables included the pain level suffered in the previous four weeks (none, very mild, mild, moderate, severe, and extreme). Information collected on pain drug consumption in the previous two weeks was classified as yes/no. The mental health status was measured through the 12 items version of the Goldberg Health Questionnaire (GHQ-12), originally designed for the diagnosis of psychiatric disorders and validated in Spanish population.20 The scores obtained ranged from 0 (better mental health) to 12 (worse mental health). Scores≥3 indicated the presence of mental illness.21 Self-perceived health status was the perception that the subjects had about their general health status in the last year (very good, good, fair, bad, and very bad). Pain involvement in daily living was compiled using a Likert scale with five categories (a lot, enough, moderate, a little, nothing).
Statistical analysisThe prevalence of DO and UO was estimated with 95% confidence intervals (CI). A descriptive analysis of the characteristics of the groups was performed using mean and standard deviation (SD) for quantitative variables, and frequencies and percentages for qualitative variables. The Chi-square, Kruskal–Wallis, and Mann–Whitney tests were used to analyse the differences among groups.
A multinomial logistic regression model was used. The groups of OA (DO, UO, NO) were defined as the dependent variable. The following independent variables were considered in the model: sociodemographic factors (gender, age, marital status, and employment status), lifestyle factors (alcohol consumption, smoking habits, IPAQ and BMI) and health factors (pain level, pain drug consumption, mental health, self-perceived health status, pain involvement in daily living). A stepwise procedure was used to select the final set of covariates in the model, according to clinical relevance and statistical criteria (Wald test).
Statistical analyses were performed using SPSSv24 statistical software for Windows (SPSS Inc., Chicago, USA).
ResultsPrevalence of diagnosed and undiagnosed osteoarthrosis: The sample included 23,089 subjects≥15 years, 54.1% women. A total of 5161 (22.4%; 95%CI=21.8;22.9) subjects were diagnosed with OA (DO), and 0.9% (95%CI=0.8;1) were undiagnosed (UO). Moreover, up to 76.7% did not have OA (NO).
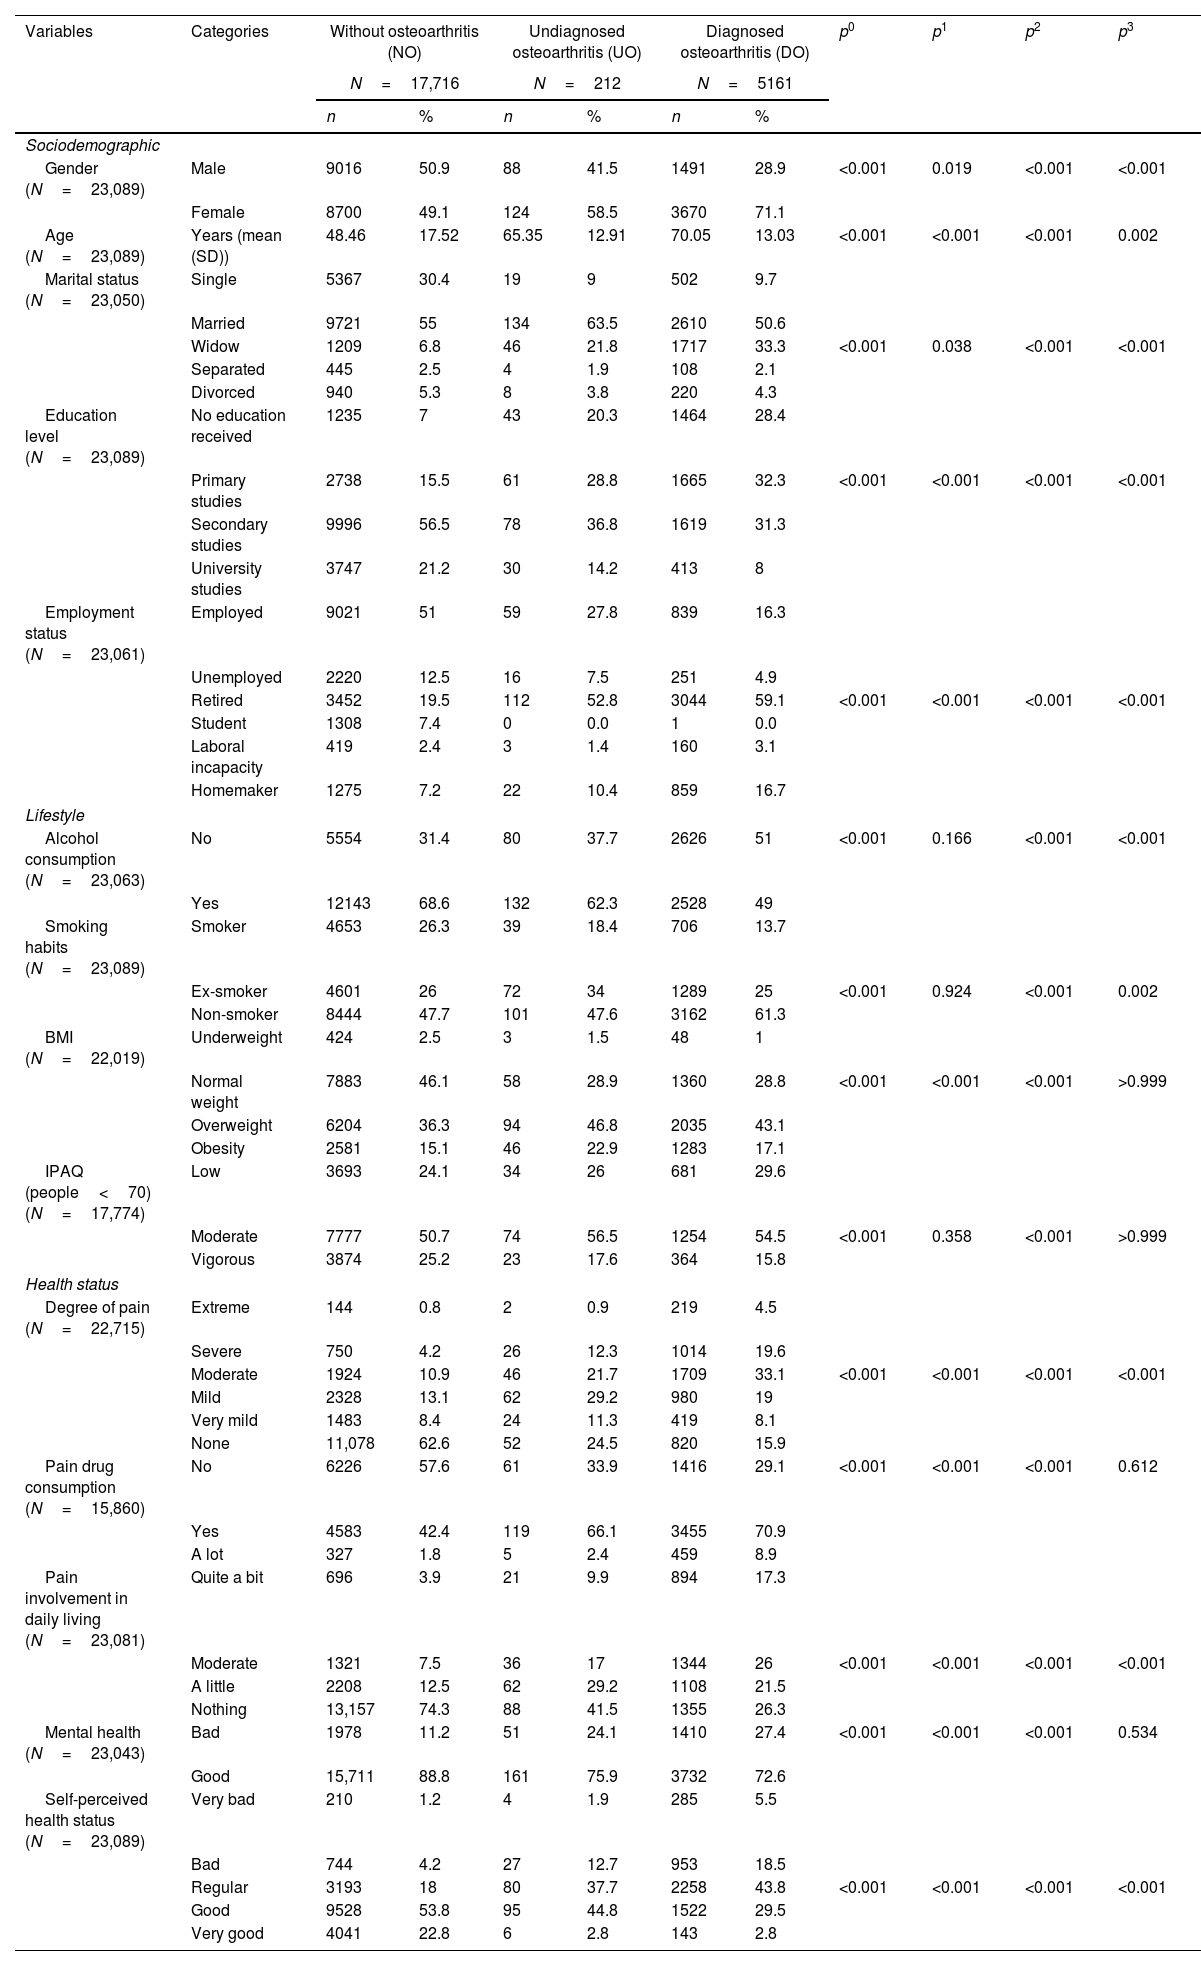
Characteristics and comparison of the three groups of osteoarthrosis. Data detect a higher percentage of women with DO (71.1%) vs. UO (58.5%) and NO (49.1%). Moreover, people with DO were older on average (70.05 vs. 65.35 in UO and 48.46 in NO). It is noteworthy that widow(er)s was more frequent in DO, and singles in NO. In addition, lower educational levels were related to DO (60.7% no education or primary studies) and UO (49.1%), vs. 22.5% in NO. As expected, higher percentages of retired people had DO or UO, compared with NO (Table 1).
Characteristics and comparison of the three groups studied of osteoarthrosis diagnosis.
| Variables | Categories | Without osteoarthritis (NO) | Undiagnosed osteoarthritis (UO) | Diagnosed osteoarthritis (DO) | p0 | p1 | p2 | p3 | |||
|---|---|---|---|---|---|---|---|---|---|---|---|
| N=17,716 | N=212 | N=5161 | |||||||||
| n | % | n | % | n | % | ||||||
| Sociodemographic | |||||||||||
| Gender (N=23,089) | Male | 9016 | 50.9 | 88 | 41.5 | 1491 | 28.9 | <0.001 | 0.019 | <0.001 | <0.001 |
| Female | 8700 | 49.1 | 124 | 58.5 | 3670 | 71.1 | |||||
| Age (N=23,089) | Years (mean (SD)) | 48.46 | 17.52 | 65.35 | 12.91 | 70.05 | 13.03 | <0.001 | <0.001 | <0.001 | 0.002 |
| Marital status (N=23,050) | Single | 5367 | 30.4 | 19 | 9 | 502 | 9.7 | ||||
| Married | 9721 | 55 | 134 | 63.5 | 2610 | 50.6 | |||||
| Widow | 1209 | 6.8 | 46 | 21.8 | 1717 | 33.3 | <0.001 | 0.038 | <0.001 | <0.001 | |
| Separated | 445 | 2.5 | 4 | 1.9 | 108 | 2.1 | |||||
| Divorced | 940 | 5.3 | 8 | 3.8 | 220 | 4.3 | |||||
| Education level (N=23,089) | No education received | 1235 | 7 | 43 | 20.3 | 1464 | 28.4 | ||||
| Primary studies | 2738 | 15.5 | 61 | 28.8 | 1665 | 32.3 | <0.001 | <0.001 | <0.001 | <0.001 | |
| Secondary studies | 9996 | 56.5 | 78 | 36.8 | 1619 | 31.3 | |||||
| University studies | 3747 | 21.2 | 30 | 14.2 | 413 | 8 | |||||
| Employment status (N=23,061) | Employed | 9021 | 51 | 59 | 27.8 | 839 | 16.3 | ||||
| Unemployed | 2220 | 12.5 | 16 | 7.5 | 251 | 4.9 | |||||
| Retired | 3452 | 19.5 | 112 | 52.8 | 3044 | 59.1 | <0.001 | <0.001 | <0.001 | <0.001 | |
| Student | 1308 | 7.4 | 0 | 0.0 | 1 | 0.0 | |||||
| Laboral incapacity | 419 | 2.4 | 3 | 1.4 | 160 | 3.1 | |||||
| Homemaker | 1275 | 7.2 | 22 | 10.4 | 859 | 16.7 | |||||
| Lifestyle | |||||||||||
| Alcohol consumption (N=23,063) | No | 5554 | 31.4 | 80 | 37.7 | 2626 | 51 | <0.001 | 0.166 | <0.001 | <0.001 |
| Yes | 12143 | 68.6 | 132 | 62.3 | 2528 | 49 | |||||
| Smoking habits (N=23,089) | Smoker | 4653 | 26.3 | 39 | 18.4 | 706 | 13.7 | ||||
| Ex-smoker | 4601 | 26 | 72 | 34 | 1289 | 25 | <0.001 | 0.924 | <0.001 | 0.002 | |
| Non-smoker | 8444 | 47.7 | 101 | 47.6 | 3162 | 61.3 | |||||
| BMI (N=22,019) | Underweight | 424 | 2.5 | 3 | 1.5 | 48 | 1 | ||||
| Normal weight | 7883 | 46.1 | 58 | 28.9 | 1360 | 28.8 | <0.001 | <0.001 | <0.001 | >0.999 | |
| Overweight | 6204 | 36.3 | 94 | 46.8 | 2035 | 43.1 | |||||
| Obesity | 2581 | 15.1 | 46 | 22.9 | 1283 | 17.1 | |||||
| IPAQ (people<70) (N=17,774) | Low | 3693 | 24.1 | 34 | 26 | 681 | 29.6 | ||||
| Moderate | 7777 | 50.7 | 74 | 56.5 | 1254 | 54.5 | <0.001 | 0.358 | <0.001 | >0.999 | |
| Vigorous | 3874 | 25.2 | 23 | 17.6 | 364 | 15.8 | |||||
| Health status | |||||||||||
| Degree of pain (N=22,715) | Extreme | 144 | 0.8 | 2 | 0.9 | 219 | 4.5 | ||||
| Severe | 750 | 4.2 | 26 | 12.3 | 1014 | 19.6 | |||||
| Moderate | 1924 | 10.9 | 46 | 21.7 | 1709 | 33.1 | <0.001 | <0.001 | <0.001 | <0.001 | |
| Mild | 2328 | 13.1 | 62 | 29.2 | 980 | 19 | |||||
| Very mild | 1483 | 8.4 | 24 | 11.3 | 419 | 8.1 | |||||
| None | 11,078 | 62.6 | 52 | 24.5 | 820 | 15.9 | |||||
| Pain drug consumption (N=15,860) | No | 6226 | 57.6 | 61 | 33.9 | 1416 | 29.1 | <0.001 | <0.001 | <0.001 | 0.612 |
| Yes | 4583 | 42.4 | 119 | 66.1 | 3455 | 70.9 | |||||
| A lot | 327 | 1.8 | 5 | 2.4 | 459 | 8.9 | |||||
| Pain involvement in daily living (N=23,081) | Quite a bit | 696 | 3.9 | 21 | 9.9 | 894 | 17.3 | ||||
| Moderate | 1321 | 7.5 | 36 | 17 | 1344 | 26 | <0.001 | <0.001 | <0.001 | <0.001 | |
| A little | 2208 | 12.5 | 62 | 29.2 | 1108 | 21.5 | |||||
| Nothing | 13,157 | 74.3 | 88 | 41.5 | 1355 | 26.3 | |||||
| Mental health (N=23,043) | Bad | 1978 | 11.2 | 51 | 24.1 | 1410 | 27.4 | <0.001 | <0.001 | <0.001 | 0.534 |
| Good | 15,711 | 88.8 | 161 | 75.9 | 3732 | 72.6 | |||||
| Self-perceived health status (N=23,089) | Very bad | 210 | 1.2 | 4 | 1.9 | 285 | 5.5 | ||||
| Bad | 744 | 4.2 | 27 | 12.7 | 953 | 18.5 | |||||
| Regular | 3193 | 18 | 80 | 37.7 | 2258 | 43.8 | <0.001 | <0.001 | <0.001 | <0.001 | |
| Good | 9528 | 53.8 | 95 | 44.8 | 1522 | 29.5 | |||||
| Very good | 4041 | 22.8 | 6 | 2.8 | 143 | 2.8 | |||||
p0: Differences among the 3 groups; p1: Differences between NO-UO; p2: Differences between NO-DO; p3: Differences between UO-DO.
Comparing the lifestyle, the lowest percentage of alcohol consumption was found in DO (49%), and only 13.7% were smokers, compared to 18.4% in UO and 26.3% in NO. People with UO and DO were more frequently overweighted or obese than people in the NO group. Finally, 17.6% of the subjects<70 years with UO performed vigorous physical activity, and 15.8% with DO, vs. 25.2% of people with NO (Table 1).
Regarding the health status, 24.1% in DO and 13.2% in UO had extreme or severe pain intensity, vs. 5% in NO. Up to 70.9% of people with DO (66.1% in UO) were taking pain drugs, while this percentage decreased to 42.4% in the NO group. People with DO more frequently reported quite a bit or a lot of pain involvement in daily living (26.2%), scored lower in GHQ-12 and reported more frequently bad or very bad self-perceived health status (24%) vs. the other two groups (Table 1).
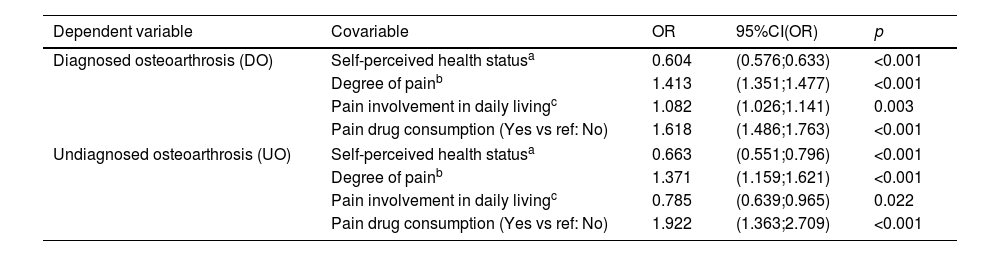
Factors related to diagnosed and undiagnosed osteoarthrosis. The risk factors related to both the DO and UO groups (with respect to NO group) included higher pain level (OR=1.413 in DO and OR=1.371 in UO), and pain drug consumption (OR=1.618 in DO and OR=1.922 in UO). Moreover, better self-perceived health status was inversely related to DO (OR=0.604) and UO (OR=0.663). Special mention should be made of the case of pain involvement in daily living. This factor turned out to be a risk factor for DO (OR=1.082), but protective for UO (OR=0.785) (always with respect to NO) (Table 2).
Factors related to diagnosed and undiagnosed osteoarthrosis.
| Dependent variable | Covariable | OR | 95%CI(OR) | p |
|---|---|---|---|---|
| Diagnosed osteoarthrosis (DO) | Self-perceived health statusa | 0.604 | (0.576;0.633) | <0.001 |
| Degree of painb | 1.413 | (1.351;1.477) | <0.001 | |
| Pain involvement in daily livingc | 1.082 | (1.026;1.141) | 0.003 | |
| Pain drug consumption (Yes vs ref: No) | 1.618 | (1.486;1.763) | <0.001 | |
| Undiagnosed osteoarthrosis (UO) | Self-perceived health statusa | 0.663 | (0.551;0.796) | <0.001 |
| Degree of painb | 1.371 | (1.159;1.621) | <0.001 | |
| Pain involvement in daily livingc | 0.785 | (0.639;0.965) | 0.022 | |
| Pain drug consumption (Yes vs ref: No) | 1.922 | (1.363;2.709) | <0.001 | |
Reference category: no osteoarthrosis (NO).
OR: odds ratio; CI: confidence interval.
This study reveals that there is a high prevalence of OA among the adult Spanish population, being more common in females, older people, with lower levels of education, worse self-perceived health status, and worse mental health. In addition, they practiced less physical activity and were more overweighted or obese than NO.
The prevalence of DO find in the study (22.4%) is a bit lower than the reported by the EPISER2016-study, in which the OA diagnosed was 29.35%.15 However, this study was carried out in a population older than 40 years, which could explain the higher prevalence found. In contrast, our results are slightly higher than those reported in other studies carried out in low- and middle-income countries, with an overall prevalence of 16.4% (95%CI:11.60–21.78%) in South Asia, 15.7% (95%CI:5.31–30.25%) in East Asia and Pacific, and 14.2% (95%CI:7.95–21.89%) in Sub-Saharan Africa.22 However, studies in Europe have reported results like ours.23
In the literature, there are also epidemiological differences according to the OA definition used in the studies. Thus, studies based on radiographic evidence show a higher prevalence estimated than studies based on symptomatic and self-reported definitions, generally performed in younger populations.11 The latter could explain the low prevalence observed in the undiagnosed group, not only because the information was self-reported, but also because the subjects included in this groups were younger, and probably less worried about their health and the diagnosis of the disease.
Additionally, there is evidence that, apart from the level of income of the country or the definition used, there is an increasing trend in the prevalence of OA over time.13,24 The reported trend in the burden of disease due to OA could be due to the progressive ageing of the global population, and prolonged exposure to risk factors such as obesity, occupational factors, genetics, and gender.12,13 In this sense, our study shows a great percentage of patients with OA and UO with obesity and overweight compared with patients without OA. However, this was not a risk factor associated with the presence of DO or UO in our study.
Reporting extreme or severe intensity of pain, consumption of pain relief medication and worse self-perceived health status were the factors related to DO and UO. However, one interesting difference between the groups with/without diagnosed OA should be highlighted. In this line, the study showed that having a higher level of pain involvement in daily living was a risk factor for belonging to the DO group, while this relationship was inverse in the UO group. Increasing evidence indicates that OA often has a profound impact on the individual's health and wellbeing, since it is associated with difficulties in maintaining activities of daily living and a reduction in quality of life.25 Thus, it is unsurprising that people included in the DO group had a higher risk of pain involvement in daily living. Furthermore, this could be a reason why people of the UO group do not have a clinical diagnosis, given that they had a good self-perceived health, and the illness did not interfere in their lives. Additionally, being able to continue carrying out the same activities of daily life could lead to a delay in the diagnosis, and to continue carrying out habits that worsen OA, such as smoking and drinking alcohol. In this regard, our results show that the OU group smokes and drinks alcohol at a higher percentage. Thus, it is important to take these results into account when creating public health strategies.
Finally, some strengths and limitations of the study must be considered. The main strength is that it is a large nationwide study using random sampling, with high response rate and the use of standardised surveys. In addition, the data were obtained from reliable sources. Furthermore, the inclusion of subjects with UO provides a new insight in the prevalence and risk factors of OA. As limitations, the use of secondary data is a potential one, although the data were collected exactly as we needed for the purpose of the study. This is a cross-sectional study, and thus, the relationships observed cannot be considered causal. Additionally, much of the information collected in the study derives from self-reported questions. However, more and more studies consider patients’ perception to be a relevant variable as a measure of results.
ConclusionsIn conclusion, the prevalence of DO was 22.4% and 0.9% for UO. It was similar to that reported in Europe, but slightly higher than in low- and middle-income countries. It was more prevalent in females, older people, in those with worse perceived health status and worse mental health. Higher pain levels and pain drug consumptions were risk factors for DO and UO. However, better self-perceived health status was related to lower risk in both groups. Furthermore, pain involvement in daily living was a risk factor for DO, but protective for UO. It is important to take these results into account when creating public health strategies, as the UO population is not going to carry out a major modification of their lifestyle behaviours, since they are not as greatly impaired in their daily life activities as the DO are. A comprehensive strategy which involves promoting health education among the OA population through the creation of support groups focused on its management is proposed. This approach would entail raising awareness among individuals with OA about the importance of physical and mental well-being, as well as implementing strategies addressing topics such as pain management techniques and non-pharmacological therapies. This might include physiotherapy, acupuncture, cognitive-behavioural therapy, or stress management techniques. We emphasise the importance of promoting a positive self-perception of health status, particularly among women and older people with lower educational levels.
- -
Osteoarthrosis (OA) is a clinically heterogeneous disease with different definitions that has a strong impact on epidemiological data.
- -
OA is one of the main causes of chronic pain (CP) and is estimated to affect over 40 million people across Europe.
- -
Factors such as mental status, drug consumption or physical activity have been scarcely studied in Spain.
- -
The study used data from the Spanish National Health Survey 2017, representing a large sample: N=23,089.
- -
This is the first study to analyse the nationwide prevalence of diagnosed OA (22.4%) and undiagnosed OA (0.9%).
- -
Risk factors include higher pain levels and pain drug consumptions, worse self-perceived health status, and pain involvement in daily living.
- -
The prevalence of undiagnosed OA people is important to consider when creating public health strategies to avoid a great impairment in their daily lives.
1. Conception and design of the manuscript. All authors. 2. Data collection. A.S. 3. Analysis and interpretation of the data. All authors. 4. Drafting, review, approval of the submitted manuscript. All authors.
Ethical considerationsThis study uses secondary data from the INE, which are public and anonymous. According to the Regulation (EU) 2016/679 of the European Parliament and the Council, April 27, 2016, it is not necessary to apply the principles of data protection to anonymous information, even for statistical or research purposes. Its use does not require the approval of an accredited ethics committee. In any case, the usual ethical considerations were considered, and the Spanish National Institute of Statistics (INE) ensured that the participants gave their informed consent before taking part in the survey.
FundingThis research has not received specific support from public sector agencies, commercial sector, or non-profit entities.
Conflict of interestsThe authors declare no competing interests.
