Introduction
Stroke is one of the main causes of mortality, hospitalization, disability, and excess health costs in most developed countries. In reality, its social impact results from its motor and cognitive sequelae and associated comorbidity. Although valid preventive strategies are available, their use in routine clinical practice is inconsistent.1,2
It has now been shown beyond question that type 2 diabetes and metabolic syndrome (MS) increase cardiovascular risk; however, a parallel increase in the risk of stroke is less evident.3 In Spain, this risk has yet to be evaluated in detail on the basis of a careful comparison of different sources of information specifically for diabetes either with or without SM. Aside from the problems with long-term follow-up of a cohort and the establishment of minimum diagnostic criteria for stroke, three main obstacles may also account for the absence of information. First, there is no standard profile for measuring the risk of stroke. Although mathematical models are available, the risk contributed by diabetes varies between different modes of stroke injury (lacunar infarct, atherothrombosis, cardioembolism, hemorrhage), making it difficult to estimate risk under different circumstances.4 In addition, formulas obtained for other populations are not often used because they do not reflect the Mediterranean lifestyle, although they might be used in the absence of other more appropriate sources of information. Second, conjectures regarding classification have led to the appearance of at least 4 definitions of MS in recent years.5-10 Third, confirmation of an episode of stroke, especially if transitory or asymptomatic, is complex in older persons, especially within the setting of primary care.
Diabetes is usually assumed to be a risk factor for stroke, but it is not known whether considering diabetes as part of MS increases the risk or whether the influence of diabetes is independent of MS. In view of these limitations, the aim of this study was to provide a preliminary estimate of overall stroke risk, calculated with the Framingham Stroke Risk Profile, associated with type 2 diabetes in the presence or absence of MS.
A further aim was to compare theoretical risk estimates with the actual incidence of stroke in a cohort followed at primary care centers for 5 years, from 1998 to 2003.
Patients and Methods
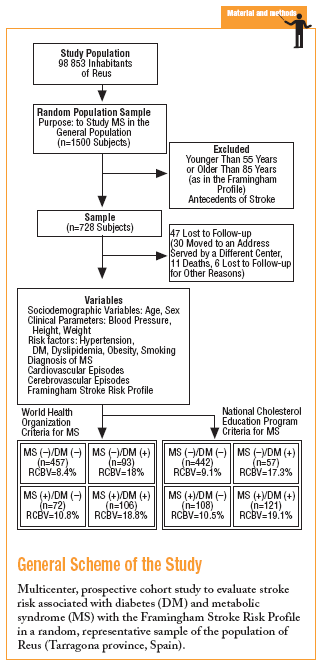
In 1998 a prospective multicenter cohort study was begun in an urban area with a population of close to 100 000, with an age structure similar to that of the population of the region of Catalonia (northeastern Spain) as a whole. A random sample representative of the population over 14 years of age was studied. The aims were to estimate the prevalence of MS, the associated risk of vascular events, and the incidence of vascular events, and to identify the factors with the greatest influence on risk that were amenable to preventive measures. The population sample needed for a theoretical prevalence of MS of 17% with ±2% precision and an alpha risk of .05 was estimated as 1500, assuming a 20% drop-out rate.
The study was approved by our institution's ethics committee, and participants gave their informed consent to take part in the study. All participants were advised that a database would be created and that information from their primary care medical record would be entered about their age, sex and address, basic health status (familial and personal antecedents, toxic habits, height, and weight), and results of laboratory tests in blood (biochemical profile, hemogram, lipid profile, oral glucose tolerance test if one or more risk factors for diabetes were present, hemoglobin A1c, and fasting insulin level) and urine (microalbuminuria and 24-hour urinalysis as needed). The database also recorded cardiovascular risk factors (hypertension, diabetes, dyslipidemia, obesity), relevant electrocardiographic findings (atrial fibrillation, left ventricular hypertrophy, and ischemic heart disease), and an associated record of vascular events and treatments.
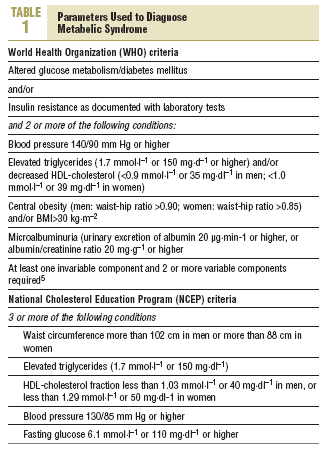
Diabetes was diagnosed on the basis of the recommendations of the World Health Organization (WHO) as fasting venous blood glucemia 7 mmol/L (126 mg/dL) or higher, glucemia 2 hours after oral glucose overload (75 g) of 11.1 mmol/L (200 mg/dL) or higher, with appropriate measures to confirm the diagnosis in patients who were asymptomatic.11 The criteria used in this study to diagnose MS (Table 1) were based on recommendations of WHO5 and the National Cholesterol Education Program (NCEP).6
Heart disease was assumed to be present when there was a clinical history of ischemic heart disease or heart failure, and when the available results of complementary tests (electrocardiogram, exercise test, and scintigraphy) were suggestive. Cerebrovascular disease was assumed if there was a clinical history suggestive of transitory ischemic accident, transitory cerebrovascular accident, or positive imaging tests. All subjects with no record of cerebrovascular complications underwent basic neurological examination intended to rule out silent processes. If there was a reasonable suspicion, the participant was asked to complete a questionnaire (Mini Mental Status Exam) and to undergo an imaging test (computed tomography). Peripheral vasculopathy was diagnosed if there was no peripheral pulse or if vasculopathy was demonstrated with Doppler echography. Left ventricular hypertrophy was diagnosed on the basis of conventional electrocardiographic criteria (Sokolow-Lyon and Cornell), and echocardiographic findings, when available.
For this study we selected adults aged between 55 and 85 years (the range used for risk calculation in the Framingham profile) without antecedents of stroke. To calculate risk we used the scale developed by D'Agostino and colleagues based on data from the Framingham study, and the recent revision by Straus et al.12-14 This system places particular importance on age, sex and mean systolic blood pressure (taking into consideration the use of antihypertensive medication). The initial score was recalibrated on the basis of the presence of any of the following risk factors for stroke: smoking, diabetes, established cardiovascular disease (congestive heart failure, myocardial infarction or other forms of coronary ischemia, intermittent claudication, or peripheral artery ischemia), atrial fibrillation, and left ventricular hypertrophy. The scores for 10-year stroke risk ranged from 1% to 80%. All data for stroke risk were processed with specially-designed software developed for this study.
The statistical analysis was done with conventional software (SPSS version 11.0) running on a personal computer. Descriptive statistics were obtained first; then factorial analysis of the data for each diagnosis (MS/diabetes * Yes/no) was done for 4 groups (neither, either diagnosis separately, or both). Qualitative data are reported here as frequencies followed by percentages in parentheses. Quantitative data are expressed as the arithmetic mean followed by the standard deviation in parentheses. The *2 test was used for inferential bivariate qualitative statistics. Quantitative analyses were done with Student's t test or analysis of variance after normal distribution was verified with the Kolmogorov-Smirnov test. The stroke risk profile was calculated for each group as mean probability with a 95% confidence interval (95% CI).
Results
The sample consisted of 728 subjects (412 women, 56.6%). Mean age was 66.4 (7.3) years, mean body mass index (BMI) was 29.3 (4.9) kg/m2, and mean systolic blood pressure was 14.01 (18.5) mm Hg. Treatment with antihypertensive medication was recorded for 335 persons (46%). According to WHO parameters, 199 individuals (27.3%) fulfilled the criteria for MS, and 178 (24.4%) fulfilled the criteria for type 2 diabetes. The diagnosis of diabetes was based on fasting blood glucose levels in 103 persons (57.9%) and on glucemia 2 hours after oral glucose overload in 75 (42.1%) persons.
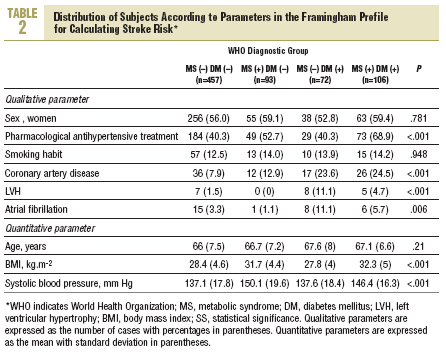
More than half of the sample (457 persons, 62.8%) had neither diabetes nor MS, 93 (12.8%) has MS but not diabetes, 72 (9.9%) had diabetes but not MS, and 106 (14.5%) had both (WHO criteria). According to NCEP criteria, the corresponding figures were 60.7%, 14.8%, 7.8%, and 16.7%. Table 2 shows how the sample was distributed according to WHO criteria for diabetes and MS, as a function of the parameters used to calculate stroke risk. We found no statistically significant differences between the 4 groups in sex, age, or smoking habit, although differences appeared for the rest of the variables. Individuals with MS but not diabetes were similar to persons with diabetes but not MS in age, sex, smoking habit, use of antihypertensive medication, and number of previous cardiovascular events. The proportion of persons with electrocardiographic evidence of atrial fibrillation (11% vs 1%) and left ventricular hypertrophy (8% vs 0%) was larger in the group with diabetes only (without MS). In the group of persons with MS but not diabetes, the proportion of persons with obesity (72% vs 26% with BMI>30), dyslipidemia (55% vs 17%), and hypertension (82% vs 57%) was larger, and mean systolic blood pressure was significantly higher.
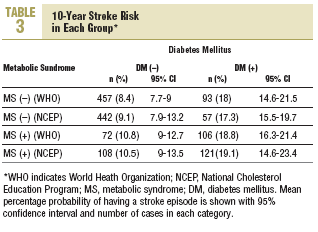
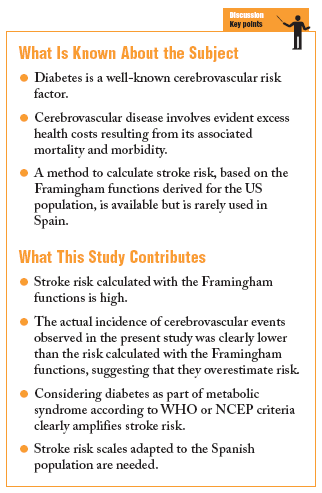
Stroke risk at 10 years for the whole sample was 11.2% (10.2%) (95% CI, 10.4%-11.9%). In patients diagnosed according to NCEP criteria, 10-year stroke risk was 10.2% (9.7%) (95% CI, 9.8%-11.3%). The distribution of risk by group according to each set of criteria is shown in Table 3. Using as the reference value the 8.4% stroke risk in persons with neither diabetes nor MS, a diagnosis of MS was associated with a 28.6% increase in stroke risk. However, a diagnosis of diabetes was associated with a 114.3% increase, and when both diagnoses appeared together, this was associated with a 123.8% increase in mean estimated stroke risk. When risks were estimated for diagnoses based on the NCEP criteria, the figures were very similar.
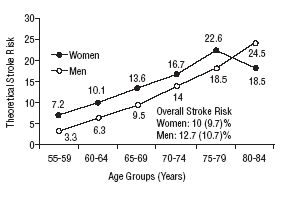
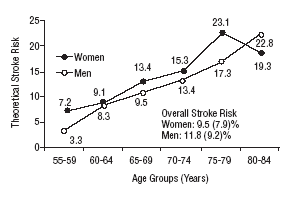
Figure 1 shows the differences in stroke risk for men and women in each age group according to diagnoses based on the WHO criteria. Figure 2 illustrates the risks in both sexes as calculated according to the NCEP criteria for diabetes and MS. The highest probability of stroke in men was found for the 75 to 79-year-old group. In women, the highest risk was found for the 80 to 84 year-old-group; this was the only age group in which the estimated risk for women was higher than the risk for men. The two sets of plots overlapped to a considerable degree.
Mean theoretical 10-year stroke risk estimated with the Framingham functions according to age and sex of the sample (World Health Organization criteria).
Mean theoretical 10-year stroke risk estimated with the Framingham functions according to age and sex of the sample (National Cholesterol Education Program criteria).
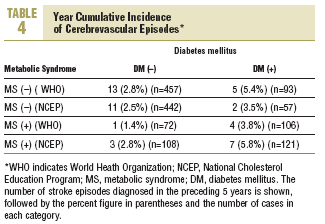
During the study period 47 patients (6.4%) were lost to follow-up because they moved to a new address served by a different health center (30), for reasons that were not stated (6), or because of death. Of the 11 subjects who died, 6 of the deaths were attributed to a cardiovascular problem. Table 4 summarizes the distribution of cerebrovascular episodes recorded in each of the 4 groups (diagnosis based on WHO or NCEP criteria) during the first 5 years of the study. A total of 23 episodes were recorded (3.2%); none was fatal and only 2 produced substantial motor or cognitive sequelae. The distribution of cerebrovascular episodes in each of the four groups as defined by WHO (2.8%, 1.4%, 5.4%, and 3.8%) and the NCEP (2.5%, 2.8%, 3.5% and 5.8%) showed that cumulative incidence was significantly lower than the expected incidence predicted from stroke risk calculated with the Framingham functions, especially in the groups of patients who did not have a diagnosis of diabetes.
Discussion
Type 2 diabetes, hypertension (especially high systolic blood pressure), obesity, dyslipidemia, and microalbuminuria are frequently associated with, and can lead to, increased stroke risk, particularly for ischemic stroke.15,16 These mutual influences of different risk factors make it difficult to discern the risk due to diabetes alone against the overall risk associated with MS. Because the available epidemiological data are scarce, the present study aims to provide a preliminary estimate for the Spanish population.
Notwithstanding the modest size of our sample, the results indicate that the overall estimated stroke risk was higher among individuals with diabetes or MS than in the population with neither of these entities. The profile used here was derived from the Framingham study on the basis of results for the population in the USA and has not yet been validated in Spain or other countries in this area. Although the stroke risk estimates obtained for our population may thus be inaccurate, it is also likely that influential environmental and genetic factors were distributed randomly across the 4 groups compared here. Thus the trends seen in the between-group comparisons are likely to reflect relative differences between groups.
Our research group is specialized in diabetes and MS prevention, so the routine use of the oral glucose tolerance test provided information on the diagnosis of our patients' glucemia status. A recent, thorough review of the available scientific evidence examined the main stroke risk factors in detail, and noted the relevant role of hypertension in raising the relative risk of stroke 3-fold to 5-fold.14 In contrast, the same review suggested that the risk associated with diabetes was lower, but left the issue unresolved as the level of scientific evidence was considered to be lower. In fact, the role of hyperglycemia as a modifiable stroke risk factor has always been controversial: some studies openly support this source of risk, whereas others dismiss the relevance of this factor.17,18
Conflicting results have also been reported in the Spanish literature. For example, a study in the Manresa area (eastern Spain) found an association between stroke and hyperglycemia after 28 years of follow-up.19 Along similar lines, another prospective study in the city of Barcelona found an association between diabetes and a worse prognosis for intracerebral hemorrhage.20,21 In contrast, other research found age- and sex-related differences in the incidence that were independent of glucemia values.22 The results reported here cannot resolve all these contradictions, nor are they intended to defend a glucocentric position. They simply insinuate that the risk of stroke posed by diabetes might be independent of the influence diabetes exerts when considered part of MS, at least when the latter is defined according to WHO or NCEP criteria and risk is evaluated with the Framingham Stroke Risk Profile. In fact, diabetes alone leads to a notable increase in basal stroke risk, whereas the presence of MS together with diabetes leads only to a small additional increase. To explain these values, it should be considered that according to the definition used to develop the Framingham Stroke Risk Profile, diabetes receives a high direct score and raises the level of stroke risk in all patients with this diagnosis. Moreover, the higher incidence of electrocardiographic findings in these patients, although it may be coincidental, also raises the score.
In contrast, the increased stroke risk cannot be attributed to the prolonged duration of diabetes because nearly half of our subjects were diagnosed with the oral glucose tolerance test, i.e., in the initial stages of the disease. Naturally, the prevalence of diabetes we assumed for our study population was similar to that reported in other epidemiological studies that used the oral glucose tolerance test.23 However, although the percentage of individuals with obesity, dyslipidemia and systolic hypertension was lower in this group, mean stroke risk was still higher than in persons with MS in the absence of diabetes. This supports the idea that diabetes is given too much weight in the Framingham Stroke Risk Profile, at least when the profile is used for the Mediterranean population studied here.
The results reported here, taken together, suggest three interpretations: a) the data confirm, once again, the risk of stroke posed by diabetes; b) the data reflect the fact that the Framingham profile overestimates the risk from diabetes; or c) both 1 and 2 together. Our analysis of cerebrovascular accidents during the preceding 5 years of follow-up points toward the second possibility. The cumulative incidence for this period was 3.2%, as compared to the theoretical 10-year incidence of 8.4% estimated with the Framingham functions. Use of the NCEP criteria (based on easily observable clinical features) to diagnose MS rather than the WHO criteria yielded estimates for incidence that were more plausible if diabetes and MS are considered together as a single predictive factor of stroke risk (5.8% for both factors combined). A similar finding was reported in the long-term Manresa study of Pirelli factory employees (7.14% vs 1.2%), although that study included only men.19 These authors recorded 72 episodes during 28 years, whereas in our sample of residents in the Reus area we documented 23 episodes in 5 years. Despite the obvious differences between these 2 populations, both sets of findings support the notion that the Framingham Stroke Risk Profile overestimates risk.
The differences in the incidence of stroke episodes between the 4 diagnostic groups seem negligible considering their low impact, and attempts to explain them would be little more than conjecture. However, they suggest that the NCEP definition of MS provides estimates of risks that come closer to the actual incidence, which is apparently lower than the impact that can be inferred from the Framingham stroke risk scale.
It has often been noted that published studies on the Spanish population are scarce, and this limitation is especially evident for the population of older persons.24 Although it would appear to make little sense to study older patients in terms of prevention, many such patients are not hospitalized or do not undergo CT scans even though the prognosis for life expectancy and cerebrovascular function are known to be worse in this age group.25 Moreover, differences in health care have been found in relation to gender,26,27 ethnic group and other factors.22 It is revealing that the incidence of thromboembolic stroke in men who participated in the Framingham study was 40% higher than in men in Honolulu, whereas episodes of hemorrhagic stroke were almost identical. These epidemiological data emphasize the fact that the Framingham Stroke Risk Profile offers multiple possibilities for overestimating risk depending on the variable in question.
The most controversial issue for primary care is whether diabetes (or MS) should be considered a risk equivalent or simply a risk factor.28 This can only be clarified with prospective studies with a longer follow-up period that appropriately record cerebrovascular episodes in persons with well-documented MS. Multiple preventive strategies are available for stroke (e.g., intensive therapy for hypertension or diabetes, lipid-lowering medication, antiplatelet aggregants, anticoagulants, surgery). In general these
measures are effective, but involve considerable costs and should be adapted to individual cases.29 This task could be facilitated by a scale to measure stroke risk adapted to the characteristics of the Mediterranean population, similar to the scale developed recently to estimate cardiovascular risk.30 For now the Framingham functions can be used with due caution, although the data from the present study suggest that they should not be recommended for systematic use in population screening.
Acknowledgments
Research on glucose intolerance and metabolic syndrome in Reus was awarded the First Prize by the Catalonian Hypertension Society (2002) and the Spanish Hypertension Society (2003), and the VI Annual Prize of the Acadèmia de Ciències Mèdiques de Catalunya i Balears (Terres de l'Ebre). Two authors (JJC and FM) were recipients of graduate scholarships from the Fundació Jordi Gol i Gurina (Atención Primaria, Institut Català de la Salut) for research in this area. We thank the Tarragona-Terres de l'Ebre primary care administration for continued support despite the difficulties surrounding the defense of research activities in the primary health care setting.


