Introducción: La prueba de Evaluación del Desarrollo Infantil (EDI), diseñada y validada en México, clasifica a los niños de acuerdo con su desarrollo en desarrollo normal (verde) y desarrollo anormal (amarillo o rojo). No se conocen los resultados de su aplicación en base poblacional. El objetivo de este trabajo fue evaluar el nivel de desarrollo de niños menores de 5 años en situación de pobreza (beneficiarios del Programa PROSPERA) utilizando la prueba EDI.
Método: La prueba EDI fue aplicada por personal capacitado y con los estándares para la aplicación de la prueba en menores de 5 años que acudieron al control del niño sano en unidades de atención primaria de noviembre de 2013 a mayo de 2014 en un estado del norte de México.
Resultados: Se aplicó la prueba EDI a 5,527 niños de 1-59 meses de edad. El 83.8% (n = 4,632) se encontró con desarrollo normal y el 16.2%, con desarrollo anormal: amarillo con el 11.9% (n = 655) y rojo con el 4.3% (n = 240). La proporción con resultado anormal fue del 9.9% en < 1 año y del 20.8% a los 4 años. Por edad, las áreas más afectadas fueron el lenguaje a los 2 años (9.35%) y el conocimiento a los 4 años (11.1%). Las áreas motor grueso y social tuvieron mayor afección en el área rural. En el sexo masculino, las áreas de motor fino, lenguaje y conocimiento.
Conclusiones: La proporción de niños con resultado anormal es similar a lo reportado en otros estudios de base poblacional. La mayor proporción de afección a mayores edades refuerza la importancia de la intervención temprana. La diferencia en las áreas afectadas entre el medio urbano y rural sugiere la necesidad de una intervención diferenciada.
Background: Evaluación del Desarrollo Infantil or Child Development Evaluation (CDE) test, a screening tool designed and validated in Mexico, classifies child development as normal (green) or abnormal (developmental lag or yellow and risk of delay or red). Population-based results of child development level with this tool are not known. The objective of this work was to evaluate the developmental level of children aged 1-59 months living in poverty (PROSPERA program beneficiaries) through application of the CDE test.
Methods: CDE tests were applied by specifically trained and standardized personnel to children <5 years old who attended primary care facilities for a scheduled appointment for nutrition, growth and development evaluation from November 2013 to May 2014.
Results: There were 5,527 children aged 1-59 months who were evaluated; 83.8% (n=4,632) were classified with normal development (green) and 16.2% (n=895) as abnormal: 11.9% (n=655) as yellow and 4.3% (n=240) as red. The proportion of abnormal results was 9.9% in children <1 year of age compared with 20.8% at 4 years old. The most affected areas according to age were language at 2 years (9.35%) and knowledge at 4 years old (11.1%). Gross motor and social areas were more affected in children from rural areas; fine motor skills, language and knowledge were more affected in males.
Conclusions: The proportion of children with abnormal results is similar to other population-based studies. The highest rate in older children reinforces the need for an early-based intervention. The different pattern of areas affected between urban and rural areas suggests the need for a differentiated intervention.
1. Introduction
Child development is a process of change in which the child learns to master always more complex levels of movement, thinking, feelings and relationships with others, which occurs when the child interacts with people, things, and other stimuli in the biophysical and social environment and learns from them.1 The first 5 years of life are crucial because 90% of the brain develops during this stage and it is the critical period for when the different circuits are found (sensory, language, cognitive, among others), which will be used throughout life.2 The principal risk factors identified for developmental delay are poverty, malnutrition, health problems and non-stimulatory environments.3,4 In Mexico, the population that lives under unfavorable socioeconomic conditions is cared for by the PROSPERA Program of Social Inclusion (formerly “Oportunidades”). This program seeks to improve the living conditions of families living in extreme poverty via economic assistance, but with a component of shared responsibility of assistance in food, education and health.5
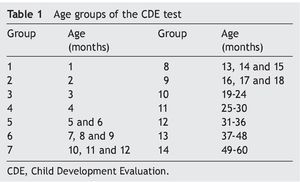
The Child Development Evaluation (CDE, Prueba de Evaluación del Desarrollo Infantil or Prueba, EDI in Spanish) test is a tool for the timely detection of developmental problems for children <5 years of age. This test was designed and validated with financing from the National Commission of Social Protection in Health (CNPSS) through the PROSPERA program.6 The CDE test allows screening for the evaluation of development of children from 1-59 months through organized questions in 14 age groups (Table 1). The test has a sensitivity of 81% and specificity of 61% in the detection of children with developmental disorders.7 Specificity could reach >80% when each developmental domain is considered separately.8 In children 16-59 months of age identified to be at risk for delay the diagnosis is corroborated in 93.2%.9 These results are similar to those reported by other screening tests developed in the U.S.10 and are within the recommended values for these types of tests (sensitivity and specificity >70).11 After the application of the CDE test, children are classified into three groups: green, when no developmental problems are detected; yellow, when there is delay in development; or red, when they have risk of delay. This classification allows for identification of degrees in the magnitude of the developmental problems and to support differentiated interventions.12 When analyzing the evidence available, a panel of experts concluded that the CDE test is the most adequate screening tool in the context of the Mexican population <5 years of age.13
In order to determine the frequency of developmental problems in early stages of life, the objective of this study was to assess the level of development in children <5 years of age who are beneficiaries of the PROSPERA program through population screening using the CDE test.
2. Methods
A population-based cross-sectional study was carried out in rural and urban areas in the state of Coahuila, located in northern Mexico.
2.1. Study population
Children from 1-59 months of age who were beneficiaries of the PROSPERA program were studied. The CDE test was applied from November 2013-May 2014.
2.2. Sample selection
At the time of the implementation of the CDE test, 7,921 children <5 years of age were registered as beneficiaries of the PROSPERA program in the State of Coahuila,14 which was considered as the total universe of the eligible study population. As part of the shared responsibility of the families covered by the PROSPERA program, children <5 years of age must present to the health department for healthy child routine care and monitoring of nutrition and development with the following schedule: if <1 year of age every 2 months and in children 1-4 years of age every 6 months.15 All children who presented for healthy child routine care in first level of care departments during the 6-month study duration were included in the study.
2.3. Justification for the site of the study
The state of Coahuila is in northern Mexico. During 2013, all CDE tests in Coahuila were exclusively applied by seven psychologists who were contracted for this purpose. Coahuila was one of the states where the study of supervision for the correct application of the CDE test in the field was conducted, and each of the psychologists who applied the test in the state obtained a concordance of 95-100% with the supervising expert, which ensured the reliability of the results of the application.16
2.4. Description of the test administered
The CDE test is administered through 26-35 items, with two possible modalities of application: 1) questionnaire to the primary caregivers or 2) observation of behaviors grouped in five axes. These axes consist of the following: a) biological risk factors; b) alert signs; c) areas of development (fine motor, gross motor, language, social and knowledge); d) alarm signs and e) neurological examination. The possible results could be: green or red on neurological examination and alarm signs; green or yellow for biological risk factors and signs of alert and green, yellow, or red in areas of development.
On the total score of the CDE test, a child could obtain 1 of 3 possible results: a) green if there is normal development given that the child has reached the milestones corresponding to the age group and has no signs of alarm or alterations on the neurological examination; b) yellow reflects a lag in development as the child has not reached the developmental milestones corresponding to the chronological age group, but of the former age group (groups of the CDE test) and has no signs of alarm or alterations on neurological examination and c) red, presents a risk of delay because the child has not reached the milestones for his actual age group nor of the former age group, has alterations on neurological examination or signs of alarm17 with possible involvement of one, two or even all three of these axis.
2.5. Standardization and application of the test
The CDE test was applied by seven trained psychologists from the PROSPERA program who were standardized in the process of application, scoring, counseling and management of the children.18 Visits by the psychologist to the health units were programmed according to the population of children <5 years of age registered each of the eight health jurisdictions of the state. Verbal consent for the application of the test from a responsible family member was requested. All children had the CDE applied using the CDE manual of application17 and was scored using the single recording format. The data of identifications and results of the test were captured in the state registry of the tests.
2.6. Study variables
Data were captured for age (in months), gender and type of locality (considering as rural an area with a total population of <2500 inhabitants) for each participant.19 The global result obtained in the CDE test was recorded as well as the score obtained in each one of the axes and areas of development.
2.7. Statistical analysis
Data are presented as absolute (n) and relative (%) frequencies. To evaluate the difference between groups, x2 test or Fisher exact test was used. A two-tailed p value <0.05 was considered statistically significant. Different analyses were performed using SPSS package v.20.0 (IBM).
2.8. Ethical considerations
The study was approved by the Ethics, Biosafety and Research Committees as part of the evaluation of the correct application of the CDE testing in the operational units (project HIM/2013/063). The CDE test is a study of minimal risk because it only includes one questionnaire and physical examination. This test forms part of the actions established as part of healthy child control since 2013.20 Personal identifiable data were not collected and the information from each participant was coded using a unique identification number.
3. Results
Of the total children <5 years of age who were beneficiaries of the PROSPERA program (n = 7921) in the state of Coahuila, the CDE test was administered to 69.8% (n = 5527) who presented for a healthy child control visit during the study. The tests were administered in 73.8% (n = 118) of the total first level units of the state. Of the 5527 children evaluated, 48.3% (n = 2671) were female and 46.3% (n = 2559) were from rural setting. Age distribution was as follows: 1-12 months (10.5%), 13-24 months (16.5%), 25-36 months (21.8%), 37-48 months (26.6%) and 49-60 months (24.6%). No significant differences were found by location type (urban/rural) or gender for each age group (Table 2).
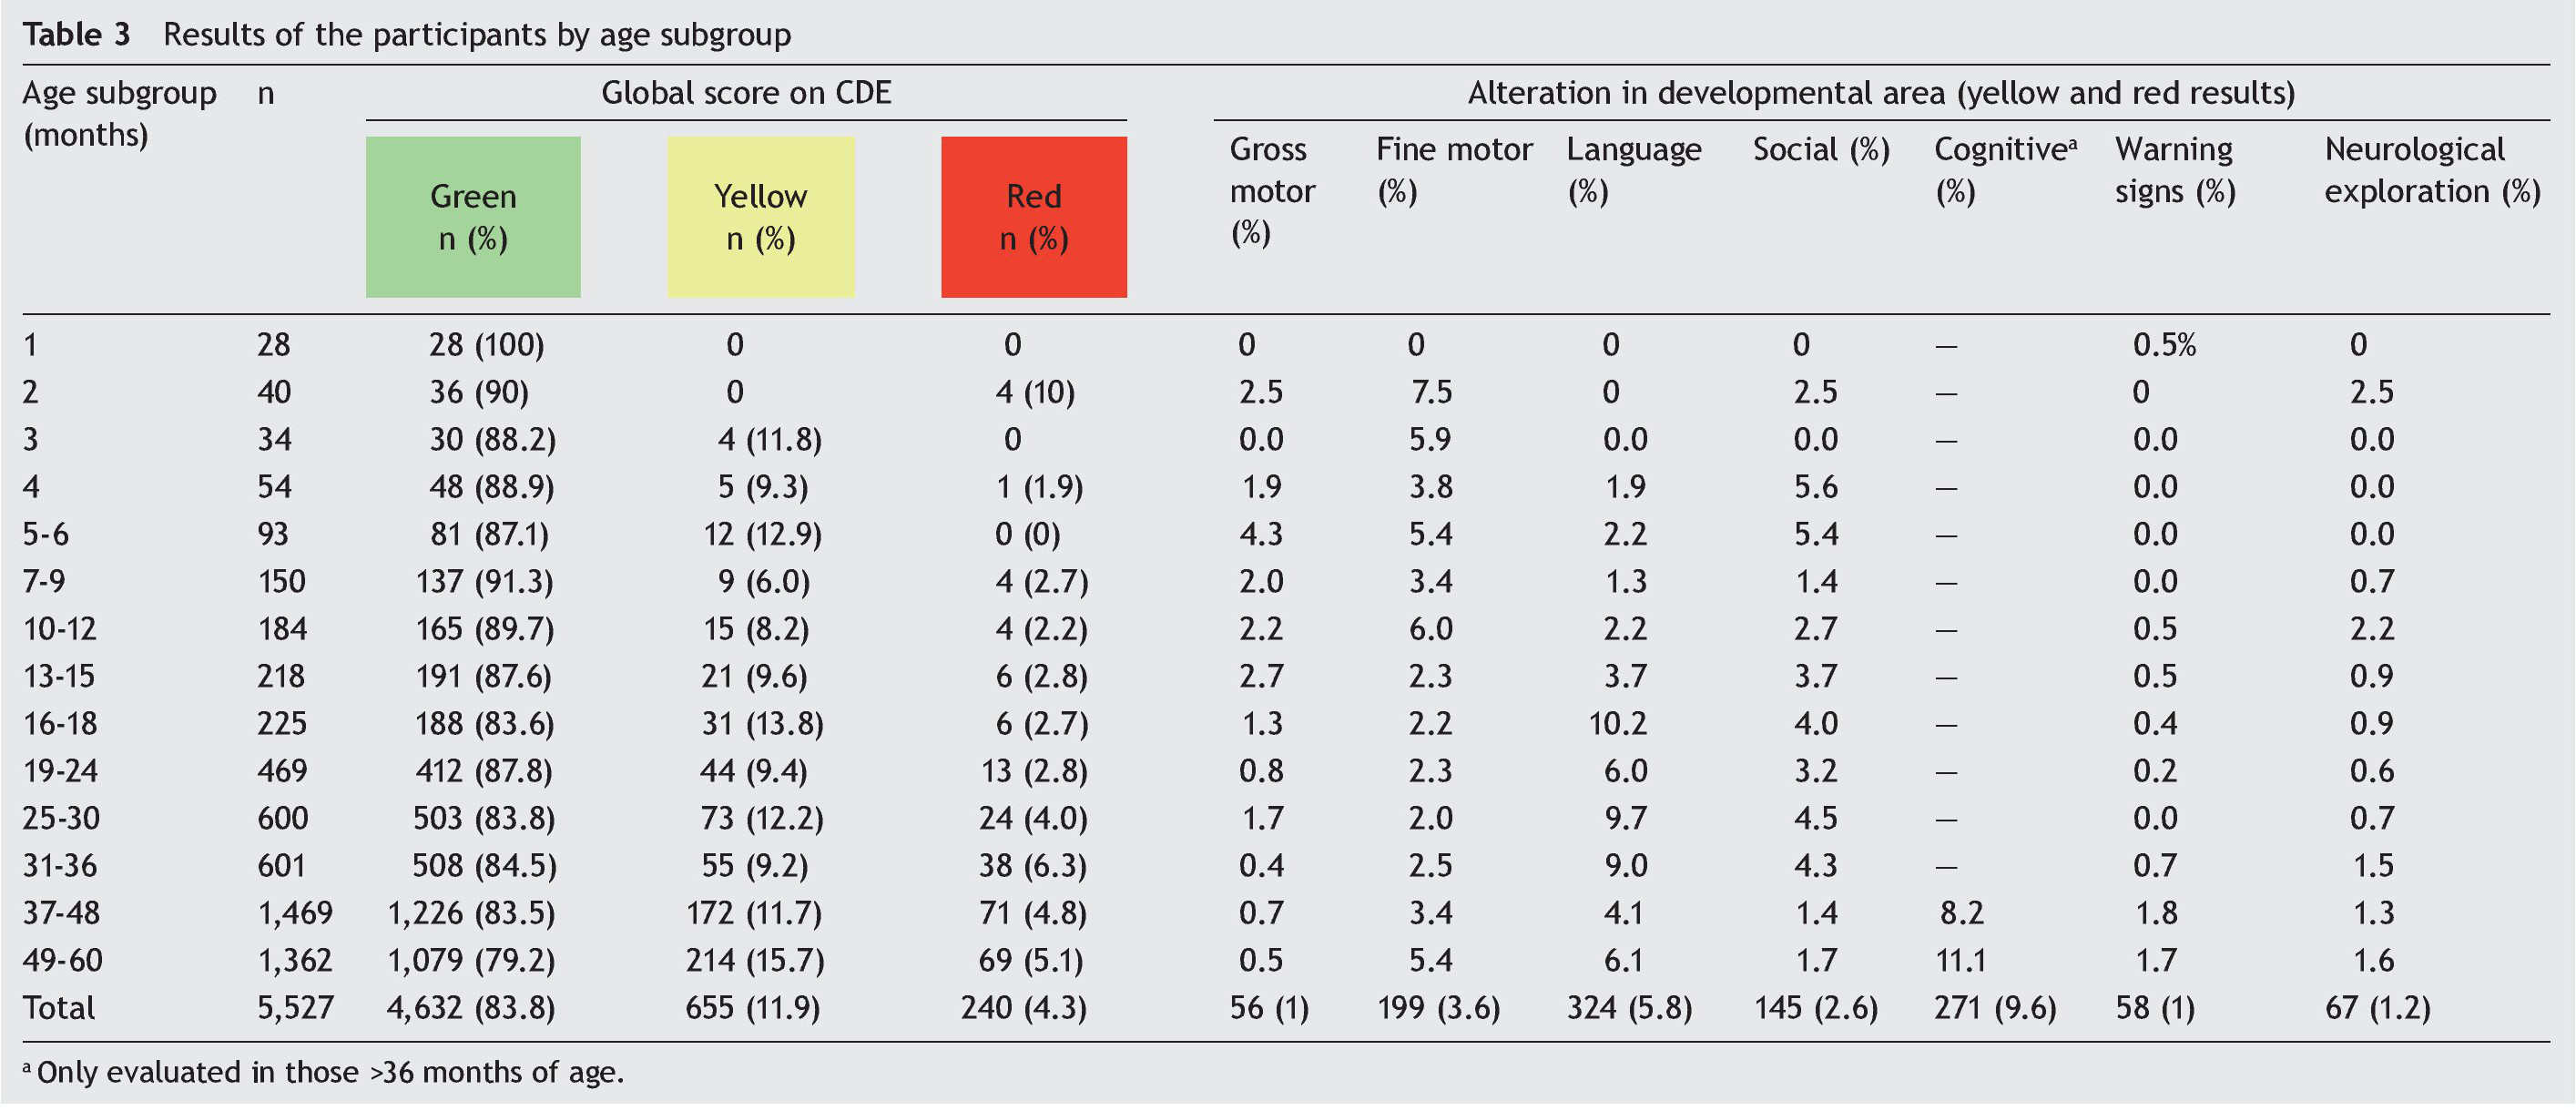
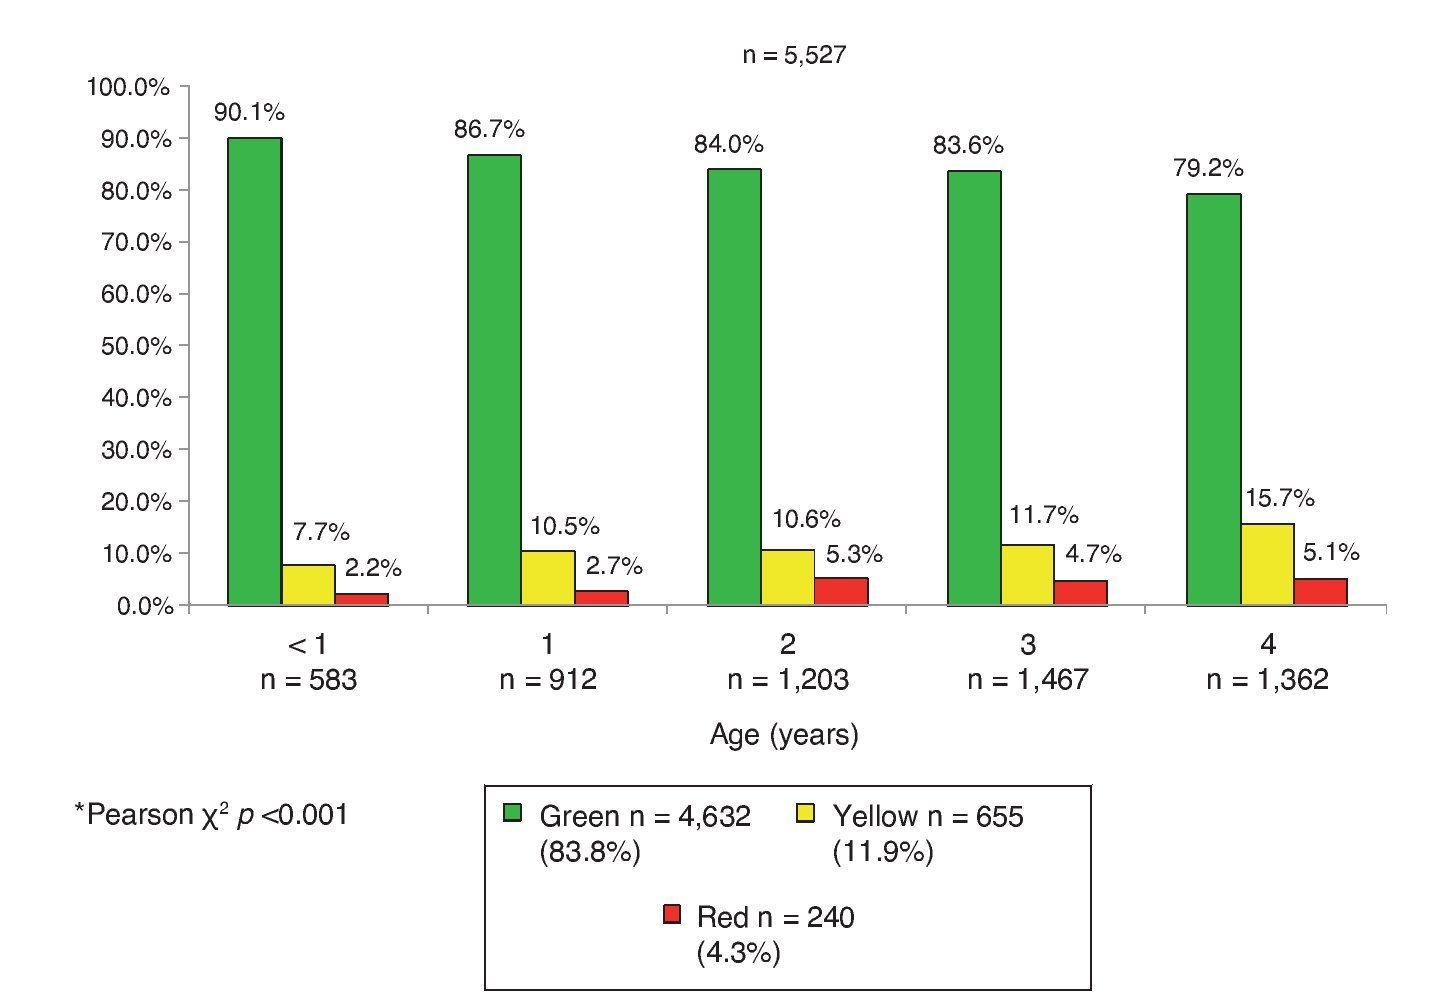
The global result of the CDE test in the total population was 83.8% green (n = 4632), 11.9% yellow (n = 655) and 4.3% red (n = 240); i.e., 16.2% of the participants (n = 895) had an abnormal result (Figure 1). Taking into account the groups of the CDE test (Table 1) a similar distribution was found. However, in group 1 (1 month, n = 28) there were no cases with yellow or red results found; in group 2 (2 months, n = 40) 10% of the children had a red result (n = 4) and there were none with a yellow result. Both in group 3 (3 months, n = 34) as in group 5 (5 and 6 months, n = 93) 11.8% (n = 4) and 12.9% (n = 12) of cases were found with a yellow result, respectively, but none with a red result (Table 3). The pattern of involvement of the areas of development per age subgroup is also shown: gross and fine motor skills were altered in all groups except in the first group (1 month of age). Gross motor skills had a higher percentage of involvement, up to 4.3% in the 5- and 6-month group (group 5), and fine motor skills of up to 6% in the 10- to 12-month group (group 7). There were abnormal results in language in all age groups except in the first three with up to 10.2% of those affected in the 16- to 18-month group. Some type of condition was found in the social area in all groups except for the first and third groups, with the most affected being that of the 4-month age group (5.6%). The higher frequency of alterations in the area of knowledge was 8.2% and 11.1% in children from groups 13 (37-48 months) and 14 (49-60 months of age), respectively (Table 3).
Figure 1 Global results of the CDE test by age group (years) in children affiliated with the Oportunidades de Coahuila*.
Differences in the frequency of participants with green and yellow results by type of location were found, but not so in the percentage of the red result. Of the total participants who live in urban (n = 2968) and rural locations (n = 2,559), there was a higher percentage of cases with green results in the urban population (85.5 vs. 81.8%, p <0.001). When analyzed by age group, this majority of participants with a green result was significant in the group <1 year of age (96.2 vs. 83%, p <0.001) and in the 3-years age group (85.6 vs. 81.1%, p <0.05).
When analyzed by gender, frequency of green, yellow and red results was different. Globally, 18.6% of male participants did not have a normal result compared with 13.7% of females (p <0.001). Specifically, there was a higher percentage of female participants who had a green result compared with males (86.3 vs. 81.4%, p <0.001). This difference was seen in the 4-year age group (84.6 vs. 73.9%, p <0.001).
3.1. Children with developmental delay (yellow)
A higher proportion of participants with a yellow result were seen as age increased: 7.7% in <1 year and up to 15.7% in the 4-year age group. Affected areas in children with yellow results were fine motor in 24.7% (n = 162); gross motor in 5.2% (n = 34); language in 33.4% (n = 219); social in 15.4% (n = 101); and knowledge in 59.6% (n = 230). A higher percentage of female participants had a yellow result in the gross motor area compared with males (7.6 vs. 3.4%; p = 0.016). This area was the only one with significant differences by gender.
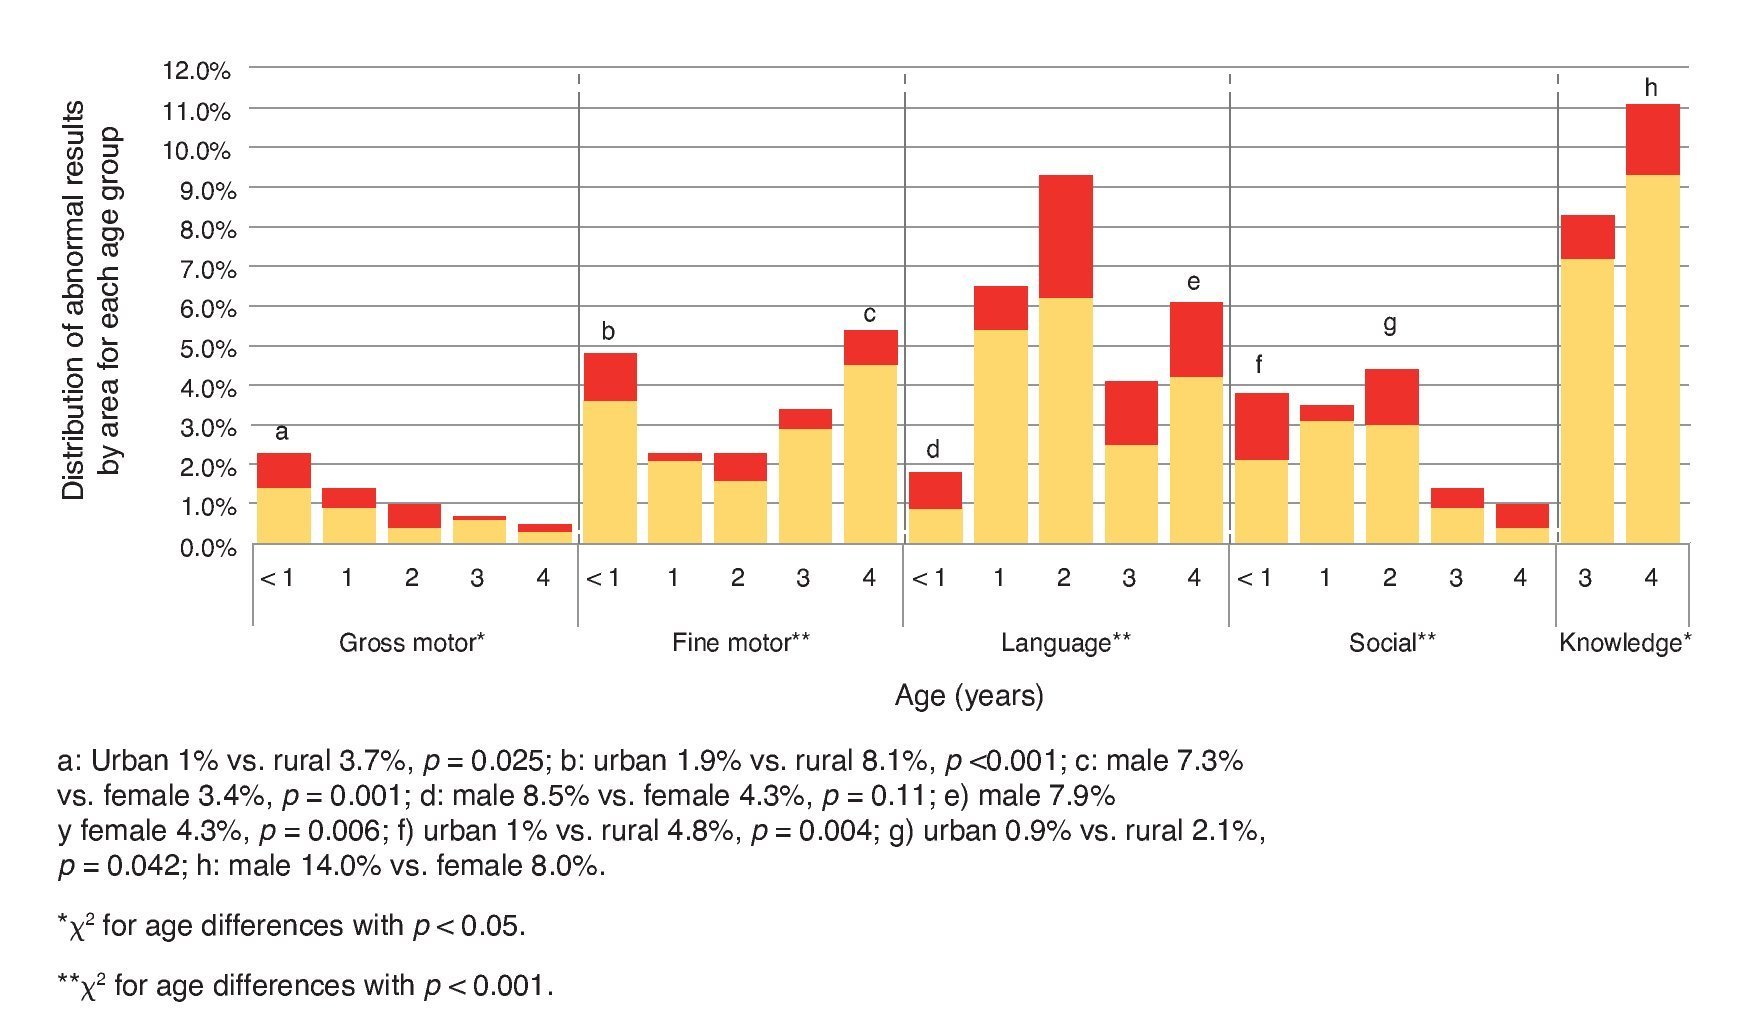
The percentage of results in yellow in the gross motor area was higher in the <1 year age group with a decreasing tendency in older children. In the fine motor area, yellow results were higher in the group <1 year of age compared with the groups from 1, 2 and 3 years, but with a gradual increase from 1 year up to 4 years of age. In the language area, the 1- and 2-year age groups presented the highest percentage of yellow results. In the social area, a gradual increase in the percentage of yellow results was seen from <1 year up to 2 years, with a marked decrease in the 3- and 4-year age groups. Finally, the area of knowledge was where the greater percentage of participants with yellow results was found and it was higher in the 4-year age group than in the 3-year-old group (Figure 2).
Figure 2 Results of the areas of development evaluated by age (years).
A higher percentage of the yellow result was found in the rural population (13.7 vs. 10.3%, p <0.001). When analyzed by age groups, this statistical significance was maintained only in the group <1 year of age (13.7 vs. 2.6%, p <0.001). There was a higher percentage of cases with yellow results in male patients compared with female (13.3 vs. 10.3%, p <0.001); when analyzed separately, this difference was only significant in the 4-year age group (19.5 vs. 11.8%, p <0.001).
3.2. Children with risk of delay (red)
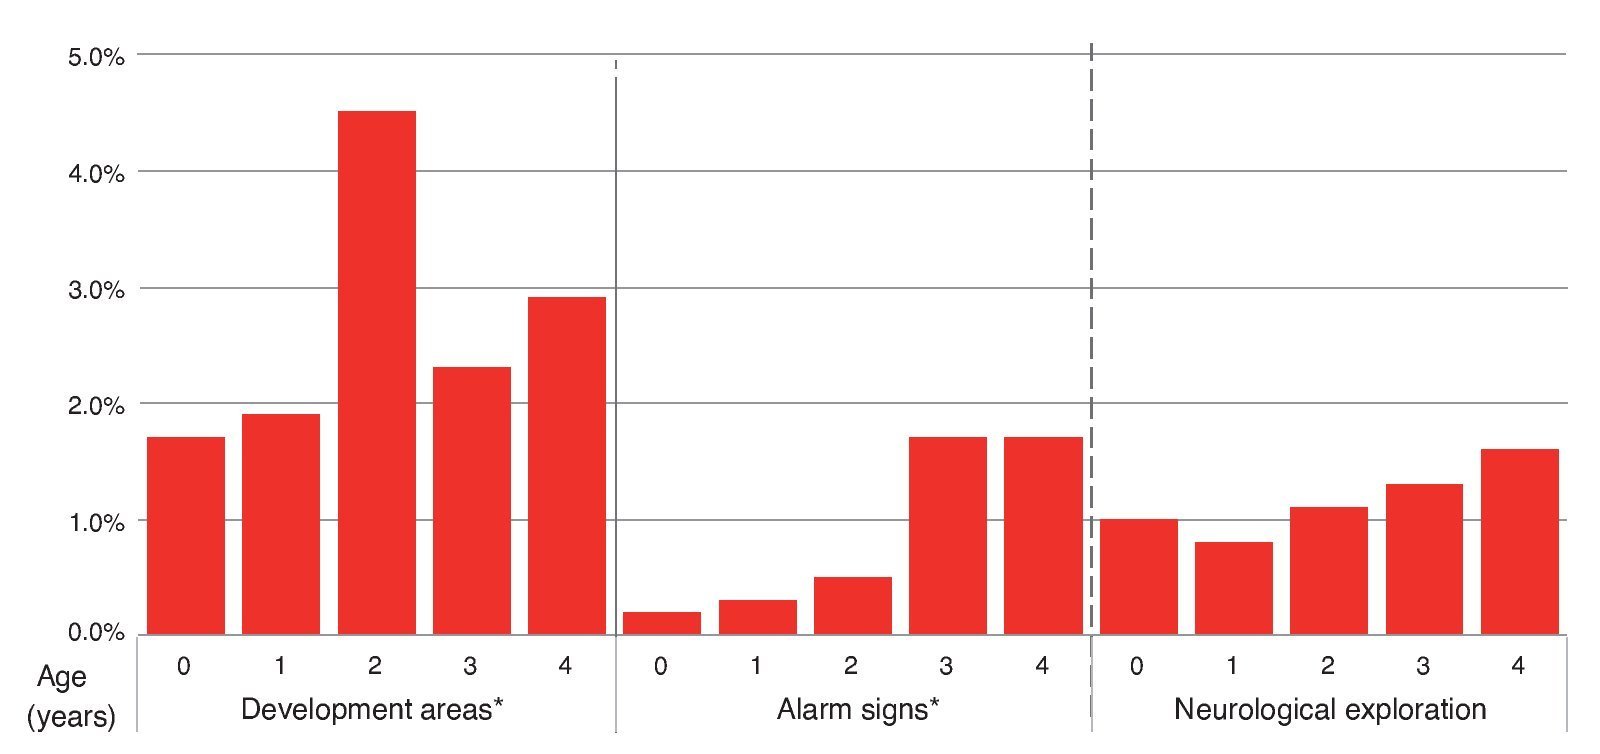
The causes for a red result were the following: 53.3% had alterations only in areas of development; 17.5% on neurological examination alone and 15% only had alarm signs (Figure 3). Distribution of red results had a different pattern from yellow results, from 2.2% in <1 year of age up to 5.1% in the 4-year-old group, but with a peak of 5.3% at 2 years. The percentage of children who had a red result in the area of development by age group was 1.7% in those <1 year of age, 1.9% in the 1-year-old group, 4.5% in the 2-year-old group, 2.3% in the 3-year-old group and 2.9% in the 4-year-old group. For the percentage for alarm signs it was 0.2% in the group <1 year of age, 0.3% in the 1-year of age group, 0.5% in the 2-year-old group, 1.7% in the 3-year-old group and 1.7% in the 4-year-old group. Abnormal neurological examination was found in 1.0% in those <1 year of age, 0.8% of the 1-year-old group, 1.1% of the 2-year-old group, 1.3% of the 3-year-old group and 1.6% in the 4-year age group (Figure 4).
Figure 3 Diagram of the key areas of development, warning signs and neurological exploration of the CDE test with red results (n = 240).
Figure 4 Distribution by age (years) of children identified as red by areas of development, warning signs and neurological exploration.
The affected areas of the participants with red result were: fine motor in 15.4% (n = 37); gross motor in 9.2% (n = 22); language in 42.5% (n = 102); social in 18.3% (n = 44) and knowledge in 29.0% (n = 40). Some observations were: a) the percentage of red results in the gross motor area was higher in <1 year with a tendency to decrease in children of higher age and having an increase at 2 years; b) the percentage of results in red in the fine motor area is higher in the group <1 year with respect to the 1, 2 and 3 year groups, but presents a gradual increase from 1 year up to 4 years with a peak at 2 years of age; c) in the area of language there is a peak in red results at two years which decreases at 3 years and moderately increases again at 4 years; d) in the social area the higher percentage of red results is found in <1 year, markedly decreases in the 1 year group, increases in an important manner in the 2 year group and decreases again in the 3 and 4 age groups (Figure 2).
No statistically significant differences were found in the total percentage of children in red by location. However, when analyzed by age groups, a higher percentage of participants with red result was found in the 3 year group in the rural environment with respect to the urban environment (6.1 vs. 3.6%, p <0.05) (Table 4). In the distribution of the red result a higher frequency of male participants with this result was observed (5.4 vs. 3.4%, p <0.001). This difference was statistically significant only in the 4-year age group (6.6 vs. 3.6%, p <0.05) (Table 4).
4. Discussion
The prevalence of delay is very variable because it depends on the measurement instrument used as well as the population evaluated. It is estimated to be between 5.7 and 13.9% for the U.S. population,21,22 between 3.69 and 11.8% of the Iranian,23,24 and up to 39.7% in those <5 years of age who live in the six poorest areas of China.25 The results of this study show for the first time in Mexico the prevalence of developmental problems in children <5 years of age, which results in 16.2% when those classified as yellow (11.9%) and red (4.3%) are added and which is comparable to other reports in the literature.24,26 This is explained by the characteristics of the CDE test, which identifies those <5 years of age who have a frank risk of delay (red) and those who have a lag in development (yellow). The fact that the CDE test identifies children who have a lag in development has the advantage of being able to offer them an intervention for preventing further significant delay. A point of attention is that, although the study population was of a low income, the prevalence of risk of developmental delay was not as high as that reported in communities in extreme poverty, which can be up to 40%.25 This could be explained by the difference in the degree of poverty in the study population, the test used and some cultural factors.
It should be noted that the percentage of children with green result showed a tendency to decrease as the age increased, with a gradual increase of children with yellow results. Although this decrease in green results and the increase in yellow and red results may be due to better sensitivity and specificity of the CDE testing in children >16 months of age, it may also suggest a lack of stimulation, being that a child would develop initially with minimal stimulation but will require more complex stimulation with growth.
Differences found between locations are due to a higher percentage of yellow results in the rural environment without differences in the percentage of red results between the urban or rural settings, suggesting that the type of location is not a determining factor; however, it appears that the children have a different developmental pattern. The results serve as a warning that the risk of delay can affect both the child in the urban as well as in the rural environment. The higher percentage of children in the rural environment with yellow results may be due to the fact that in the rural environment certain skills are acquired later. These differences could reflect, in a certain manner, the lifestyle of each location. A higher percentage of participants from the rural environment were found to have abnormal results in gross motor and fine motor skills in the <1 year-old group as well as in the social area in the groups <1 year of age and at 2 years of age. Delay in gross and fine motor skills may be due to the custom of carrying the newborn swaddled in a shawl, which prevents the child from developing gross or fine motor skills. This improves as the child grows and the mother is no longer able to carry the child. Delay in the social area could be due to less exposure to social stimuli in the rural environment. However, additional research is required to evaluate these differences.
Finding a higher percentage of male patients with abnormal results (yellow or red) compared with females agrees with what has been reported in other population-based studies where female participants obtained better scores in development than males.23 Different rearing practices and expected social behavior could explain the higher percentage of male participants with abnormal development in fine motor skills, language and knowledge: for boys it is expected that they perform intense physical activity, whether during recreation or helping the father at work, with little need for socialization or communication. Girls, however, play at interpreting roles and imitating household chores, which favors development of fine motor sills, language, social skills and, in turn, knowledge. Differences may also be due to differentiated patterns of neurodevelopment between boys and girls. To be able to define the weight of each factor in development, further research would be required.
Upon interpretation of the results of this study, one should take into account that only children affiliated with the PROSPERA program were evaluated. These children represent the population who live in a poverty situation and results cannot be extrapolated to the general population. In boys and girls <5 years of age and who were beneficiaries of PROSPERA, the prevalence of developmental delay is 4.3%. However, the prevalence of lag in development is 16.2%. It was determined that in males and at a higher age there is higher affection of development. More studies of this type are required to determine the true magnitude of developmental problems in Mexico.
Ethical considerations
This study utilized information obtained from the routine consultation of the healthy child evaluation. No authorizations were necessary from the committees of research, ethics and biosafety. Verbal authorization was obtained from the parents for applying the test and analyzing the results.
Ethical disclosure
Protection of human and animal subjects. The authors declare that the procedures followed were in accordance with the regulations of the relevant clinical research ethics committee and with those of the Code of Ethics of the World Medical Association (Declaration of Helsinki).
Confidentiality of data. The authors declare that no patient data appear in this article.
Right to privacy and informed consent. The authors declare that no patient data appear in this article.
Funding
Funding was provided from the Comisión Nacional de Protección Social en Salud (CNPSS).
Conflict of interest
The authors declare that there are no conflicts of interest.
Acknowledgments
To Alejandro Campos Rivera, Angélica María González Rivera, to the psychologists and health personnel who collaborated in the Strategy of Child Development in the state of Coahuila, Josuha Alexander Palma Tavera, Itzamara Jacqueline Martaín Pérez, Leopoldo Alfonso Cruz Ortiz, César Iván Baqueiro Hernández, Fátima Adriana Antillón Ocampo, Miriam Ibáñez Oran, Socorro de la Torre Juárez, Elías Hernández Ramírez and Ana Alicia Jiménez Burgos.
Received 15 October 2015;
accepted 22 October 2015
* Corresponding author.
E-mail:antoniorizzoli@gmail.com (A. Rizzoli-Córdoba).


