In this work, the influence of the nature of two materials, with the same chemical composition, on their in vitro behavior has been studied. Two routes were used to obtain these materials with the composition 45% CaO, 22% SiO2, 28% P2O5 and 5% MgO (wt.%). The first material is a glass-ceramic obtained by melting and quenching on cold water and the second one is a ceramic obtained by conventional solid state sintering. In both cases, the raw materials used were tricalcium phosphate, talc and wollastonite.
The reactivity in simulated body fluid and Tris–HCl solutions was studied. Both materials showed bioactive behavior, but the glass-ceramic dissolved faster, releasing large proportion of Ca and P ions, which afterwards nucleated and precipitated. However, the ceramic was more stable under the same conditions in these solutions. Glass-ceramic composite has a more open structure and allowed the faster formation of a bone-like apatite layer than the ceramic.
En este trabajo se estudia la influencia de la naturaleza de 2 materiales con la misma composición química en su comportamiento in vitro. Se han empleado 2 métodos para obtener estos materiales con una composición del 45% de CaO, 22% de SiO2, 28% de P2O5 y 5% de MgO en peso. El primer material, un vitrocerámico, se obtuvo mediante fusión y colado sobre agua fría. El segundo, una cerámica, se consiguió mediante sinterización convencional en estado sólido. En ambos casos las materias primas fueron fosfato tricálcico, talco y wollastonita.
Se estudió la reactividad frente a suero fisiológico simulado y solución Tris-HCl. Ambos materiales han mostrado comportamiento bioactivo pero el vitrocerámico evidencia una reactividad más alta, liberando cantidades mayores de iones Ca y P, los que posteriormente nuclean y precipitan. La muestra cerámica tiene un comportamiento más estable bajo las mismas condiciones en estas soluciones. El material vitrocerámico tiene una estructura más abierta y conduce a la formación más rápida de una capa de hidroxiapatita.
The materials, which are used to replace or supplement the functions of living tissues, are known as biomaterials. Ceramics, glasses and glass-ceramics have succeeded for several decades for bone repairing applications ([1], [2], [3], [4]). They are capable to bond tightly to bone but they are not fully replaced by new bone. The first bioactive biomaterial was developed by Hench et al. in 1969 ([5]). It consists of a silicate glass incorporating sodium, calcium and phosphorous ions, known as Bioglass®. In their studies, Hench et al. ([6]) showed that Bioglass® forms a calcium phosphate layer on its surface and through that layer joins to living bone. They found that the calcium phosphate layer on the glass can be formed in solutions buffered to pH 7.4 Tris (hydroxymethyl) aminomethane and hydrochloric acid (Tris–HCl buffer solution). Hench et al. ([7]) showed that some glass was adhered to living bone spontaneously, without formation of fibrous tissue at the surface. They found that in glasses of calcium phosphates, a layer can be formed in vitro in buffered solutions. Since then, it has been found that various ceramic materials, such as hydroxyapatite, β-tricalcium phosphate sintered, apatite-wollastonite glass-ceramic ([8]), join to living bone.
In the first years of study of biomaterials, bioactivity was determined by in vivo animal tests. In 2006, Kokubo et al. ([9]) showed that the in vivo bone bioactivity of a material can be predicted from the apatite formation onto surface in simulated body fluid solution (SBF which is close to human plasma). Thus, when new materials are obtained, bioactivity is checked through in vitro, prior to use in vivo.
The bioactive behavior of glasses and ceramic is identified as their ability to react chemically with living tissues, forming with them mechanically strong bonds. These bone bondings are attributed to the formation of an apatite-like layer on the glass surface, with composition and structure equivalent to the mineral phase of bone.
A lot of different materials have been developed and, in order to evaluate their goodness, compared with Bioglass® ([6], [7], [9], [10], [11]).
Material biodegradation does not depend exclusively on its physical and chemical properties but also on biological mechanisms. However, dissolution rate significantly affects the behavior of the material in vivo. If the material has an appropriate degree of solubility, resorption will take place, i.e., cells interact with the material and leading the process of bone regeneration.
The purpose of this paper is to explore the influence of the material structure (fully crystalline or glass-ceramic) on the bioactive behavior. For this, two materials were prepared with the same chemical composition within SiO2-P2O5-CaO-MgO quaternary system. In vitro studies were evaluated on two kinds of solutions, simulated body fluid (SBF) and Tris–HCl pH 7.4. The specimens were characterized by X-Ray Diffraction (XRD) and Scanning Electron Microscopy (SEM). The solutions were examined for changes in the concentration of Ca, Mg, Si and P ions using Inductively Coupled Plasma Atomic Emission Spectroscopy (ICP-AES).
ExperimentalIn the present work, a glass-ceramic (G-TCP60) and a ceramic (C-TCP60) with the same chemical composition, corresponding to 61 wt.% Ca3(PO4)2 (Tricalcium Phosphate: TCP in short), 24 wt.% CaSiO3 (Wollastonite: W in short) and 15 wt.% 3MgO·4SiO2 (Talc: T in short), were selected in the Ca3(PO4)2–CaSiO3–3MgO·4SiO2 (TCP-W-T) pseudo-ternary system.
The starting materials were a high-purity synthetic precursor of Ca3(PO4)2 from Carlo Erba Reagents, a reagent-grade high-purity Hydrous magnesium silicate, Talc, 3MgO 4SiO2·H2O, from Sigma–Aldrich, and a high-purity natural Wollastonite, CaSiO3, NYAD® 1250 from NYCO®.
Glass-ceramic powders were obtained by melting stoichiometric mixtures of the raw materials. The powder mixture was melted in an electric furnace for 2 h in a Pt crucible at 1500 °C. The molten glass was poured in water to obtain a frit (G-TCP60). Volumetric specimens of the glass-ceramics were selected for SBF studies and powder samples were used to test the biodegradability in Tris–HCl.
Polycrystalline bioceramic powder samples were obtained by conventional solid state sintering route. Raw materials were mixed by attrition milling in ethanol for 1 h and the powder was sieved to obtain a powder smaller than 100 μm. Disks of 10 mm in diameter and 5 mm in height were uniaxial pressed (1000 kg/cm2) and sintered at 1050 °C for 2 h. These pieces were ground with tungsten carbide mortar and sieved to a size between 45 and 100 μm. Ceramic powders obtained were used to test biodegradability in Tris–HCl. On the other hand, some of the obtained disks were used for in vitro SBF studies.
CharacterizationStarting raw materials were characterized by determining the particle size distribution by laser diffraction, chemical analysis using Malvern Mastersizer S (UK) and X-ray fluorescence using Philips MagiX (Germany).
As described before, samples were ground to powder with an average size below 100 μm using a tungsten carbide mill and characterized by X-ray diffraction (XRD) using a Bruker Multiload D8 diffractometer (Germany). Data were collected between 10° and 60° (2θ) in 0.05° steps, counting for 1 s per step and using CuKα radiation. The X-ray tube was operated at 40 kV at 40 mA. The Eva-version 6.0.0.1 Diffract plus software was used to evaluate the diffraction patterns.
Specific area of the obtained powders was determined using Quantachrome Monosorb Surface Area Analyser MS-13.
Tris–HCl solutions after treatments were analyzed by inductively coupled plasma atomic emission spectroscopy (ICP-AES) Iris Advantage of Thermo Jarrel Ash.
The morphology of the glass-ceramic and ceramic samples and the potential formation of hydroxyapatite layer on the surface of these biomaterials when immersed in SBF were studied by two kinds of Scanning Electron Microscopes. First a Hitachi TM-1000 SEM was used as first approximation. Selected samples were observed using a Field Emission Scanning Electron Microscope (FE-SEM), Hitachi S4700 (Japan), equipped with Energy Dispersive X-ray Spectroscopy (EDS). The samples were mounted in an adhesive carbon film for its observation and Ag coated by sputtering.
Biodegradability in Tris–HClThe specific surface area and particle size are variables that have a high incidence into the dissolution–precipitation process, especially if the process kinetics is very slow. The amount of sample contacted with the solution was calculated to use for both powders the same Sa/Vs ratio, with Sa: sample surface treated, Vs: volume of solution Tris–HCl (ml). For this study a ratio Sa/Vs = 3 m2/dm3 was used.
35 mg of C-TCP60 and 250 mg of G-TCP60 were deposited in 100 ml polyethylene tubes with conical bottom, and then were added the buffer solution Tris–HCl pH 7.4 ± 0.02 and 36.5° C, as proposed by Ducheyne et al. ([10]).
After 24 h, and 1, 2, 4 and 8 weeks of treatment, the solution was filtered and the powder washed several times with deionized water and then dried. The released Ca, Mg, Si and P ions to the medium were analyzed by ICP-AES.
Bioactivity in static simulated body fluidThe preparation of the SBF was carried out following the procedure reported in the ISO standard: 23317 ([12]), which is based on that proposed by Kokubo and Takadama ([9]). The samples of the materials were placed in a plastic holder and then in a plastic container. For this study a ratio of volume of liquid/sample surface 0.1 cm3/mm2 was used.
Bioactivity of both materials was studied by SBF in vitro tests for different periods of time (1–3 weeks). Disk-shaped samples were soaked into the SBF at pH 7.4 and 36.5 °C. An orbital shaker incubator with an agitation rate of 80 rpm was used. The evolution of the phases and the microstructural changes of the surface of the samples with the time of exposure to the solution were studied by SEM.
Results and discussionThe results of the characterization of the raw materials and of the study materials are shown in Table 1, Table 2, respectively:
Table 1. Some physical and chemical properties of the raw materials used.
| % | Ca3(PO4)2 | CaSiO3 | 3MgO·4SiO2 | |
| Particle size (Ø50% μm) | 5.7 | 3.2 | 7.6 | |
| Chemical analysis (XRF) (%) | CaO | 49.2 | 45.9 | – |
| P2O5 | 42.8 | – | – | |
| SiO2 | – | 50.4 | 60.6 | |
| MgO | – | – | 31.0 | |
| Loss on ignition | 4.6 | 1.4 | 5.9 | |
Table 2. Specific surface area (SSA) of the glass-ceramic and ceramic powders after milling.
| G-TCP60 | C-TCP60 | |
| SSA (m2/g) | 0.36 | 2.85 |
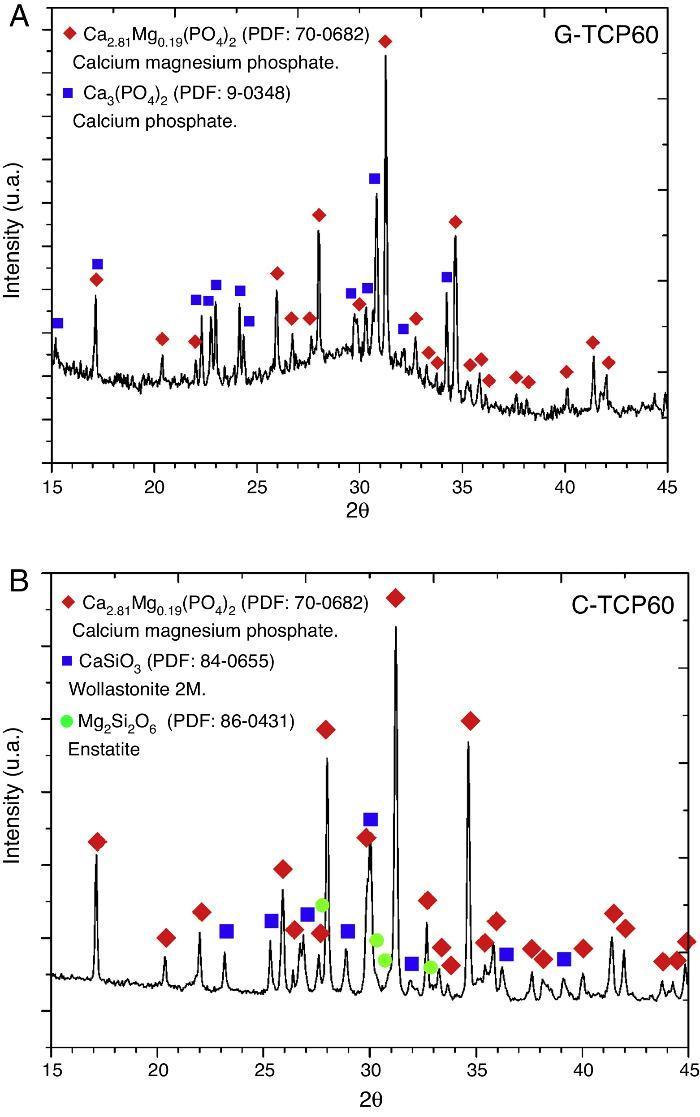
Glass-ceramic (Fig. 1A) and ceramic (Fig. 1B) powders were characterized by XRD. The results indicated that the obtained XRD diffraction pattern of the glass-ceramic (Fig. 1A) presented a broad peak centered at 30 2θ-degrees. This signal confirmed the amorphous structure of this sample ([11], [13]). Also the presence of crystalline phases was observed, specifically β-tricalcium phosphate, with magnesium solid solution, Ca2.81Mg0.19(PO4)2, and α-tricalcium phosphate, α-Ca3(PO4)2. 70-0682 and 9-0348 powder diffraction files were used respectively for its identification (The International Centre for Diffraction Data, ICDD. www.icdd.com). This indicates that the glass is devitrified during the cooling step. This crystallization would influence on its bioactive behavior.
Fig. 1. XRD patterns of the glass-ceramic (A) and the ceramic (B) materials with main peaks of each phase detected and labeled. These XRD patterns correspond to both materials before the in vitro experiments.
XRD results obtained with the C-TCP60 powder are shown in Fig. 1B. This poly-crystalline material had only crystalline phases. The ceramic material contains β-tricalcium phosphate, with magnesium solid solution, Ca2.81Mg0.19(PO4)2, wollastonite 2 M, CaSiO3, and probably traces of enstatite, Mg2Si2O6. 70-0682, 84-0655 and 86-0431 powder diffraction files were used respectively for its identification.
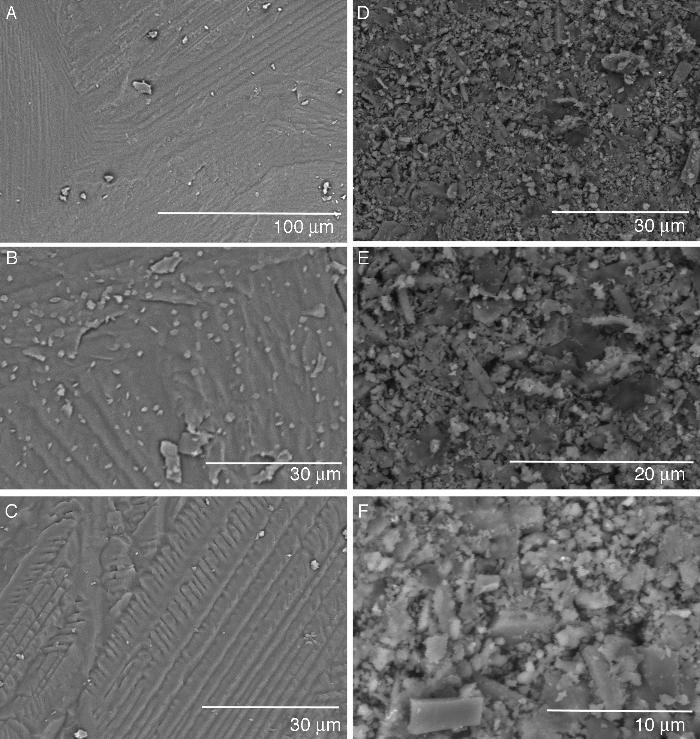
Fig. 2A–C shows different aspects of the fracture surface of the glass-ceramic. The images show the typical texture of a glass-ceramic material. The observed texture is produced by the combination of the glassy phase and the devitrified crystalline phases detected by XRD (see Fig. 1A).
Fig. 2. Hitachi TM-1000 SEM pictures of the glass-ceramic (A–C) and the ceramic (D–F) materials before immersion in SBF.
Fig. 2C–F shows the texture of the unpolished surface of a sintered pressed-disk of the ceramic material. This kind of observation was performed aiming to compare the surface of the samples before and after the SBF experiment. The microstructure is made up of crystals with different morphologies and a large size distribution of grains. There is some porosity between the grains that are composed of several phases of silicates and phosphates as detected by XRD (see Fig. 1B).
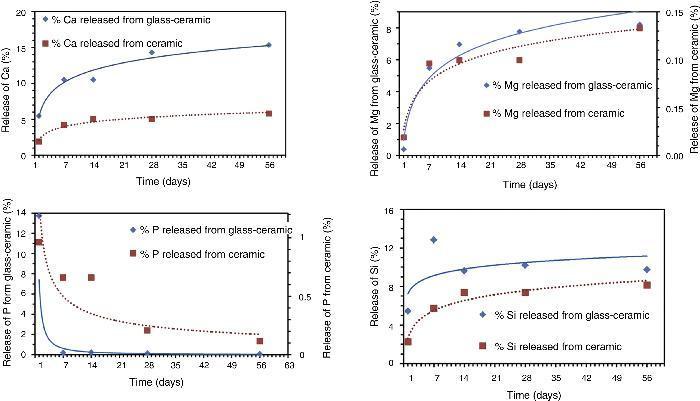
Biodegradability in Tris–HClThe result of the Tris–HCl experiment in vitro conducted using powder particles of the samples is shown in Fig. 3. The amount of extracted Ca, Si, P and Mg ions from the materials were measured up to 8 weeks of immersion in the solution. To compare the behavior of both materials the amount of each sample added to each polyethylene tube was measured and taken into account to calculate the percentage of elements released into the filtered liquid.
Fig. 3. Release of calcium (Ca), magnesium (Mg), phosphorous (P) and silicon (Si) ions in Tris–HCl experiments with soaking time.
From experimental data, it was found that both materials released gradually Ca throughout the test. A maximum value is not reached during the experiment. In both cases, glass-ceramic and ceramic samples, the behavior is similar, decreasing the lixiviation rate with time. It looks like the mechanism is controlled by diffusion as is usually considered. It is important to stand out that the amount of extracted Ca from the glass-ceramic sample is more than double the amount of Ca extracted from the ceramic material. It is quite remarkable that the amount of Ca leached from the glass-ceramic is around 15% from the total Ca of the sample. By using a spherical model for the particles’ morphology it was estimated that the Ca was completely removed from the surface layer of the particles. The thickness of this layer was estimated at 5% of the whole particle's radius. In other words, that means that the “penetration of attack” is around 5% in depth for the cations.
In the case of Mg the behavior is quite similar. Only the quantities extracted are different, that is lower for both samples compared with each own Ca amount extracted. The difference of release of Mg is bigger between both materials than in the case of Ca. Extrapolating from a spherical model of particles, in this case the “penetration of attack” is around 3% in depth for the glass-ceramic. It is noticeable that Mg from the silicate phases detected in the Ceramic material is less labile than Ca.
When analyzing the evolution of the P release, both materials showed a maximum rate at around 24 h and from that point gradually decreased. This was probably due to that when the phosphorus is dissolved, in the presence of Ca and Mg, it reaches solubility product value and then starts the nucleation on the surface of the particles of powders. If the medium is suitable, these phosphates provide the basis for the hydroxyapatite formation over the material surface. The excess of Ca and Mg induces the common ion effect, so that the precipitation reaction between Ca, Mg and P is promoted on the surface as mentioned. The level of P in the solution for the ceramic material is higher than in the glass material. It is in agreement with the level of Ca2+ and Mg2+ cations in the solution and the solubility product. This must be considered in order to explain the level of Ca and Mg in the solution. That means that the level of Ca and Mg released is higher but part of them was precipitated to form phosphates. In the case of Ca, it is coming not only from the Tricalcium Phosphate but also from the silicate phase present ([14]).
Apparently the evolution of silicon released shows a different behavior in both samples. As it can be seen in Fig. 3 the amount of silicon released from both samples is growing up in the first two weeks and from that point it remains constant. It seems that the dissolution process is slowed by the precipitation of the phosphates or silicates. The glass showed a faster release rate. An apparent maximum appears after one week of experiment but further experimental work is needed to understand this behavior.
The structure of the glassy phase within the glass-ceramic is made out of a network in which P, Si, Ca and Mg atoms are homogeneously distributed in the material ([15]). This structure allows P to have a continuous diffusion path to the surface. Additionally, the structural homogeneity of glass allowed release of Ca and Mg ions from any point on the surface in contact with the solution of Tris–HCl ([16]).
On the other hand, the ceramic material is a polycrystalline material whose phases are “heterogeneously” distributed. The dissolution of the phases occurs gradually and some grains do not come into contact with the solution, hence do not dissolve. This is the reason why this material shows more stable behavior than the glass-ceramic during this in vitro experiment.
The solubility order is: glassy phase > CaSiO3 > α-Ca3(PO4)2 > β-Ca3(PO4)2 > Mg2Si2O6, bearing in mind the results of the present Tris–HCl test and bibliographic data ([17], [18]).
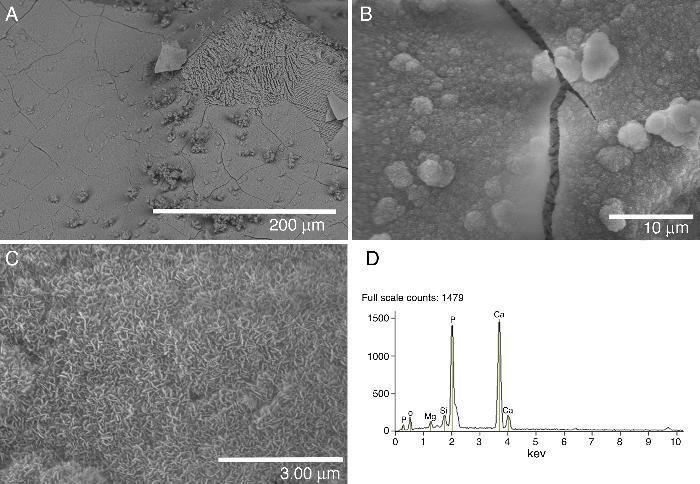
Bioactivity in SBFSEM micrographs of the glass-ceramic and ceramic surfaces after the immersion in SBF up to 21 days are shown in Fig. 4. Changes can be noticed for all samples.
Fig. 4. FE-SEM Hitachi S4700 pictures of the glass-ceramic surface after being soaked 21 days in SBF (A–C). EDS spectra recorded from the coating layer (D).
A layer covering the surface of the glass-ceramic sample was observed after 21 days of soaking in SBF (Fig. 4A–C). The visible cracks displayed by the layer in some images are artifacts caused by the drying process of the specimen in air after the test ([8], [19]). Even some spalling of the covering layer is observed at the top right corner of Fig. 4A. This layer was composed of crystals with plate-like morphology (Fig. 4B and C). This morphology is typical of apatite ([8], [19]). The SEM/EDS microanalysis performed showed that the newly formed apatite layer contained mainly Ca, P. Also, some Si and Mg elements coming from the underneath sample were detected in the EDS spectra (Fig. 4D).
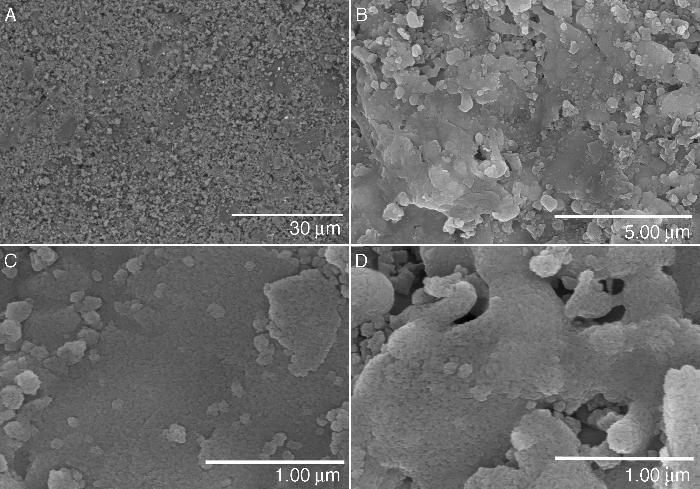
Consistent with the results of the Tris–HCl solution, few aggregates of apatite crystallites are formed on the surface of the ceramic material after 21 days of soaking in SBF (Fig. 5A–D). Some aggregates of crystals with the typical morphology of apatite are shown in Fig. 5B–D. Once again this material shows more stable behavior than the glass-ceramic during the in vitro experiments. In this case, the SEM/EDS microanalysis performed showed a high background noise of elements coming from the underneath sample and is not shown here.
Fig. 5. FE-SEM Hitachi S4700 pictures of the ceramic surface after being soaked 21 days in SBF (A–D).
ConclusionsTwo different Ca3(PO4)2 based biomaterials, a glass-ceramic and a ceramic, with the same chemical composition, have been obtained.
- Both materials exposed to the SBF led to the formation of apatite crystals. These crystals form a continuous layer onto the surface of the glass-ceramic material after 21 days of soaking while few crystals are formed onto the surface of the glass-ceramic material.
- In all cases (SBF and Tris–HCl tests), higher reactivity has been observed in glass-ceramic material.
- The “penetration of attack” for Mg and Ca cations in the glass-ceramic material was estimated between ∼3 and 5% in depth by using a spherical model for the particles’ morphology. Nevertheless, at the same time there are some precipitations of secondary phases because the content on the different ions reaches solubility product values.
- Differences in the reactivity of the samples in acellular solutions are due to differences in their mineralogical composition. The identified phases exhibit different solubility in Tris–HCl and SBF tests. The solubility order is: glassy phase > CaSiO3 > α-Ca3(PO4)2 > β-Ca3(PO4)2 > Mg2Si2O6.
- These differences give the opportunity to design composite materials mixing glass and ceramic powders according to their reactivity.
Acknowledgements
This work was supported by the Ministry of Economy and Competitiveness of Spain under projects MAT2013-48426-C2-1R, CSIC-201460E066 and UE COST Action MP 1301 (Newgen).
Received 26 August 2015
Accepted 5 October 2015
Corresponding author. mar@icv.csic.es


