


The lipid accumulation product (LAP) and visceral adipose index (VAI) are clinical markers of visceral obesity and were proposed as simple tools to estimate cardiovascular risk and mortality. The objective of this study was to analyze the accuracy of the VAI and LAP for high cardiovascular risk patients.
MethodsA cross-sectional observational study of accuracy was carried out in 193 patients of both sexes. In addition to the variables VAI and LAP, presence of comorbidities, education, level of physical activity and anthropometric data were obtained. Cardiovascular risk was determined by the Framingham score.
ResultsNo significant difference was observed in the sample in gender distribution (44.6% women; 55.4% men), 24.4% had low cardiovascular risk, 48.7% intermediate risk and 26.9% high cardiovascular risk. Linear regression analysis showed that VAI and LAP explain, respectively, only 2.4% and 5.2% of the variation in cardiovascular risk expressed by the Framingham score. The analysis of areas under the curve (AUC) for receiver operating characteristic (ROC) indicated a significant effect only of LAP to diagnose individuals with high cardiovascular risk, but with low sensitivity and specificity.
ConclusionOur results indicate that VAI and LAP explain only a small percentage of the variation in the Framingham cardiovascular risk score. LAP index still deserves more attention in a cohort study, because, even with the limitations of a cross-sectional study, we observed an acceptable sensitivity for it so that the LAP can be used as a screening criterion for requesting more accurate tests.
El producto de acumulación de lípidos (LAP) y el índice adiposo visceral (VAI) son marcadores clínicos de obesidad visceral y fueron propuestos como herramientas simples, económicas y precisas para estimar el riesgo cardiovascular y la mortalidad. El objetivo del estudio fue analizar la precisión de los índices VAI y LAP para el diagnóstico de personas con alto riesgo cardiovascular.
MétodosSe realizó un estudio observacional transversal de precisión en 193 pacientes de ambos sexos en la unidad de cardiología de un hospital universitario. Además de las variables VAI y LAP, se obtuvieron datos sociodemográficos, presencia de comorbilidades, escolaridad, nivel de actividad física y datos antropométricos para caracterizar la muestra. El riesgo cardiovascular se determinó mediante el Framingham Score.
ResultadosNo se observaron diferencias significativas en la muestra en la distribución por género (44,6% mujeres; 55,4% hombres), 24,4% riesgo cardiovascular bajo, 48,7% riesgo intermedio y 26,9% riesgo cardiovascular alto. El análisis de regresión lineal mostró que VAI y LAP explican, respectivamente, solo el 2,4% y el 5,2% de la variación del riesgo cardiovascular expresado por el Framingham Score. El análisis de áreas bajo la curva (AUC) para la característica operativa del receptor (ROC) indicó un efecto significativo solo de LAP para diagnosticar individuos con alto riesgo cardiovascular, pero con baja sensibilidad y especificidad.
ConclusiónNuestros resultados indican que VAI y LAP explican solo un pequeño porcentaje de la variación en la puntuación de riesgo cardiovascular de Framingham. El índice LAP aún merece más atención en un estudio de cohortes, ya que, aún con las limitaciones de un estudio transversal, observamos una sensibilidad aceptable del mismo para que el LAP pueda ser utilizado como criterio de cribado para solicitar pruebas más precisas.
Obesity is a significant risk factor for many conditions, such as metabolic syndrome (MS) and cardiovascular disease (CVD) and is the leading cause of preventable death worldwide. In turn, CVDs are among the leading causes of death across the globe.1,2
Especially excess of abdominal fat is directly associated with the pathogenesis of insulin resistance (IR) and the development of CVD, being more strongly related to metabolic abnormalities than total and subcutaneous adiposity.3,4
Lipid accumulation product (LAP) is a clinical marker of visceral obesity and was proposed as a simple, inexpensive, and accurate tool to estimate cardiovascular risk and mortality. It combines anthropometric parameters and metabolic variables as effective and reliable markers also to predict MS, since the gold standard methods for assessing visceral fat are expensive, and waist circumference measurement alone does not distinguish between subcutaneous and visceral fat.5–7 The visceral adipose index (VAI) is known to indirectly reflect the adipose tissue function and can be used to predict cardiometabolic diseases, such as insulin resistance (IR) and type 2 diabetes mellitus.8
Therefore, LAP and VAI were suggested as reliable markers, since the hyperinsulinemic-euglycemic clamp test is time-consuming and expensive, and the most frequently used validated marker Homeostasis Model Assessment of Insulin Resistance Index (HOMA-IR) may present difficulties as plasma insulin levels are difficult to measure.9 Thus, the LAP and the VAI are easily accessible and low-cost indices that can facilitate the stratification of cardiovascular risk in situations where the variables necessary for the calculation of the Framingham score are not accessible.
On the other hand, there are also validated CVD prediction models such as the Framingham score. Framingham risk estimates a ten-year risk of developing a first atherosclerotic cardiovascular disease (ASCVD) event. This risk score system's variables include age, diabetes mellitus, total cholesterol, high-density lipoprotein cholesterol (HDL-c), blood pressure, and current smoking status.10,11
Although the Framingham cardiovascular risk score has been validated for a population aged 30–74 years,12 the score has also been used in cardiovascular risk stratification of younger adults.13–16
Based on above, the primary objective of this study was to analyze the effect of the LAP and VAI indices on the Framingham cardiovascular risk score, as well as the accuracy of these indices for identifying adults with high cardiovascular risk (HCR) based on the Framingham score.
Material and methodsStudy design, setting and participantsThis analytical, primary, observational, cross-sectional, single-center study. The study was structured based on the STROBE recommendations for observational studies.17 The study will be carried out with medical records from a Cardiology Unit of the Hospital Beneficente da UNIMAR (HBU), in the city of Marília/SP. To minimize recording errors, data from medical records were extracted by two independent evaluators.
The sample was non-probabilistic for convenience and during the study period all medical records were accessed. The sample universe consisted of 300 patients and, after checking the medical records, 193 were included in the study. All medical records of adult and elderly patients of both sexes aged between 30 and 74 years, which contain all the variables necessary for the study, were included.
The minimum sample size to analyze the effect of independent variables on cardiovascular risk by the Framingham score using linear regression analysis was 186 patients. The sample size was estimated for a small effect size (f2=0.06), type I error (α) of 5%, study power of 80%, number of tested predictors of 3 and a total of 10 predictors. The calculations were performed using the G*Power software, version 3.1.9.2 (Franz Faul, Universität Kiel, Germany).
The Research Ethics Committee approved the study of the University of Marília – São Paulo – Brazil, as established by the National Health Council. In addition, this study will be carried out in accordance with the Code of Ethics of the World Medical Association (Helsinki Declaration, revised in 2013).
Study variablesFor the study, data on age, sex, education, level of physical activity, smoking, alcohol consumption, presence of morbidities, anthropometric measurements, blood pressure and laboratory tests were obtained. Data on schooling are dichotomized into incomplete (<11 years of study) and complete (≥11 years of study) basic education. The level of physical activity was categorized according to the minutes per week of moderate to vigorous physical activity in: sedentary (no time of physical activity per week); little active (less than 150min per week of physical activity); active (≥150min per week of physical activity).18 Smoking, alcohol consumption and morbidities were recorded in terms of presence or absence.
For anthropometric variables, weight, height, and calculation of body mass index (BMI), and waist circumference were collected. Waist circumference was evaluated based on the cutoff points recommended by the World Health Organization (WHO, 1995): normal or no risk (<80cm for women and <94cm for men), high risk (80≥WC<88cm for women; 94≥WC<102cm for men), very high risk (≥88cm for women; and ≥102cm for men) and BMI: low weight (<18.5kg/m2), adequate weight (≥18.5kg/m2 and <25kg/m2), overweight (≥25kg/m2 and <30kg/m2) or obese (≥30kg/m2).
The following parameters were evaluated: fasting glucose, insulinemia (to calculate the Homa-IR index), glycated hemoglobin (HbA1c), total cholesterol, low-density lipoprotein (LDL-c), high-density lipoprotein (HDL-c), and triglycerides. To assess insulin resistance, the Homeostasis Model Assessment of Insulin Resistance Index (HOMA-IR) was calculated.
LAP was calculated using the formula for women (waist circumference [cm]-58) multiplied by triglycerides [mmol/L] and men (waist circumference [cm]-65) multiplied by triglycerides [mmol/L] L. VAI was calculated according to [WC/{39.68+(1.88×BMI)}]×(TG/1.03)×(1.31/HDL-C) in men and as [WC/{36.58+(1.89×BMI)}]×(TG/0.81)×(1.52/HDL-C) in women.19,20
The Framingham risk score (FRS) was used to investigate the risk of cardiovascular disease.21 The FRS was calculated and categorized according to the parameters described by D’Agostino et al.12 The percentage of absolute CVD risk at 10 years was classified as low risk (<10%), intermediate risk (10–20%) and high risk (>20%). For regression analysis and accuracy, cardiovascular risk according to the Framingham score was also dichotomized into: “high risk”; “no high risk”.
Statistical analysisQualitative variables were described by the absolute (N) and relative (%) frequency distribution. Differences in the proportion distribution for the variables were analyzed by the chi-square test and the relationship between the qualitative variables. Quantitative variables were described by the mean and standard deviation (SD). The homogeneity of variances was analyzed by Levene's test. The comparison of means between the groups (FRS: low, medium and high) was predicted by the ANOVA-one-way test followed by the Post hoc Bonferroni test. For quantitative variables that violated the hypothesis of homogeneity of variances, the Welch test was performed followed by the Games–Howell Post hoc comparison. The simple linear regression model was used to analyze the effect of independents (LAP and VAI) on Framingham score values using the Enter method. R2 was analyzed to verify the coefficient of determination of the percentage of variation explained by the model. The receiver operating characteristic (ROC) curve was used to identify the sensitivity and specificity of the cutoff points for LAP and VAI in determining high cardiovascular risk by the Framingham score. The areas under the curve (AUC) and the 95% CI were determined and the 95% CI did not have to include the 0.50 value. The cut-off point was established by the Youden index confidence interval. The significance was set at 5% (p-value ≤0.05) and the significance level adopted was 5%, and the data were analyzed using SPSS software (version 24.0).
ResultsRegarding the frequency distribution of cardiovascular risk stratification by the Framingham score, 24.4% had low cardiovascular risk, 48.7% intermediate risk and 26.9% high cardiovascular risk. Tables 1 and 2 show the characteristics of the sample in relation to the stratification of cardiovascular risk by the Framingham score.
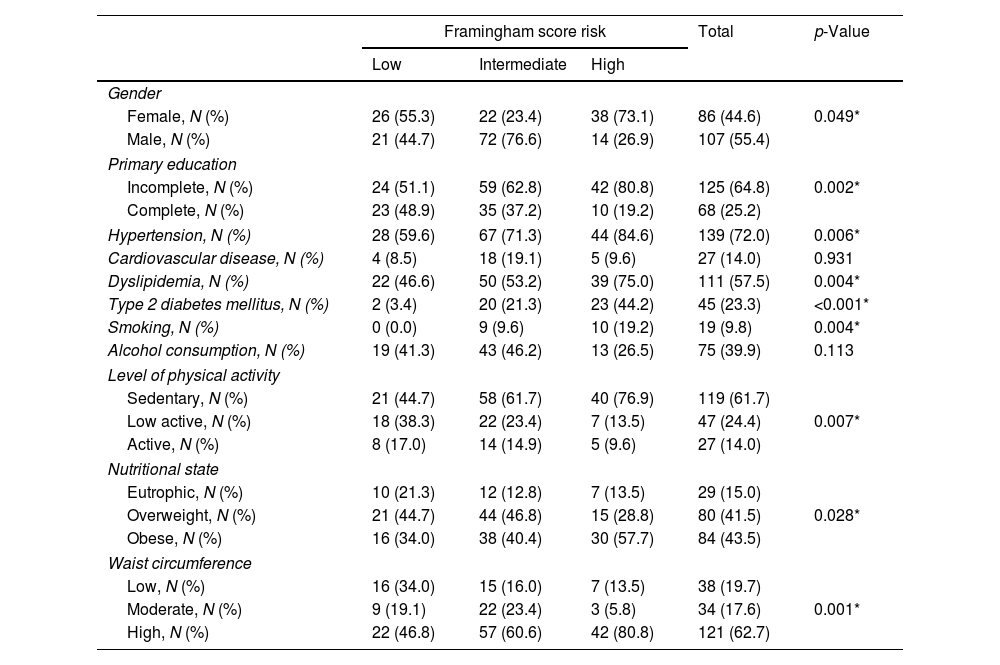
Analysis of the association of the frequency distribution of qualitative variables by cardiovascular risk stratum by the Framingham score.
| Framingham score risk | Total | p-Value | |||
|---|---|---|---|---|---|
| Low | Intermediate | High | |||
| Gender | |||||
| Female, N (%) | 26 (55.3) | 22 (23.4) | 38 (73.1) | 86 (44.6) | 0.049* |
| Male, N (%) | 21 (44.7) | 72 (76.6) | 14 (26.9) | 107 (55.4) | |
| Primary education | |||||
| Incomplete, N (%) | 24 (51.1) | 59 (62.8) | 42 (80.8) | 125 (64.8) | 0.002* |
| Complete, N (%) | 23 (48.9) | 35 (37.2) | 10 (19.2) | 68 (25.2) | |
| Hypertension, N (%) | 28 (59.6) | 67 (71.3) | 44 (84.6) | 139 (72.0) | 0.006* |
| Cardiovascular disease, N (%) | 4 (8.5) | 18 (19.1) | 5 (9.6) | 27 (14.0) | 0.931 |
| Dyslipidemia, N (%) | 22 (46.6) | 50 (53.2) | 39 (75.0) | 111 (57.5) | 0.004* |
| Type 2 diabetes mellitus, N (%) | 2 (3.4) | 20 (21.3) | 23 (44.2) | 45 (23.3) | <0.001* |
| Smoking, N (%) | 0 (0.0) | 9 (9.6) | 10 (19.2) | 19 (9.8) | 0.004* |
| Alcohol consumption, N (%) | 19 (41.3) | 43 (46.2) | 13 (26.5) | 75 (39.9) | 0.113 |
| Level of physical activity | |||||
| Sedentary, N (%) | 21 (44.7) | 58 (61.7) | 40 (76.9) | 119 (61.7) | 0.007* |
| Low active, N (%) | 18 (38.3) | 22 (23.4) | 7 (13.5) | 47 (24.4) | |
| Active, N (%) | 8 (17.0) | 14 (14.9) | 5 (9.6) | 27 (14.0) | |
| Nutritional state | |||||
| Eutrophic, N (%) | 10 (21.3) | 12 (12.8) | 7 (13.5) | 29 (15.0) | 0.028* |
| Overweight, N (%) | 21 (44.7) | 44 (46.8) | 15 (28.8) | 80 (41.5) | |
| Obese, N (%) | 16 (34.0) | 38 (40.4) | 30 (57.7) | 84 (43.5) | |
| Waist circumference | |||||
| Low, N (%) | 16 (34.0) | 15 (16.0) | 7 (13.5) | 38 (19.7) | 0.001* |
| Moderate, N (%) | 9 (19.1) | 22 (23.4) | 3 (5.8) | 34 (17.6) | |
| High, N (%) | 22 (46.8) | 57 (60.6) | 42 (80.8) | 121 (62.7) | |
* Indicates a significant association with cardiovascular risk stratification by the Framingham score by the chi-square test for the association for p-value ≤0.05.
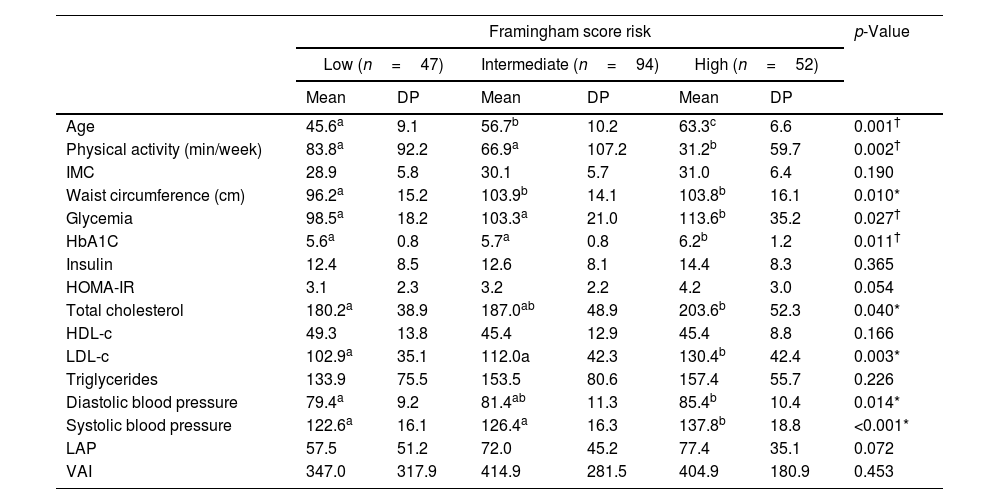
Comparison of the mean and standard deviation (SD) of the quantitative variables between the cardiovascular risk strata by the Framingham score.
| Framingham score risk | p-Value | ||||||
|---|---|---|---|---|---|---|---|
| Low (n=47) | Intermediate (n=94) | High (n=52) | |||||
| Mean | DP | Mean | DP | Mean | DP | ||
| Age | 45.6a | 9.1 | 56.7b | 10.2 | 63.3c | 6.6 | 0.001† |
| Physical activity (min/week) | 83.8a | 92.2 | 66.9a | 107.2 | 31.2b | 59.7 | 0.002† |
| IMC | 28.9 | 5.8 | 30.1 | 5.7 | 31.0 | 6.4 | 0.190 |
| Waist circumference (cm) | 96.2a | 15.2 | 103.9b | 14.1 | 103.8b | 16.1 | 0.010* |
| Glycemia | 98.5a | 18.2 | 103.3a | 21.0 | 113.6b | 35.2 | 0.027† |
| HbA1C | 5.6a | 0.8 | 5.7a | 0.8 | 6.2b | 1.2 | 0.011† |
| Insulin | 12.4 | 8.5 | 12.6 | 8.1 | 14.4 | 8.3 | 0.365 |
| HOMA-IR | 3.1 | 2.3 | 3.2 | 2.2 | 4.2 | 3.0 | 0.054 |
| Total cholesterol | 180.2a | 38.9 | 187.0ab | 48.9 | 203.6b | 52.3 | 0.040* |
| HDL-c | 49.3 | 13.8 | 45.4 | 12.9 | 45.4 | 8.8 | 0.166 |
| LDL-c | 102.9a | 35.1 | 112.0a | 42.3 | 130.4b | 42.4 | 0.003* |
| Triglycerides | 133.9 | 75.5 | 153.5 | 80.6 | 157.4 | 55.7 | 0.226 |
| Diastolic blood pressure | 79.4a | 9.2 | 81.4ab | 11.3 | 85.4b | 10.4 | 0.014* |
| Systolic blood pressure | 122.6a | 16.1 | 126.4a | 16.3 | 137.8b | 18.8 | <0.001* |
| LAP | 57.5 | 51.2 | 72.0 | 45.2 | 77.4 | 35.1 | 0.072 |
| VAI | 347.0 | 317.9 | 414.9 | 281.5 | 404.9 | 180.9 | 0.453 |
BMI: body mass index; HbA1c: glycated hemoglobin; HDL-c: high-density lipoprotein; LDL-c: low-density lipoprotein; LAP: lipid accumulation product; VAI: visceral adipose index.
No significant difference was observed in the sample in gender distribution (44.6% women; 55.4% men), but a higher proportion of women was found in the high cardiovascular risk stratum. In those with lower education level, a higher proportion of patients with high cardiovascular risk was observed. There was a significant association between high cardiovascular risk and the presence of hypertension, dyslipidemia, type 2 diabetes mellitus, smoking, physical inactivity and obesity according to BMI and waist circumference (Table 1).
Comparing the quantitative variables (Table 2), subjects with high cardiovascular risk had less physical exercise per week and older age, glycemia, HbA1c, LDL-c and systolic blood pressure (SBP) when compared to those with intermediate cardiovascular risk is low. Patients with high and intermediate cardiovascular risk had higher waist circumference values compared to the low cardiovascular risk group. No significant differences were observed between groups regarding VAI and LAP indices.
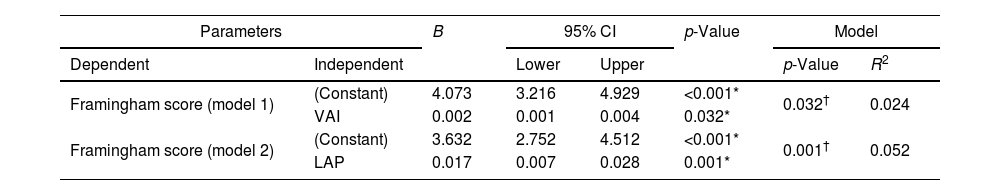
Simple linear regression analysis was performed to analyze the effect of VAI (model 1) and LAP (model 2) on the Framingham score (Table 3). A significant effect of VAI and LAP on the Framingham cardiovascular risk score was observed, but the R2 values indicate that these variables explain only a small part of the variation in the cardiovascular risk score. The increase in the VAI is related to the elevation in the score, however the variation in the VAI explains only 2.4% (R2) of the variation in the Framingham score. Although the LAP performed better and its elevation is significantly related to increased cardiovascular risk, its variation explains only 5.2% (R2) of the variation in the Framingham score.
Multiple linear regression analysis of VAI and LAP variables on the Framingham score for cardiovascular risk stratification.
| Parameters | B | 95% CI | p-Value | Model | |||
|---|---|---|---|---|---|---|---|
| Dependent | Independent | Lower | Upper | p-Value | R2 | ||
| Framingham score (model 1) | (Constant) | 4.073 | 3.216 | 4.929 | <0.001* | 0.032† | 0.024 |
| VAI | 0.002 | 0.001 | 0.004 | 0.032* | |||
| Framingham score (model 2) | (Constant) | 3.632 | 2.752 | 4.512 | <0.001* | 0.001† | 0.052 |
| LAP | 0.017 | 0.007 | 0.028 | 0.001* | |||
LAP: lipid accumulation product; VAI: visceral adipose index; B: regression coefficient; 95% CI: 95% confidence interval for B.
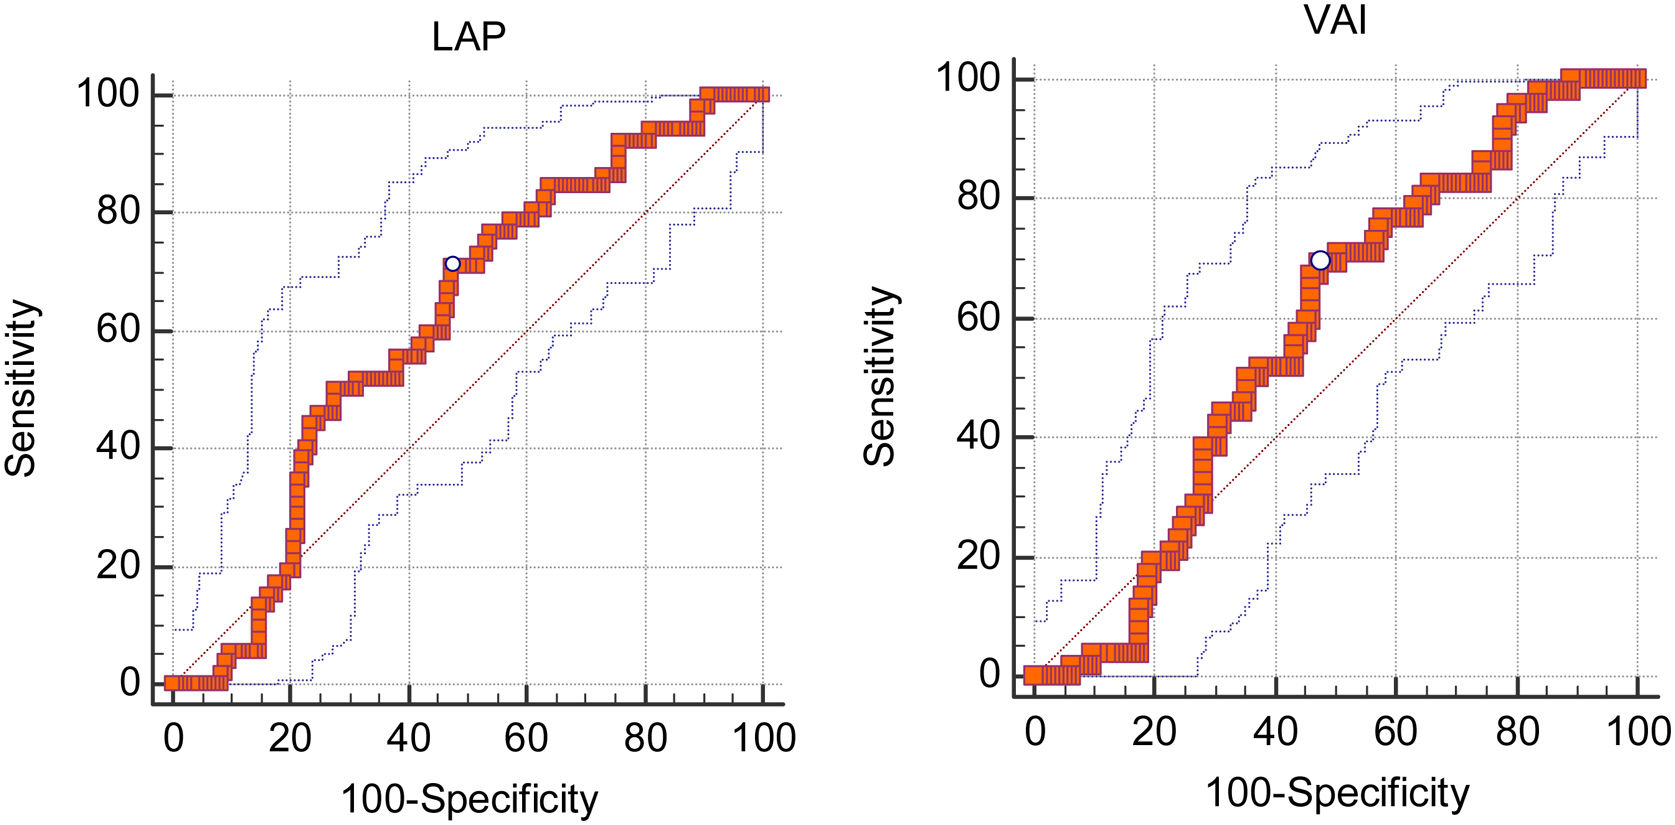
Table 4 and Fig. 1(A and B) present an analysis of the area under the curve (AUC), sensitivity and specificity of the cut-off points determined by the confidence interval of the Youden index for LAP and VAI to identify patients at high cardiovascular risk. To analyze cardiovascular risk, the Framingham score was dichotomized into: “high cardiovascular risk”; and “without high cardiovascular risk”. LAP showed significant AUC for the diagnosis of patients at high cardiovascular risk by the Framingham score. However, the AUC value for LAP suggests a limited ability to diagnose individuals with high cardiovascular risk. In addition, the LAP showed low sensitivity and specificity. VAI did not show significant AUC. When analyzing the AUC confidence intervals of the LAP and VAI, no significant differences were observed between the indices regarding the accuracy to identify patients with high cardiovascular risk by the Framingham score.
Analysis of the area under the curve (AUC), sensitivity and specificity of VAI and LAP for the diagnosis of high cardiovascular risk by the Framingham score.
| Index | Cutoff point | AUC (95% CI) | p-Value | Sensitivity (95% CI) | Specificity (95% CI) |
|---|---|---|---|---|---|
| LAP | >53.93 | 0.609 (0.537–0.679) | 0.011* | 71.1 (56.9–82.9) | 52.4 (43.9–60.9) |
| VAI | >313.69 | 0.576 (0.503–0.647) | 0.073 | 69.2 (54.9–81.3) | 52.4 (43.9–60.9) |
LAP: lipid accumulation product; VAI: visceral adiposity index.
 analysis, sensitivity and specificity of lipid accumulation product (LAP) (A) and visceral adiposity index (VAI) (B) indices for the diagnosis of high cardiovascular risk by the Framingham score.")
As shown in the results, the variation in the VAI explains only 2.4% (R2) of the variation in the Framingham score, and LAP explains only 5.2%. Furthermore, LAP showed significant AUC for the diagnosis of patients at high cardiovascular risk by the Framingham score, and for AUC confidence intervals, both indices showed no significant differences regarding the accuracy to identify patients with high cardiovascular risk by the Framingham score. Although the LAP showed significant AUC, our results suggest that the ability of this index to diagnose patients with high cardiovascular risk is limited. Nonetheless, Ioachmescu et al.,22 observed that LAP could be a predictor of mortality from cardiovascular risk.
The increase in WC and BMI has been related to the proportional increase in LAP, and VAI.23,24 Although our results show higher WC values in patients with high cardiovascular risk, no significant difference was observed in VAI and LAP values between cardiovascular risk strata.
Guo et al.,25 observed that blood glucose and HbA1C were significantly correlated with the Framingham score. Our results showed elevated blood glucose and HbA1C values in patients at high cardiovascular risk. However, for insulin and HOMA-IR, no significant differences were observed between the Framingham cardiovascular risk strata.
Although our results point to a relatively low AUC for the use of LAP as a diagnostic criterion of high cardiovascular risk, there are studies that also observed a significant AUC of LAP and higher and other parameters that demonstrate an association with cardiovascular diseases.26,27 According to Nunes et al.,26 LAP presented a greater area under the curve (AUC) than BMI, waist circumference, and sagittal abdominal diameter. In a study carried out in the United States, it was also found that the LAP had a higher AUC than the triglyceride index and VAI; that is, the LAP was considered positive when showing an influence on the IR index.27
Furthermore, in a ten-year British cohort study, LAP showed a positive relationship with the incidence of cardiovascular disease, based on a large Caucasian adult community free of cardiovascular disease at baseline. In addition, LAP was shown to be a better predictor of CVD when compared to other anthropometric indices.28 The fact that this is a cross-sectional observational study (and the sample is mostly composed by patients with some cardiovascular risk factor) may have reduced the power of the study, even though it was still stratified as low risk.
In evaluating a middle-aged and elderly population, the study of Shin et al.,29 showed that LAP and VAI were both significantly related to MS, a risk factor for CVD. Thus, LAP had a high AUC, suggesting a better accuracy of this indicator than other markers for the diagnosis of MS. The LAP also showed a significant association, both with the diagnosis of prediabetes and type 2 diabetes mellitus in women and a positive association for cardiovascular risk.30
Kouli et al.,31 analyzed VAI scores with CVD incidence. After 10 years, the authors observed that individuals who developed CVD had 29% higher VAI scores. The group of participants who developed CVD was composed mainly of older men, smokers, with high values of BMI, waist circumference, triglycerides/HDL-c ratio, higher levels of fasting glucose, and high blood pressure. In addition, VAI was positively correlated with BMI, waist circumference, CRP, IL-6, TNF-α, TG, total cholesterol, and glucose levels. In our research, higher VAI values were more associated with intermediate risk of CVD, according to the Framingham score.
After excluding confounding factors through regression analysis, it was found that LAP and VAI explain a small percentage of variation in cardiovascular risk. Although LAP values do not have a high ability to determine cardiovascular risk, this index can offer practical advantages due to its ease of access, even if it does not significantly improve risk prediction in a statistical model. Thus, the LAP, in particular, could be used in clinical decision-making to request additional exams, since it showed a sensitivity of 71.0% (95% CI: 56.9–82.9) to identify patients with high cardiovascular risk.
ConclusionLinear regression results indicate that VAI and LAP explain only a small percentage of the variation in the Framingham cardiovascular risk score. Considering the AUC analysis, we discourage the use of VAI as a diagnostic criterion for patients with high cardiovascular risk. However, the LAP index still deserves more attention in a cohort study, because, even with the limitations of a cross-sectional study, we observed an acceptable sensitivity for it so that the LAP can be used as a screening criterion for requesting more accurate tests.
Conflicts of interestThe authors declare that they have no conflict of interest.