


The restructuring processes of the Spanish financial entities over the last years has led us to analyze financially how efficiency and solvency of banks and savings banks explain the decisions of incorporation and control of these entities. We analyze 51 Spanish financial entities for the period 2008-2012. The results show higher solvency and efficiency of banks over savings banks. On the other hand, after the first integrations it is observed that it is still early for these ratios to improve on the results obtained by the entities before the integrations. However, from the financial point of view, these integrations do explain how correct the start-up and intensification of the restructuring processes were. There are some exceptions to the global criteria, which are explained by the size, strength and structure of the business and the closeness of its financial management scope to the area and business structure of the bigger banking groups.
Los procesos de reestructuración de las entidades de crédito españolas en estos últimos años nos han llevado a analizar en qué medida la eficiencia y solvencia de estos dos tipos de entidades explican las decisiones de integración y dominio de las mismas viéndolo, únicamente, desde un punto de vista de análisis financiero. Para ello analizamos 51 entidades españolas en el periodo 2008-2012. Los resultados muestran unos mayores valores de solvencia y eficiencia de los bancos sobre las cajas. Por otro lado, se observa que aún es pronto para que, tras las primeras integraciones, estos ratios superen los mejores valores a nivel individual. No obstante, sí que explican estas concentraciones, desde el punto de vista abordado, el financiero, lo acertado del inicio e intensificación en los procesos de reestructuración, así como las decisiones de forma societaria de la entidad dominante y/o resultante tras la integración. Existe alguna excepción al criterio general aludido, siendo en tal caso explicada por el tamaño, fortaleza y estructura de negocio, más cercana en el campo de su gestión financiera al ámbito y estructura de negocio de los grandes grupos bancarios.
In the summer of 2007 the “subprime mortgages” crisis started. These were a financial product whose risks were spread among various agents and markets through securitization and credit derivatives. At first, this situation did not affect the Spanish authorities directly, but it was one of the triggers of a chain of effects in global economies and financial markets that soon, among other factors, would affect Spain.
Its immediate consequence was the deterioration of liquidity and funding, which drove several authorities to take support measures which had varying effects both over time and in inland areas of application.
In the case of Spain the passage from the crisis of the financial economy to the real economy took less than a year from the appearance of the first symptoms in North America. The Spanish economy fell into recession in late 2008. The fall in production and rising unemployment pushed up default rates of banks and savings banks and, consequently, the need for higher provisions of insolvency. Furthermore, there was an increase in financial costs brought about by the increasing reliance on wholesale funding and also by sudden difficulties in these markets. In addition, the slowdown in the housing market affected many entities that had a high concentration in the field of real estate development and construction (Aríztegui, 2011).
With this background, it was already clear that there was an urgent need to undertake a restructuring of the sector and to support this process in a way that allowed the solvency to be strengthened of those institutions that decide to undertake plans to improve their efficiency through mergers or other integration transactions.
Clearly by late 2011, and throughout 2012 and 2013, we were witnessing an intense reorganization process of territorial financial institutions (savings banks) which, forced by a series of regulatory rules, sought to strengthen the system and thus “solve the problems of liquidity, solvency and default of these entities” (Palomo, Sanchis-Palacio, & Gutiérrez-Fernández, 2011).
Consequently, savings banksa are in particular the main figures in the restructuring process. Their legislation reform involved significant changes in its legal form, with several variants. Thus, the adjustment to the declining demand gave rise to a situation of excess capacity, leading to an urgent need to resize the sector (González Sánchez & García Muiña, 2011). All the savings banks, except Caixa Ontinyent and Pollensa, transferred their assets and liabilities to another entity regulated as commercial bank with the structure of a public limited company, in which those saving banks which have not been nationalized or taken over are major shareholders.
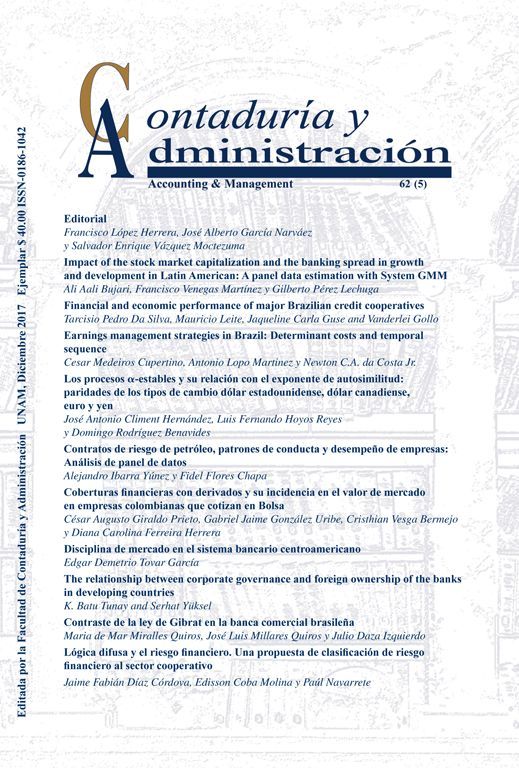
These circumstances are of sufficient importance to merit research on whether these restructuring processes are improving the situation of the sector. We must point out that these restructuring processes are not unique of the Spanish Banking system. As we deep in the previous literature, we observe how these processes were carried out in other countries, even when the intensity of the crisis was not as worldwide as now. In this sense, we noted that several studies addressed the impact of the reform of the financial systems in the sector from an international point of view. An example of this can be seen in Table 1, although some of the studies are not strictly comparable in terms of full homogeneity, not only for the political systems in the respective countries but also for the type of problems, as they provide information on the intended purpose of restructuring examples in the banking sector at some level.
Reforms of the financial systems from an international point of view.
| Country | Year | Effects | Authors |
|---|---|---|---|
| Germany | 1986-2001 | Germany experiences one of the deepest consolidating processes, compared to USA, UK or Japan | Koetter, et al. (2004) |
| 1993-2003 | The success or not of the banking mergers which mainly happened in the 90's was an open debate One of the conclusions of this paper is that that entities arising from a merger are successful | Koetter (2005) | |
| China | 2003-... | Because of the reform, the banking system achieved a homogeneous structure, not only in terms of profitability, efficiency and quality of the assets, but also in size and geographical location. The restructuring of the banking sector was a basic pillar in the reform process and was focused on improving the solvency of the main Chinese Banks. | García Herrero and Santabárbara García (2009) |
| Egypt | 1992-2007 | After analyzing the impact of the reform of the financial systems on the competitiveness and efficiency of the banking system and the impact on economic growth in the short and long term, the conclusion is that reforms have a positive and significant effect on competitiveness and efficiency of production | Poshakwale and Qian (2011) |
| United States | 1990-2006 | The number of banks in the United States fell by 32% between 1990 and 2006. In the mergers of “local” banks (community banks), the acquirers were more efficient and managed objectives better. These mergers led to the acquirer being stronger and more efficient and to better management of the bank | Jagtiani (2008) |
| Greece | 2001-2009 | Worsening of efficiency (2003-2009) and solvency (2001–2009) of the Greek financial sector | Martín de Vidales Carrasco (2010) |
| Italy | 1985–1996 | After the mergers, there is no evidence of any improvement in profits: the increase of the revenues (in the face of a wider market for services and increased lending) is offset by an increase in labour costs. However, it is shown that after the merger profitability increases | Focarelli, Panetta, and Salleo (2002) |
| 1995-2000 | The results suggest the existence of benefits in terms of efficiency, deriving from the banks’ consolidation | Colombo and Turati (2004) | |
| Japan | 1990-2000 | The restructuring of the financial system occurs in the 1990s. Though the loan losses were almost unanimously recognized as the origin of the fall of the Japanese banking system, it was not clear that they were the sole cause of the persistence of the crisis. Political responses highlighted the need to improve efficiency, especially, and drove more mergers | Bou-Said and Saucier (2003) |
| Jordan | 1990-... | The banking sector has witnessed significant developments over the past two decades. Since 2003 there has been an unprecedented development in the work of banks in terms of quantity and quality. Moreover, the efficient functioning of the banking sector has become one of the main objectives of financial reforms. Profitability and efficiency also become one of the challenges faced by banks to strengthen their financial position to take on the risks associated with globalization | Ramadán, Kilani, and Kaddumi (2011) |
| Latinamerica | 1993-2000 | Analysis of eleven Latin American countries during a period characterized by significant restructuring reforms of their banking systems. A high degree of competition in banking is associated with reduced margins, low profitability and greater cost efficiency | Yildirim and Philippatos (2007) |
| Nordic Countries | 1988-1990 | In order to overcome the crisis, countries like Norway, Finland and Sweden opted for restructuring measures like mergersFor the particular case of Norway, mergers of troubled banks with larger solvent banks were chosen | Thorvald et al. (2004) |
| 1985-1990 | In the case of Finland, the overall efficiency analysis shows that it is lower in merged banks than in non merged ones | Kuussaari (1993) | |
| 1964-1985 | In Denmark and Finland, for example, mergers made the purchaser large enough to act independently abroad | Fagerland Jacobsen (1997) | |
| Portugal | 1990-1995 | Following the reform of the Portuguese banking system from 1986, the efficiency of new domestic banks in a more competitive banking system is quantified | Canhoto and Dermine (2003) |
| South Africa | 1999-2008 | The analysis of the evolution of competition and efficiency of the banking sector shows a progressive decrease in the number of efficient banks. It also reflects the dominance of five major banks that together represent more than 85% of total bank assets | Mlambo and Ncube (2011) |
| Turkey | 2005-... | Its banking system, once it had pulled through the severe financial crisis of1999 to 2001, has in recent tax years shown adequate levels of solvency, profitability and efficiency | Calvo Bernardino and Martín de Vidales Carrasco (2010) |
| Furthermore, the efficiency analysis reveals that market share is the most important determinant of efficiency. This result supports the idea that banks benefit from economies of scale and as they increase their market share they will be better able to utilize their excess capacity | Ozdincer and Ozyildirim (2006) | ||
| Venezuela | 1996-2001 | Mergers that took place in the Venezuelan banking system sought to reduce processing costs, take advantage of economies of scale, strengthen net worth and technological and operational transactions with a view to increasing the profitability of their activities | Bracho, Ariza, González, and Jiménez (2002) |
After this review, we observed how after the restructuring process there are two variables, efficiency and solvency, which in most cases improve considerably.
This paper aims to be the first in a series of observations over the next few years (until 2016 at least) and aims to ascertain, first which financial entities had higher efficiency and solvency values. It also seeks to discover whether the concentration decisions of the Spanish banking sector followed the guidelines according to the values obtained by these two variables and according to previous experiences in other contexts. After that first goal, we thought it important to analyze the situation after the first integrations and to provide the methodology, with the values of the ratios indicated, for analysis in future years.
Therefore, for proper monitoring and analysis, this paper is structured in five sections. After the introduction, the second part provides a review of the development of those standards affecting the banking sector during 2009-2013. The third section describes the sample and presents the methodology and variables used in the analysis. Section 4 presents the findings and Section 5 analyzes the entities that were involved in any restructuring process. The paper ends with the main conclusions and lines for future research.
Literature reviewAt a European level, several studies analyze the significant impact degree that the Economic and Monetary Union (EMU) has on the competence of the banking sector in those countries which adopted the single currency (Bikker & Groeneveld, 2000; emsp De Bandt & Davis, 2000); whether bank concentration in a national market has a negative impact on the financial solvency of European banks (Uhde & Heimeshoff, 2009) or the determinants of bank profitability in several European countries, and also that a higher degree of concentration leads to a higher profitability (Molyneux & Thornton, 1992). In this sense, international comparisons of banking efficiency can be used to identify, among others, issues of international consolidation of the banking industry. González (2009) analyzes the influence of bank efficiency and policy variables on the market structure. Their results are consistent with the efficiency-structure hypothesis, which states that the most efficient banks have, on average, higher levels of domestic market that enhance market concentration.
Studies have demonstrated appropriate values of efficiency and solvency of the Spanish banking sector, mainly in late 2008 (Álvarez, 2008; emsp Maudos, 2009b). In this sense, although this efficiency had fallen from 2007, in 2008 it stood at 47%. As regards degree of solvency, in December 2008, with a value of 11.3%, Spain was at levels close to the European average (11.9% in the EU-15), well above the minimum required 8%. (Maudos, 2009a). However, in 2010, efficiency deteriorated. Bigger banks were more efficient than the industry average (Maudos, 2011). As for the differences between banks and savings banks, previous studies show how the savings banks are less efficient and solvent than banks. Fernández de Guevara (2007) analyzed the period 1992-2004 and Carbó and Maudos (2010) to December 2009. Climent (2013) analyzes the determinants of solvency of the Spanish financial institutions in the period 2006-2009, concluding that banks achieve better solvency than savings banks.
Other studies show how in banks and savings banks there is a significant positive correlation between measures of size, efficiency and financial profitability (Marín, Gómez, & Gómez, 2008) or Bernad, Fuentelsaz, & Gómez (2009), who claim that although it seems that mergers and acquisitions have sometimes been an effective way to deal with increased competition deriving from the new competitive environment, they do not always manage to improve the results of the entities involved. Moreover, other studies like Fernández, Fonseca, and González (2006) find that banks take more risks than savings banks, and Fonseca and González (2005) state that as the political presence increases on savings banks, so does their risk, as they may take riskier investments in the pursuit of political ends. The possibility of transferring funds in the commercial relationship between savings banks and regional governments can also favor risky investments, especially in saving banks with higher levels of public participation.
Elsewhere, the latest stress test published (September 2012) for a number of entities, shows this initial trend of solvency strength behind decisions made.
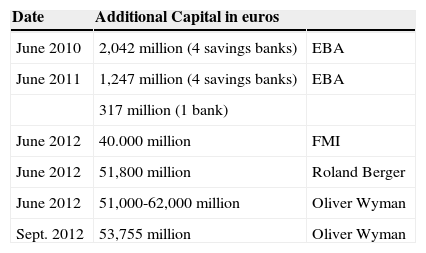
Regulatory developments 2009-2013Apart from the legal aspects of the savings banks and their need to transform and update as a consequence of the necessary adaptation to European directives, (including the initial definition of the Fund for Restructuring and Banking management), we can state that it was not until late 2011, early 2012, when the standards, were issued (and measures of economic and financial policy), were clearly determined in Spain regarding restructuring and, especially, decreasing the debt of the financial system.
In this sense, we briefly show in Figure 1 synopsis and content of the standards and their evolution from 2009-2013.

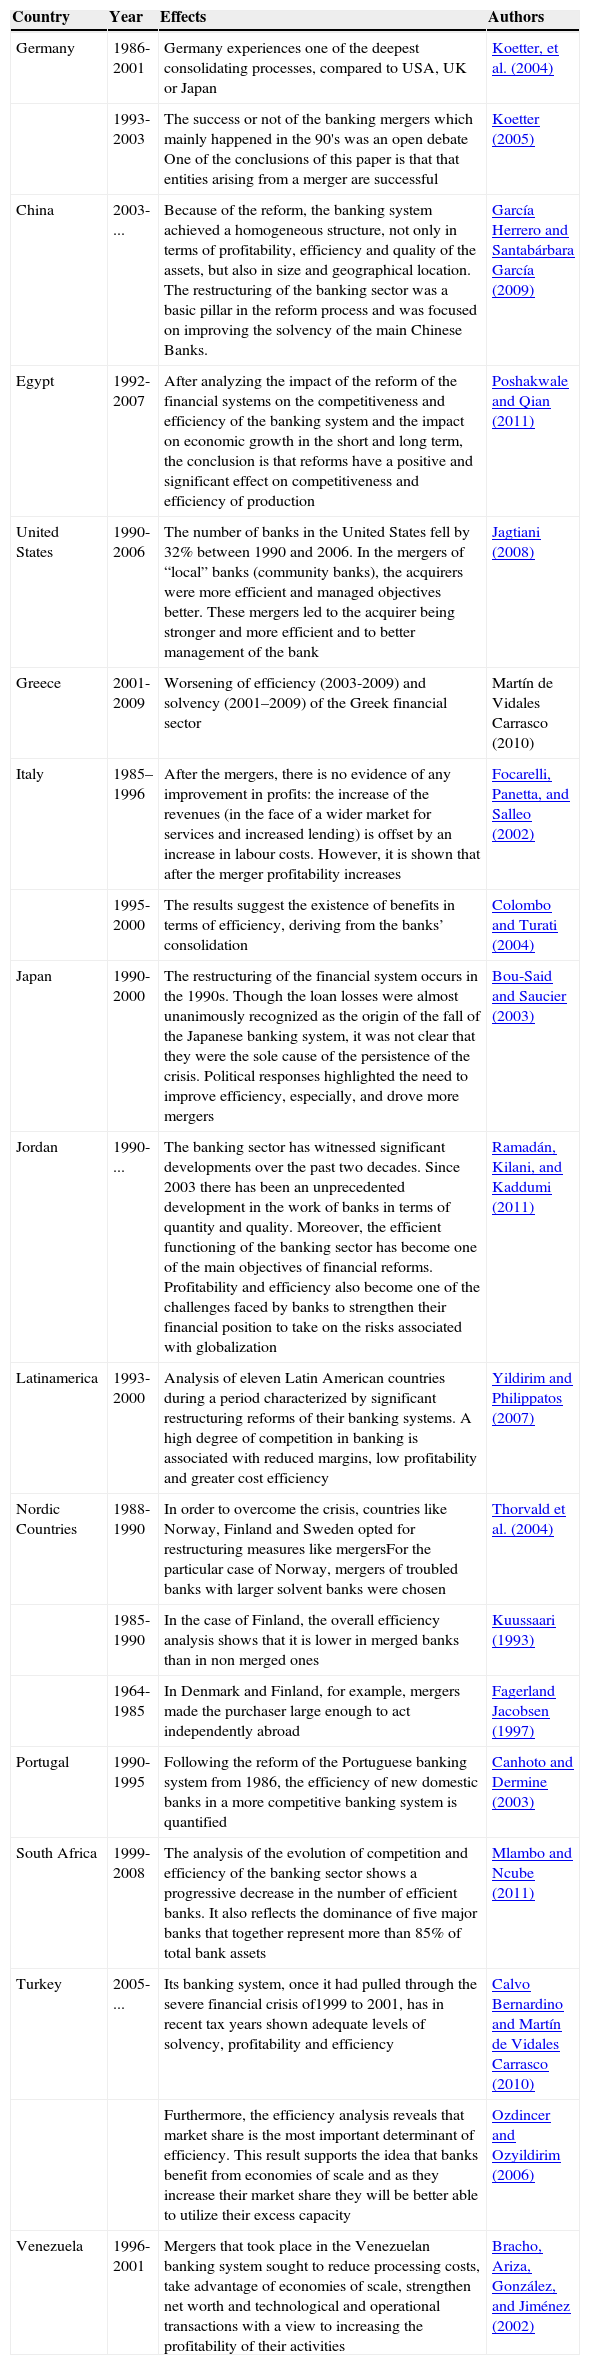
As a result of all this legislation, several steps were taken to restructure the sector, as is shown in Table 2.
Restructuring processof the spanish financial system.
| 2009 | 2010 | 2011 | 2012 | 2013 |
|---|---|---|---|---|
| La Caixa | La Caixa | La Caixa | ||
| CaixaGirona | ||||
| Caja Sol | CajaSol-Guadalajara | |||
| CajaGuadalajara | Caixabank | |||
| Caixabank | ||||
| Banca Civica | ||||
| Caja Navarra | ||||
| Caja Burgos | Banca Civica | |||
| Caja Canarias | ||||
| Banco de Valencia | Banco de Valencia | Banco de Valencia | Banco de Valencia | Banco de Valencia |
| BBVA | BBVA | BBVA | ||
| Caixa Sabadell | ||||
| Caixa Terrasa | Unnim | Unnim | ||
| Caixa de Manlleu | ||||
| Banco Santander | Banco Santander | Banco Santander | Banco Santander | Banco Santander |
| Caja Madrid | ||||
| Bancaja | ||||
| Insular de Canarias | ||||
| Caixa Laietana | BFA-Bankia | BFA-Bankia | BFA-Bankia | BFA-Bankia |
| Caja de Avila | ||||
| Caja Segoviac | ||||
| Caja Rioja | ||||
| Banco Sabadell | Banco Sabadell | |||
| Banco Guipuzcoano | ||||
| Banco Sabadell | Banco Sabadell | Banco Sabadell | ||
| CAM | CAM | |||
| Banco Popular | Banco Popular | Banco Popular | Banco Popular | Banco Popular |
| Banco Pastor | Banco Pastor | Banco Pastor | ||
| Unicaja | Unicaja | Unicaja | ||
| Caja Jaen | ||||
| Unicaja Banco | Unicaja Banco | |||
| Caja Duero | Ceiss | Ceiss | ||
| Caja España | ||||
| Caixa Catalunya | ||||
| Caixa Tarragona | Calaunya Caixa | Calaunya Caixa | Calaunya Caixa | Calaunya Caixa |
| CaixaManresa | ||||
| Caja Galicia | NovaGaliciaB | NovaGaliciaB | NovaGaliciaB | NovaGaliciaB |
| CaixaNova | ||||
| BBK | BBK | |||
| Caja Sur | ||||
| Kutxa Bank | Kutxa Bank | Kutxa Bank | ||
| CajaVital | CajaVital | |||
| Kutxa | Kutxa | |||
| CajaMurcia | ||||
| CaixaPenedes | BancoMareNostrum | BancoMareNostrum | BancoMareNostrum | BancoMareNostrum |
| Caja Granada | ||||
| Sa Nostra | ||||
| IberCaja | IberCaja | IberCaja | ||
| CAI | CAI | IberCaja | IberCaja | |
| Caja Círculo Burgos | Caja Círculo Burgos | Caja3 | ||
| Caja Badajoz | Caja Badajoz | |||
| CajAstur + CCM | CajAstur | |||
| Caja Extremadura | Caja Extremadura | Liberbank | Liberbank | Liberbank |
| Caja Cantabria | Caja Cantabria | |||
| Bankinter | Bankinter | Bankinter | Bankinter | Bankinter |
Without doubt, there will still be changes made in the last column, so it is important to note the content and results of the so-called stress test. The last one made in Spain points to a “clear exit point” from what we have commented on above in terms of future changes.
The stress tests have sought to assess the resilience of the banking system, and banks’ ability to absorb possible shocks related to their credit risks and the market, including the risk arising from investments in sovereign debt. Two macroeconomic scenarios were mainly considered: a reference and an adverse one. The latter will determine the potential need for additional capital.
In Europe, the European Banking Authority (EBA) published the stress tests of the European Union for the years 2010 and 2011 and announced that it would not conduct new stress tests for 2012, with the next stress test for European banks to be in 2014. Nevertheless in Spain, in a clear attempt to be transparent, a series of additional stress test, in addition to the European ones, were made in 2012.
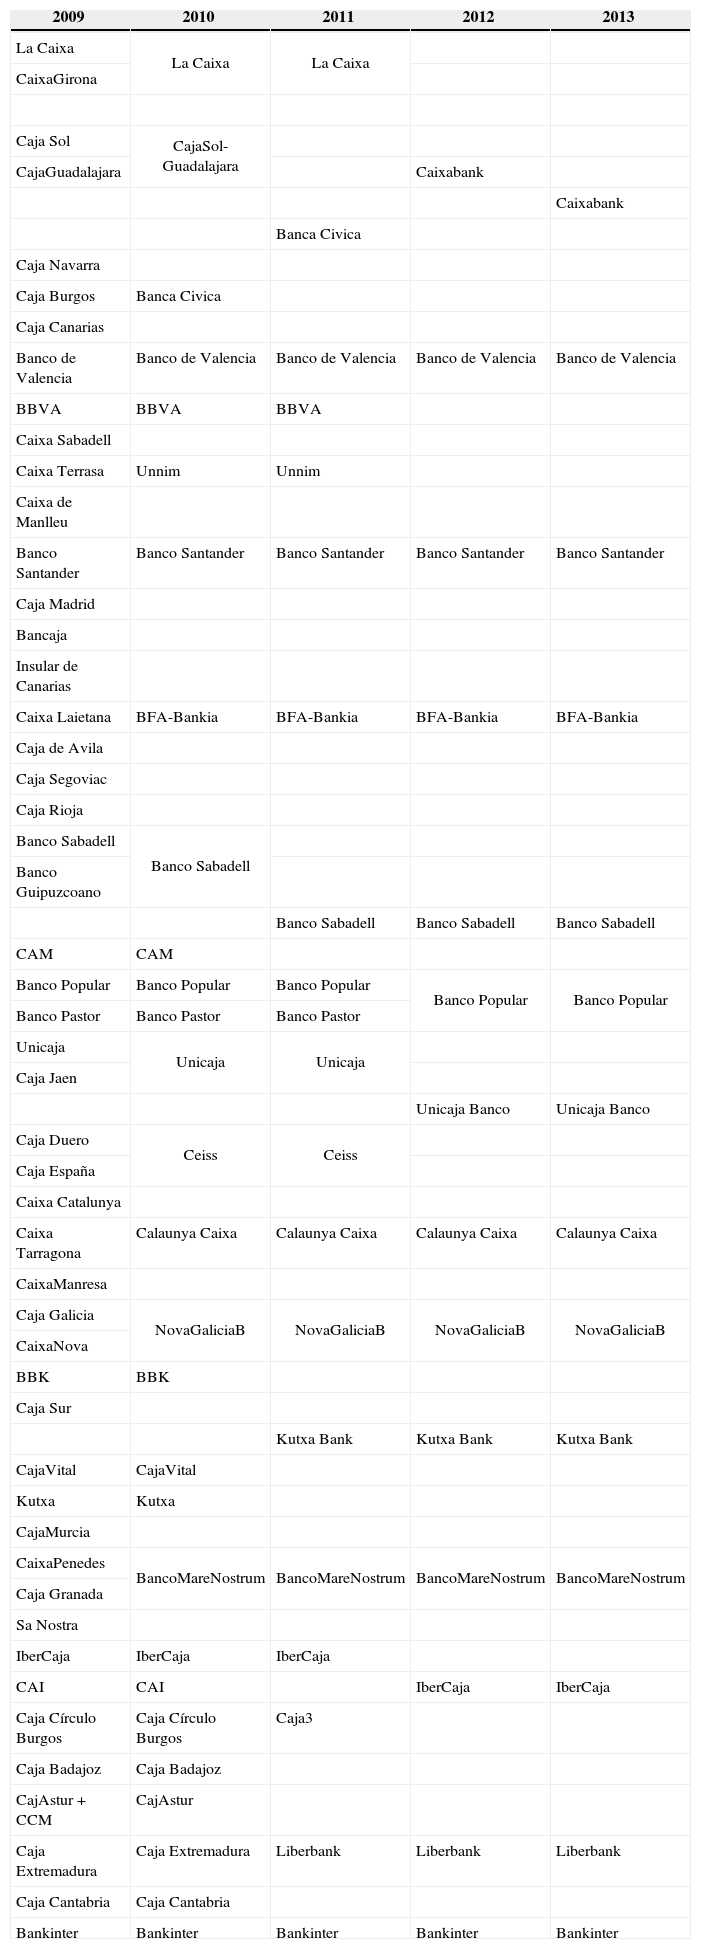
A summary of the stress tests carried out by the Spanish banking sector is presented in Table 3. We show the estimated capital needs for the Spanish banking sector under an adverse scenario.
Stress test on the spanish banking sector.
| Date | Additional Capital in euros | |
|---|---|---|
| June 2010 | 2,042 million (4 savings banks) | EBA |
| June 2011 | 1,247 million (4 savings banks) | EBA |
| 317 million (1 bank) | ||
| June 2012 | 40.000 million | FMI |
| June 2012 | 51,800 million | Roland Berger |
| June 2012 | 51,000-62,000 million | Oliver Wyman |
| Sept. 2012 | 53,755 million | Oliver Wyman |
It is important to note that changes in the methodology, along with others in how results are presented, makes it difficult to compare results.
Sample, variables and methodSampleOur study population comprises the Spanish credit institutions and, within them, the two main types of entities: banks and confederated saving banks. To accurately determine our initial sample (12/31/2008) we use, first, the information provided by the Spanish Banking Association (AEB), from which we selected the top 6 Spanish banks by asset volume. We also took information from the Spanish Confederation of Savings Banks (CECA), which records the existence of 45 savings banks. Therefore, the target population to analyze is set initially at 51 institutions (6 banks and 45 savings banks).
The economic and financial information of the entities that was used to develop the empirical study was taken from the AEB and CECA websites and that concerning the stress test from the website of the Bank of Spain.
Table 4 shows in detail the evolution of the sample by years. We observed how from a total of 51 institutions in 2008 there are just 15 in 2012, because of the restructuring processes, which implied mergers, acquisitions and SIP.
VariablesaDependent variableTaking into account that the main objective of our study is to determine, before and after the restructuring of the Spanish credit institutions, the degree and distinction between efficiency and solvency, our dependent variables are:
- •
Efficiency Ratio (EFIC): this indicator measures which processing costs (salaries, technology, rent, supplies, administrative expenses, etc.) an entity must bear to get a regular unit margin (net financial interests plus mediation commissions). Therefore, an entity will be more efficient if it applies lower processing costs for each unit of gross income generated. The variable is calculated for each entity as Operating Expenses/Gross income. This indicates that the smaller the ratio, the greater the efficiency.
- •
Solvency ratio (SOLV): this shows the ability of the entity to pay debts with its own resources. The variable is calculated for each entity as Equity/Current Liabilities. The higher this ratio, the higher the solvency.
To address the objective, we sought to combine simplicity (given the public financial data available) and clarity with proper intellectual rigor, so we have relied on an explanatory variable and four more control variables:
- 1
Before/After restructuring (RESTR): we created a variable that classifies the sample before and after the restructuring. Given that these restructuring processes began in 2011 (annual accounts filed in 2012), we consider as before the years 2008-2010 and the subsequent ones as after the process.
Thus we have a dichotomous variable (RESTR) which takes the value 0 for the information referred to 2008-2010 (“before restructuring”) and value 1 for the 2011-2012 information (“after restructuring”).
As for the control variables, first we added two variables that must be associated with levels of efficiency and solvency:
- 1.
Stress Test (TEST). According to these tests, the need for additional capital of some entities could be related to our dependent variables, explaining that in more efficient and / or solvent institutions the need for capital requirements will be lower. This feature is shown with a numeric variable. As discussed above, the test included both a reference scenario and an adverse scenario. In order to calculate the Stress Test variable, we considered the adverse scenario for the whole bank (we analyzed banks on a whole. No branches).
- 2.
Tier1 (TIER), will also be analyzed, given that entities with a higher level of own funds must reflect better efficiency and/or solvency ratios. The measure of this characteristic is the percentage of Tier 1.
Finally, we also included as control variables the size of the institutions and whether they are savings banks or banks in order to see if there is a differentiation between the two:
- 1.
Banks or Savings Banks (B_S): Dummy variable that takes the value 1 if it is a Bank and 0 if it is a Savings Bank.
- 2.
Size (SIZE) is measured by the logarithm of the value of assets in millions of euros.
The analysis seeks to answer the question of whether the restructuring process of the banking sector followed the guidelines of efficiency and solvency of the sector. We use a multivariate model that allows us to verify the predictive capability of our previously defined explanatory variable, RESTRit, where each entity is i and year is t:

RESTR: Before or after the restructuring
B_S: Bank or Savings Bank
TEST: Additional capital requirement under the stress test
TIER1: Percentage of Tier1
SIZE: Logarithm of total assets
With this model we analyze the capacity of the explanatory variable to predict two versions of the dependent variable, Xit, the efficiency (EFFICit), defined as the ratio between operating expenses and gross income, and solvency (SOLVit), defined as the ratio between equity and liabilities.
With the above model, we analyze the regression of two versions, depending on whether the dependent variable is efficiency or solvency.
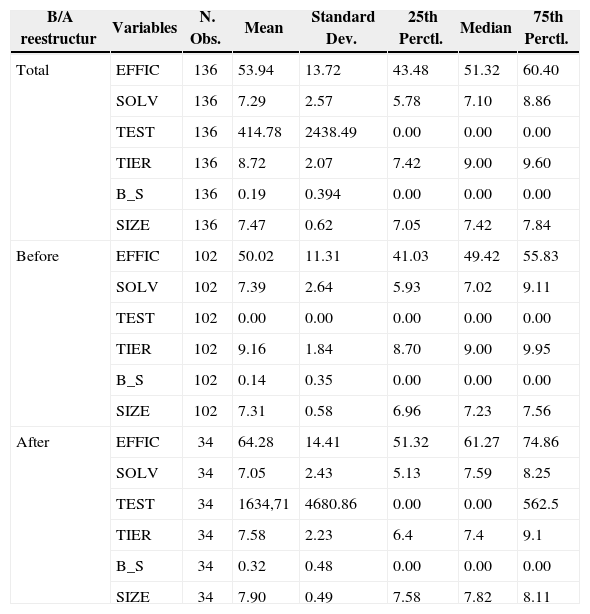
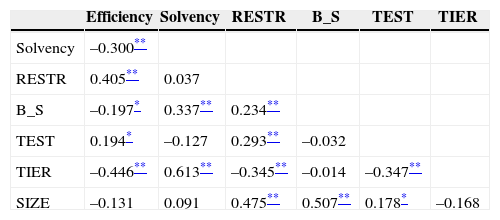
ResultsTable 5 shows the mean, standard deviation and percentiles 25.50 (median) and 75 of the analysed variables. In order to go deeper into the relationship between the variables, we show in Table 6 their correlation coefficients. It is observed how these coefficients could be described as fair values and, therefore, we can state that multicollinearity is not a problem in our models, since the variance inflation factor (VIF) used to ensure that our results are not biased by the correlation between the explanatory variables (Marquardt, 1970) is, in all cases, within acceptable limits (Guajarati, 1997).
Descriptive statistic of the sample divided in: before/after the restructuring.
| B/A reestructur | Variables | N. Obs. | Mean | Standard Dev. | 25th Perctl. | Median | 75th Perctl. |
|---|---|---|---|---|---|---|---|
| Total | EFFIC | 136 | 53.94 | 13.72 | 43.48 | 51.32 | 60.40 |
| SOLV | 136 | 7.29 | 2.57 | 5.78 | 7.10 | 8.86 | |
| TEST | 136 | 414.78 | 2438.49 | 0.00 | 0.00 | 0.00 | |
| TIER | 136 | 8.72 | 2.07 | 7.42 | 9.00 | 9.60 | |
| B_S | 136 | 0.19 | 0.394 | 0.00 | 0.00 | 0.00 | |
| SIZE | 136 | 7.47 | 0.62 | 7.05 | 7.42 | 7.84 | |
| Before | EFFIC | 102 | 50.02 | 11.31 | 41.03 | 49.42 | 55.83 |
| SOLV | 102 | 7.39 | 2.64 | 5.93 | 7.02 | 9.11 | |
| TEST | 102 | 0.00 | 0.00 | 0.00 | 0.00 | 0.00 | |
| TIER | 102 | 9.16 | 1.84 | 8.70 | 9.00 | 9.95 | |
| B_S | 102 | 0.14 | 0.35 | 0.00 | 0.00 | 0.00 | |
| SIZE | 102 | 7.31 | 0.58 | 6.96 | 7.23 | 7.56 | |
| After | EFFIC | 34 | 64.28 | 14.41 | 51.32 | 61.27 | 74.86 |
| SOLV | 34 | 7.05 | 2.43 | 5.13 | 7.59 | 8.25 | |
| TEST | 34 | 1634,71 | 4680.86 | 0.00 | 0.00 | 562.5 | |
| TIER | 34 | 7.58 | 2.23 | 6.4 | 7.4 | 9.1 | |
| B_S | 34 | 0.32 | 0.48 | 0.00 | 0.00 | 0.00 | |
| SIZE | 34 | 7.90 | 0.49 | 7.58 | 7.82 | 8.11 |
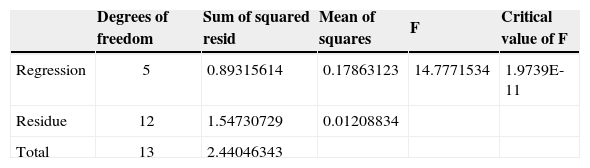
In order to clarify the explanatory model, we show the Granger causality test.
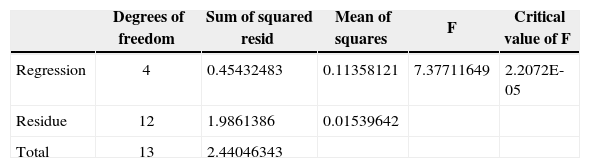
Efficiency:
Variable definition:
- •
Y=EFFIC
- •
X1=RESTR
- •
X2=B_S
- •
X3=TEST
- •
X4=TIER
- •
X5=SIZE

Restricted model (R):


The test is performed by comparing the F statistic, given by:

Fort the analyzed case, we have:

On the other hand, the SSR are shown in the following tables,
Then, by replacing the respective values in equation (3) we obtain:

Therefore, we conclude that restructuring has an statistically significant effect on efficiency according to Granger.
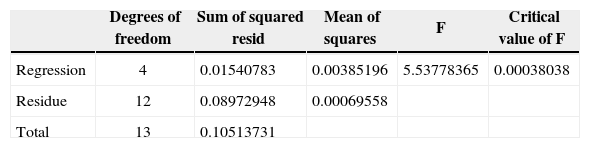
Solvency:
Variable definition:
- •
Y=SOLV
- •
X1=RESTR
- •
X2=B_S
- •
X3=TEST
- •
X4=TIER
- •
X5=SIZE
And about SSR:
Then, by replacing the respective values in equation (3) we obtain:

Therefore, we conclude that restructuring has no effect on solvency according to Granger.
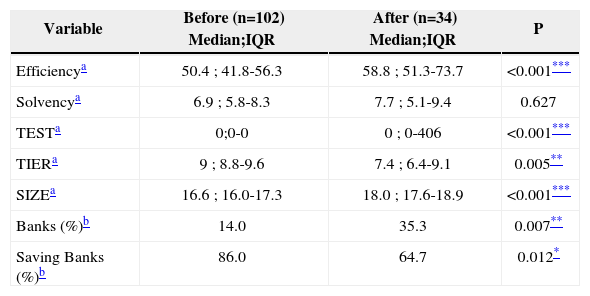
Table 7 provides the mean value of the main variables analyzed. It is calculated according to the RESTR variable. The value of the Mann Whitney and the associated significance level are also given.
Comparison of means.
| Variable | Before (n=102) Median;IQR | After (n=34) Median;IQR | P |
|---|---|---|---|
| Efficiencya | 50.4 ; 41.8-56.3 | 58.8 ; 51.3-73.7 | <0.001*** |
| Solvencya | 6.9 ; 5.8-8.3 | 7.7 ; 5.1-9.4 | 0.627 |
| TESTa | 0;0-0 | 0 ; 0-406 | <0.001*** |
| TIERa | 9 ; 8.8-9.6 | 7.4 ; 6.4-9.1 | 0.005** |
| SIZEa | 16.6 ; 16.0-17.3 | 18.0 ; 17.6-18.9 | <0.001*** |
| Banks (%)b | 14.0 | 35.3 | 0.007** |
| Saving Banks (%)b | 86.0 | 64.7 | 0.012* |
The results show how the two variables present better values on simple average before the restructuring process than later, which is logical at this first stage. These differences are statistically significant for the EFFIC variable.
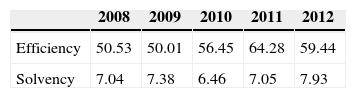
Table 8 shows the evolution of the two variables for the Spanish banking sector during the period 2008-2012. We note that until 2011, the two variables get worse, with efficiency being hit harder, rising from 50.01 in 2009 to 64.28 in 2011. However in 2012 there is a change of trend and both variables begin to improve. In both cases the financial decisions of integration taken could be the explanation.
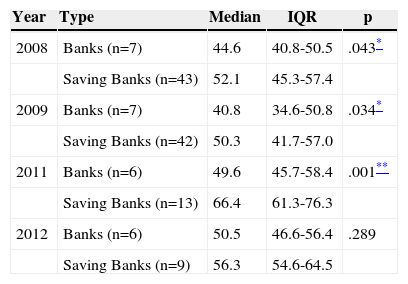
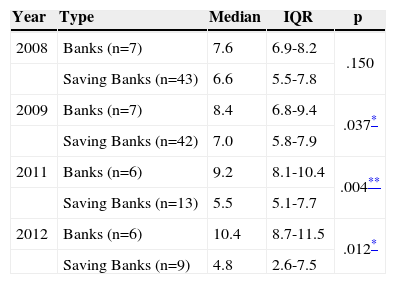
Tables 9 and 10 show the comparison, for each year, of efficiency and solvency for both Banks and Saving Banks. We must take into account that the restructuring process of the banking sector led to the grouping of savings banks in SIP that finally ended in the creation of banks. We must point out that those banks created through SIP among saving banks, were still included in the group of savings banks when presenting the data. This is because they originally came from savings banks and in the analysis period they are still in an initial process of restructuring.
Efficiency. Banks-saving banks (Mann-Whitney U-test).
| Year | Type | Median | IQR | p |
|---|---|---|---|---|
| 2008 | Banks (n=7) | 44.6 | 40.8-50.5 | .043* |
| Saving Banks (n=43) | 52.1 | 45.3-57.4 | ||
| 2009 | Banks (n=7) | 40.8 | 34.6-50.8 | .034* |
| Saving Banks (n=42) | 50.3 | 41.7-57.0 | ||
| 2011 | Banks (n=6) | 49.6 | 45.7-58.4 | .001** |
| Saving Banks (n=13) | 66.4 | 61.3-76.3 | ||
| 2012 | Banks (n=6) | 50.5 | 46.6-56.4 | .289 |
| Saving Banks (n=9) | 56.3 | 54.6-64.5 |
Solvency. Banks-saving banks (Mann-Whitney U-test).
First, we note that the efficiency of banks is better than the savings banks. These differences are statistically significant for the years 2008, 2009 and 2011. Thus, our first research question, about efficiency, confirms as valid those financial policy decisions proposed as more efficient from the economic and financial point of view. That is, the legal transformation of the savings banks, their absorption by the banks and/or their integration to become banks.
Similarly, for solvency, it is observed how the solvency of banks is better than savings banks. These differences are statistically significant for the years 2009, 2011 y 2012. Therefore, the above comments for efficiency would be the same for solvency.
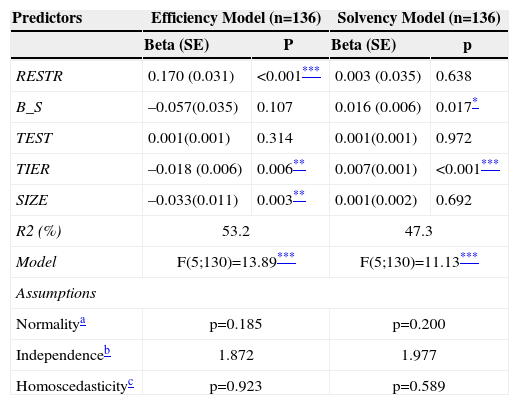
AnalysisTable 11 shows the results of regression models 1 and 2. The results obtained are entirely consistent with what was indicated in the descriptive analysis. For Model 1, where the dependent variable is efficiency, RESTR variable reflects a positive relationship in the coefficient and a statistically significant value. This positive relationship in the coefficients is just confirming that efficiency in the banking sector was, on average, better before the restructuring than later. This would be explained by the fact that the restructuring process which would bear fruit in subsequent years began in 2011. This shows that those with better efficiency and solvency are the ones which must offset the lower values of the rest, which explains the drop in average after the initial restructuring.
Multiple linear regression models, Model 1: EFFIC=βo+β1*RESTR+β2*B_S+β2*TEST+β2*TIERl+β2*SIZE+ε, Model 2: SOLV=β0+p1*RESTR+p2*B_S+β2*TEST+β2*TIERl+β2*SIZE+ε.
| Predictors | Efficiency Model (n=136) | Solvency Model (n=136) | ||
|---|---|---|---|---|
| Beta (SE) | P | Beta (SE) | p | |
| RESTR | 0.170 (0.031) | <0.001*** | 0.003 (0.035) | 0.638 |
| B_S | –0.057(0.035) | 0.107 | 0.016 (0.006) | 0.017* |
| TEST | 0.001(0.001) | 0.314 | 0.001(0.001) | 0.972 |
| TIER | –0.018 (0.006) | 0.006** | 0.007(0.001) | <0.001*** |
| SIZE | –0.033(0.011) | 0.003** | 0.001(0.002) | 0.692 |
| R2 (%) | 53.2 | 47.3 | ||
| Model | F(5;130)=13.89*** | F(5;130)=11.13*** | ||
| Assumptions | ||||
| Normalitya | p=0.185 | p=0.200 | ||
| Independenceb | 1.872 | 1.977 | ||
| Homoscedasticityc | p=0.923 | p=0.589 | ||
Meanwhile, variables SIZE and TIER reflect a negative relationship in the ratio and return statistically significant values. This negative relationship indicates that larger institutions are more efficient than smaller ones. Also, entities with the highest percentage of Tier1 ratio have higher efficiency than those with the lowest percentage of Tier1.
As for model 2, where the dependent variable is solvency, results show that B_S and TIER variables reflect a positive relationship in the ratio and have statistically significant values. These positive relationships indicate that banks have better solvency ratio than savings banks and that those which show the highest percentage of Tier1 have higher solvency ratios.
ConclusionsAs a result of the general economic situation, the Spanish financial system was forced to undertake a restructuring process, which finally began in late 2011 – annual accounts presented in June / July 2012 – and during the years 2012-2013. The existence and disposal of the annual accounts after the application of 2011 and 2012 provides consistency to our study.
This paper, in its main research question and from the public financial data available, confirms that:
- •
Any transformation of savings banks into banks follows a logical criterion of financial policy. Solvency and efficiency values of the Banks are better than those of the savings banks. These differences increase over the period 2008-2012.
- •
These results confirm related previous studies such as Fernández de Guevara (2007); Carbó and Maudos (2010) and Climent (2013).
We confirm that these processes have not been yet fruitful in terms of the values obtained by the Spanish financial institutions in their ratios of efficiency and solvency but no doubt they will in the future, especially considering the legislative decisions taken in late 2011 and throughout 2012, and financial information containing the first financial statements published after restructuring.
Indeed, from the second analysis made, which is justified because of the data-set that it provides, which means we can carry through this investigation in the following years (2013-2016), we can conclude that:
- •
Opposite to the main question, the second one indicates that the efficiency and solvency of banks and savings banks was higher, in global, before the restructuring. This is explained by the short management time to enable improvements in efficiency and solvency. Also, the best entities absorb or integrate those which showed the worst indexes. According to previous studies cited, the improvements in efficiency in the restructuring processes require a clear legal framework; macroeconomic conditions and proper time to manage the new entities. This was started in late 2011 and continued decisively throughout 2012, so this variable will begin to improve results from 2013 and 2014, as was confirmed in previous studies of different countries and financial systems analyzed in this work.
- •
Nevertheless, in one of the new groups an improvement in solvency was observed. This is justified by the strengthening of own resources obtained via Government aid. Thus, it appears that this measure advocated by, among others things, the stress test, is very successful, either through diminished sale of risk, state capitalization or the market. In this regard, further evidence was obtained that the institutions with the highest efficiency are those that do not need additional capital according to the results of the stress test performed.
In short, we can say that these results justify the need for further steady implementation and control of the reform processes in the Spanish banking sector. The experience of previous restructuring processes shows that, although they certainly do require time, it is probably harmful to extend them too much, as this involves uncertainty in the market and the main agents related to these institutions. Therefore, the decisions taken on economic and financial policy which establish deadlines and coercive criteria seem to be correct, because previous literature confirms that restructuring should be done in a decisive and quick way, with regulatory intervention and keeping investors and several other agents in the process informed.
Regarding the future research lines, we understand the need to supervise the future development of both main variables analyzed (profitability and solvency). We would also like to check if, as we understand that it will happen, the evolution of both variables will still be positive and will increase when the restructuring processes come to an end.