


Enteral nutrition (EN) assists in the nutritional status of hospitalised patients unable to feed orally. The aim of this study was to determine which method—continuous EN or discontinuous EN, a diet in which the infusion is discontinued for 4h during the night,—is more effective in meeting nutrient recommendations and improving glycaemic control and biochemical parameters related to protein anabolism.
MethodsPatients were divided into two groups: discontinuous (EN administered in mL/h, 18h/day, 4-h night fasting) and continuous (EN administered in mL/h, 22h/day). All patients with EN receive the diet over a 22-h daily period, in which the diet is suspended for two hours/day for daily hospital routines such as bathing, and physiotherapy, and followed for seven days. Evaluated data: prescribed and administered volume, calories, protein, and fibre; capillary blood glucose; erythrogram; serum albumin.
Results52 patients were followed-up, with 23 (44.2%) in the discontinuous group and 29 (55.8%) in the continuous group. Compared with the continuous group, the discontinuous group received volumes closer to those prescribed, equal or higher calories, and more protein. The capillary glucose values were within the reference range in the discontinuous group, while the continuous group presented elevated values. Both groups presented hypoalbuminaemia, haemoglobin, and haematocrit below the reference values; however, in the discontinuous group, the serum albumin values improved during hospitalisation relative to the continuous.
ConclusionsThe method involving discontinuation of EN for 4h was more effective in meeting nutrient recommendations compared with the continuous method. Additionally, in the discontinuous group, we observed a better control of glycaemia when compared to that of the continuous group.
La nutrición enteral (NE) ayuda en la nutrición de pacientes imposibilitados de alimentarse por vía oral. El objetivo fue determinar si el método discontinuo, en el que suspende la infusión de la nutrición durante 4 h en la noche, es más eficaz que el continuo para atender las recomendaciones de nutrientes, mejora del control glucémico y los parámetros bioquímicos relacionados con el anabolismo proteico.
MétodosLos pacientes fueron divididos en 2 grupos: discontinuo (NE administrada en ml/h, 18h/día, 4 h en ayuno nocturno) y continuo (NE administrada en ml/h, 22h/día). La colecta de datos se inició 72h después de la admisión y continuó durante 7 días. Datos evaluados: volumen prescrito y administrado, calorías, proteínas y fibra; glucemia capilar, eritrograma y albúmina sérica.
ResultadosCincuenta y dos pacientes fueron valorados durante 7 días, 23 (44,2%) en el grupo discontinuo y 29 (55,8%) en el continuo. Comparado con el grupo continuo, el discontinuo recibió volúmenes próximos a los prescritos, calorías iguales o mayores y más proteína. Los valores de la glucemia capilar estuvieron dentro de la referencia en el grupo discontinuo, mientras que en el continuo los valores fueron mayores. Tanto el grupo continuo como el discontinuo presentaron hipoalbuminemia, hemoglobina y hematocrito por debajo de los valores de referencia; entretanto, en el grupo discontinuo, los valores de albúmina sérica mejoraron durante la hospitalización respecto a los del continuo.
ConclusionesEl método discontinuo de NE por 4 h fue más eficaz en el cumplimiento de las recomendaciones de los nutrientes comparado al continuo. Además, se observó un mejor control de la glucemia comparado con la del método continuo.
The immediate initiation of enteral nutrition therapy (ENT) is critical to recovering or improving the patient's nutritional status1 and minimises the catabolic status induced by serious illness,2 as long as the gastrointestinal tract of the patient is physiological and structurally functional.3 The adequate nutritional supply of calories and proteins from EN, is critical for improving the nutritional status of hospitalised patients unable to feed orally,4 but when the supply is diminished, malnutrition can occur, increase the morbimortality rate, and the hospitalisation time.5
Commonly, EN is administered by the continuous method (slow and steady influx of nutrients over 24h) to reduce the risk of diarrhoea2; to decrease the risk of contamination by microorganisms, and to prevent variation in insulin levels under constant glycaemic stimulation.6,7 In cyclic feeding, EN is infused for less than 24h (with a stop of six to eight hours)—as occurs in normal human eating.
It is performed to restore gastric acidity and bacterial colonisation of the stomach and to maintain the cortisol levels associated with circadian rhythms (light/dark).8 Intermittent feeding is usually delivered over 20–60min every 4–6h by infusion pump or by the gravity drip method and may allow for more mobility of the patient.9
Few studies have evaluated different ENT methods, suggesting that the continuous EN method may result in better nitrogen balance and a decrease in the excretion of C-peptide in the urine, compared to the bolus method6; that the intermittent versus the continuous method did not significantly affect glycaemic variability or insulinaemia, and that professionals should not be limited to only one feeding method10; that intermittent (bolus) feeding resembles a typical oral eating pattern by properly stimulating hepatic rhythmicity11; circadian rhythms are observed in the release of hormones and are controlled by light and feeding time, and the energetic expenditure is higher at night and may be affected by the continuous and intermittent feeding methods.12 However, there is still no consensus on which method should be adopted to provide better patient outcomes, as the effects on metabolic parameters seem contradictory.9,13
Along with dietary assessment, biochemical parameters, such as the haemogram and serum albumin (Alb), are frequently used to evaluate the nutritional status of hospitalised patients.14 Reck-de-Jesus et al.15 pointed out that nutrient inadequacy can contribute to anaemia and hypoalbuminaemia, due to the association of haemoglobin (Hb) and Alb in patients with exclusive EN.
We hypothesised that a discontinuous method, with a nightly discontinuation of EN infusion may be more effective compared to the continuous method, because it can be considered closer to the normal physiology of food ingestion by humans and could lead to benefits on nutrient intake and glycaemic control. Therefore, this study's first aim was to determine which of the methods—continuous or discontinuous EN—is more effective in meeting nutrient recommendations and blood biochemical parameters that are closer to the patient's needs. The second aim was to determine which of the methods could improve glycaemic control and biochemical parameters related to protein anabolism.
Materials and methodsStudy design and ethical considerationsThis was a quasi-experimental clinical study, paired by sex and age (register number RBR-5vkzjt, http://www.ensaiosclinicos.gov.br/rg/RBR-5vkzjt/). The study involved hospital patients admitted to the medical clinic unit (with 27 beds), in a public hospital. This study was approved by the Ethics and Research Committee (number 2.103.411). Data collection occurred after written informed consent was obtained from the patients or their guardians.
Inclusion and exclusion criteriaIncluded in this study were patients expected to be hospitalised for at least seven days, with EN administered exclusively by vacuum infusion pump, in a closed system, with the patient conscious or in the company of a responsible person. Patients were excluded if they had generalised oedema, sepsis, or chronic renal failure, or if they were on mechanical ventilation, because these conditions induce metabolic stress and may interfere with anthropometrics, biochemical data, and energy expenditure; if they were receiving comfort measures only, if they were receiving parenteral or oral feeding combined with ENT, if they were discharged from the hospital, transferred to other clinics, or if they died before re-evaluation after seven days.
Experimental design52 patients were followed. Data collection began within 72h of a patient's admission to infirmary of the medical clinic and followed for seven days. According to the hospital protocol, all patients with EN receive the diet over a 22-h daily period, in infusion pump, in which the diet is suspended for 2h/day (in the morning) for daily hospital routines such as bathing, physiotherapy, and speech therapy. Under these circumstances, this period is not accounted for in calculating the patients’ nutritional needs. Therefore, the study patients were divided into two groups: the discontinuous group (DG) had 23 patients, exclusive EN was administered in mL/h for a cycle of 18h/day, and the patients were submitted to four consecutive hours of night fasting (from midnight until 04:00); the continuous group (CG) had 29 patients, and EN was administered in mL/h for a cycle of 22h/day, without night fasting.
Dietary assessmentThe patients’ nutritional needs were estimated and prescribed by the nutritionist according to established hospital protocols. To evaluate nutritional status, the standard formulas, according to the nutritional need of the patients and the illnesses, with caloric density between 1.0 and 2.0kcal/mL were used according to the nutritional diagnosis, from 30 to 35kcal/kg of current weight for undernourished patients; from 25 to 30kcal/kg of current weight for eutrophic patients; 25kcal/kg of current weight for overweight patients; and 20–25kcal/kg of adjusted weight for obese patients. The protein quantity offered varied from 0.8 to 2.0g/kg of current weight, according to the hospital protocol for each diagnosis. In both groups, the patients started at the goal rate within 72h.
During the seven-day follow-up, medical record reviews were undertaken to collect the following data: demographic data, energy needs (kcal/kg of weight/d); protein needs (PTN/kg of weight/d); and the nutritional prescription, such as route of access, diet type, caloric density, infusion volume, total caloric content of the diet, and dietary protein (total PTN/day).
The daily administered volume and the diet type were verified by the researcher through the patient electronic record, in order to verify the received energy quantity (kcal/kg of weight/day; kcal/day) and protein quantity (PTN/kg of weight/day; total PTN/day), intercurrences due to the enteral diet, such as gastrointestinal (nausea, vomiting, constipation, diarrhoea), mechanical (patient-started probe, patient-traced probe, bottle-open probe, clogged probe, infusion pump problem, gastrostomy diet leak, and other tube-related occurrences), and examinations and procedures (diet turned off for gastrostomy, diet paused to perform exams).
Percentages of volume adequacy,16 energy adequacy and protein adequacy17 were calculated, and the values were considered satisfactory when above 80%.18 The fibre contents were calculated by age and gender according to the infused diet type and compared to the dietary reference intakes, which comprise the adequate intake—AI.19 None of the patients received additional sources or supplementation of calories, protein, or fibre—only those prescribed by enteral nutrition.
Biochemical and anthropometric evaluationLaboratory values, including Hb, haematocrit (Ht), C-reactive protein (CRP), and Alb, were monitored by biochemical analysis according to the medical protocol. Capillary glucose was monitored according to the medical prescription, being performed every four, six or eight hours/day. The quantification of glucose was taken during the seven-day follow-up. Blood glucose levels were presented according to the following periods of the day: morning (6a.m. until 12p.m.) afternoon (12p.m. until 6p.m.), night (6p.m. until 12a.m.) and dawn (12a.m. until 6a.m.). The male and female reference values used were: >13 and >12g/dL for Hb and 40–54% and 37–47% for Ht, respectively20; <0.5mg/dL for CRP21; and >3.5g/dL for Alb.22 Hyperglycaemia in hospitalised patients (adults and elderly) was defined as glucose levels >140mg/dL and hypoglycaemia as blood glucose <70mg/dL.23
As the majority of patients were bedridden and unable to stand, weight (kg) and height (m) were estimated by the criteria of Chumlea et al.24 Circumferences and knee height, which are found in the formulas, were tape measured, while the subscapular skinfold (SSF) was gauged with the aid of a scientific adipometer CescorfTM and performed in triplicate. Body mass index (BMI, kg/m2) was calculated, and classification was based on the WHO25 criteria for adults and the Lipschitz26 criteria for the elderly. These parameters were evaluated only at baseline.
Statistical analysisThe sample size calculation considered the number of hospitalisations per month (average of eight patients per month and 11-month follow-up), in which a 95% confidence level and 5% margin of error were used, indicating 72 patients using ENT. Statistical analysis was performed by calculating average values daily until the seventh day of follow-up for each patient. The biochemical analyses (Hb, Ht, CRP, and Alb) were obtained on the day of admission and at the seventh day of hospitalisation. Capillary glucose was monitored daily during the different periods of the day (morning, afternoon, night and dawn).
Data are expressed as mean±standard deviation and relative frequency. Statistic 10 software (Copyright © Stat Soft. Inc., Tulsa, OK, USA) was used for descriptive analysis, t-tests for each group independently, Mann–Whitney, repeat measures ANOVA, followed by post hoc Duncan's multiple range test, or Fisher Chi-square test, according to data distribution. Statistical significance was set at p<0.05.
ResultsOf the 74 patients receiving exclusive EN, 22 were excluded because they progressed to an oral diet in less than seven days (n=10) or were transferred to other units (n=5), discharged from the hospital (n=5), or died (n=5). Therefore, 52 patients remained in seven-day follow up, 23 (44.2%) from the DG and 29 (55.8%) from the CG.
Table 1 shows the demographic data and the per group admission of patients to medical clinics. In both groups most patients were male, declared white, with average patient ages of 51.6±20.2 years in the DG and 55.2±14.5 years in the CG. Most patients were admitted to the neurological clinic in the DG (70%) and the CG (41%); however, these data were not statistically significant (p=0.08). In addition, energy and protein requirements showed no statistical differences between groups (p>0.05).
Clinical characteristics and hospitalisation of patients with exclusive enteral nutrition in the discontinuous and continuous groups.
| Patient characteristics | Discontinuous group (n=23) | Continuous group (n=29) | p-Value |
|---|---|---|---|
| Gender (n, %) | |||
| Female | 07 (30) | 08 (28) | 0.82b |
| Male | 16 (70) | 21 (72) | |
| Age, y (mean, SD) | 51.6±20.2 | 55.2±14.5 | 0.44a |
| Ethnicity (n, %) | |||
| White | 20 (87) | 26 (90) | 0.76b |
| Non-white | 03 (13) | 03 (10) | |
| BMI, kg/m2(mean, SD) | |||
| Adults | 20.7±3.5 (n=13) | 21.2±6.9 (n=17) | 0.82a |
| Elderly | 21.2±4.0 (n=10) | 23.9±5.4 (n=12) | 0.21a |
| Requirements | |||
| Calories/day | 28.5±5.3 | 29.1±3.5 | 0.59a |
| Protein/day | 1.5±0.20 | 1.4±0.12 | 0.54a |
| Medical clinic (n, %) | |||
| Neurology | 16 (70) | 12 (41) | 0.08b |
| Internal medicine | 02 (9) | 09 (31) | |
| Other clinics | 05 (21) | 08 (28) | |
| Biochemical values base lines (mean, SD) | |||
| Hb, g/dL | 10.2±1.9 | 9.7±1.6 | 0.41a |
| Ht, % | 31.6±5.3 | 30.5±4.9 | 0.56a |
| CRP, mg/dL | 5.9±4.7 | 9.7±6.7 | 0.12a |
| Alb, g/dL | 2.2±0.5 | 2.1±0.6 | 0.16a |
| Capillary glucose, mg/dL | 126.3±53.6 | 140.7±56.3 | 0.20a |
Alb=albumin; BMI=body mass index; CRP=C-reactive protein; Hb=haemoglobin; Ht=haematocrit.
Values are presented as No. (%) or mean±SD.
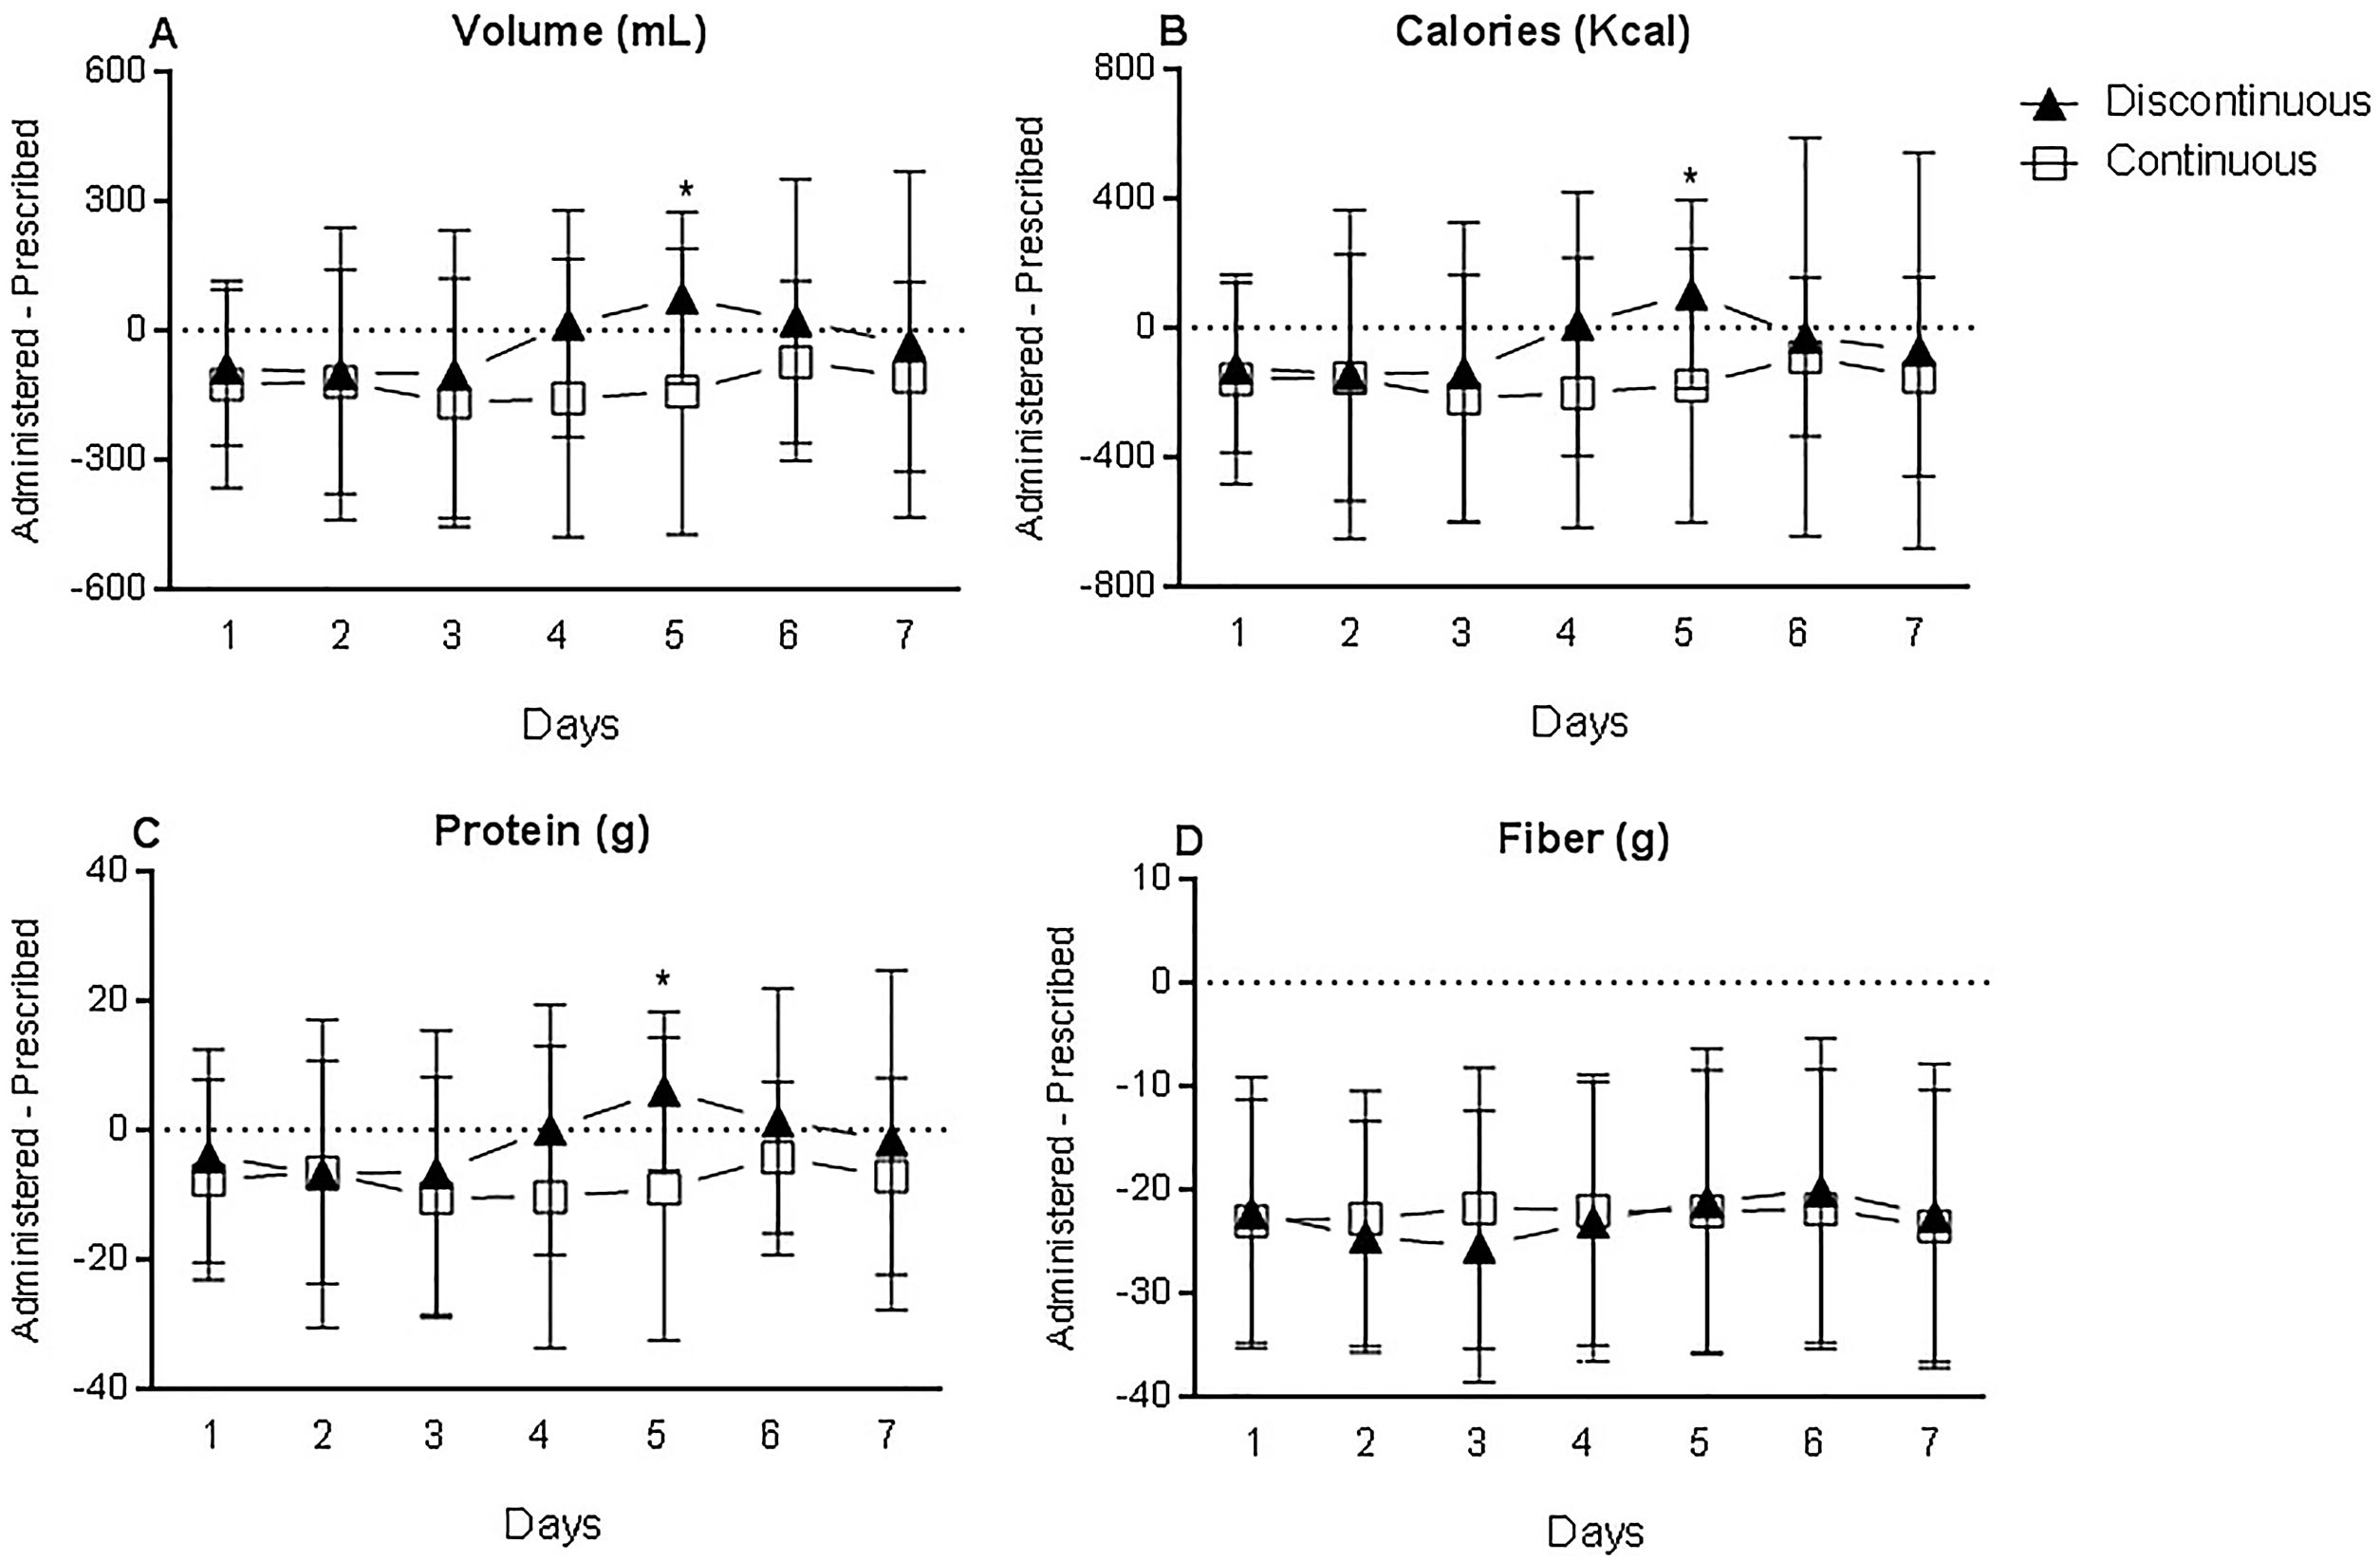
During the seven-day follow-up, it was observed that the DG received a volume closer to the prescribed volume when compared with the CG, and the difference was statistically significant at day five (p=0.02), as shown in Fig. 1A. The difference between the administered and prescribed calories was also significantly smaller in the DG than in the CG at day five (p=0.04), as shown in Fig. 1B. Thus, the CG received a lower volume and fewer calories relative to the prescription, and the DG received a volume and calories closer to the prescription, during most of the follow-up (Table S1).
 volume (mL/d), (B) energy (kcal/d), (C) protein (g/d), and (D) fibre (g/d) between the discontinuous and continuous groups during the seven-day follow-up. Repeated Measures ANOVA. *p<0.05.")
The DG received slightly more protein relative to the CG, with significant differences at day five (p=0.017) after admission (Fig. 1C and Table S1). Protein administration in the CG was below that prescribed, while in the DG, the administered amount was closer to the prescribed amount. However, in both groups, the adequacies of average volume (DG=97.7%; CG=89.3%), calories (DG=97.1%; CG=90.0%), and protein (DG=98.1%; CG=90.4%) during the seven-day follow-up were satisfactory (Table S2), with adequacy values greater than 80%.18 A comparison of the fibre amount administered to the DG and CG (Fig. 1D) showed that both groups received quantities below the recommended AI, with no statistically significant difference between the groups.
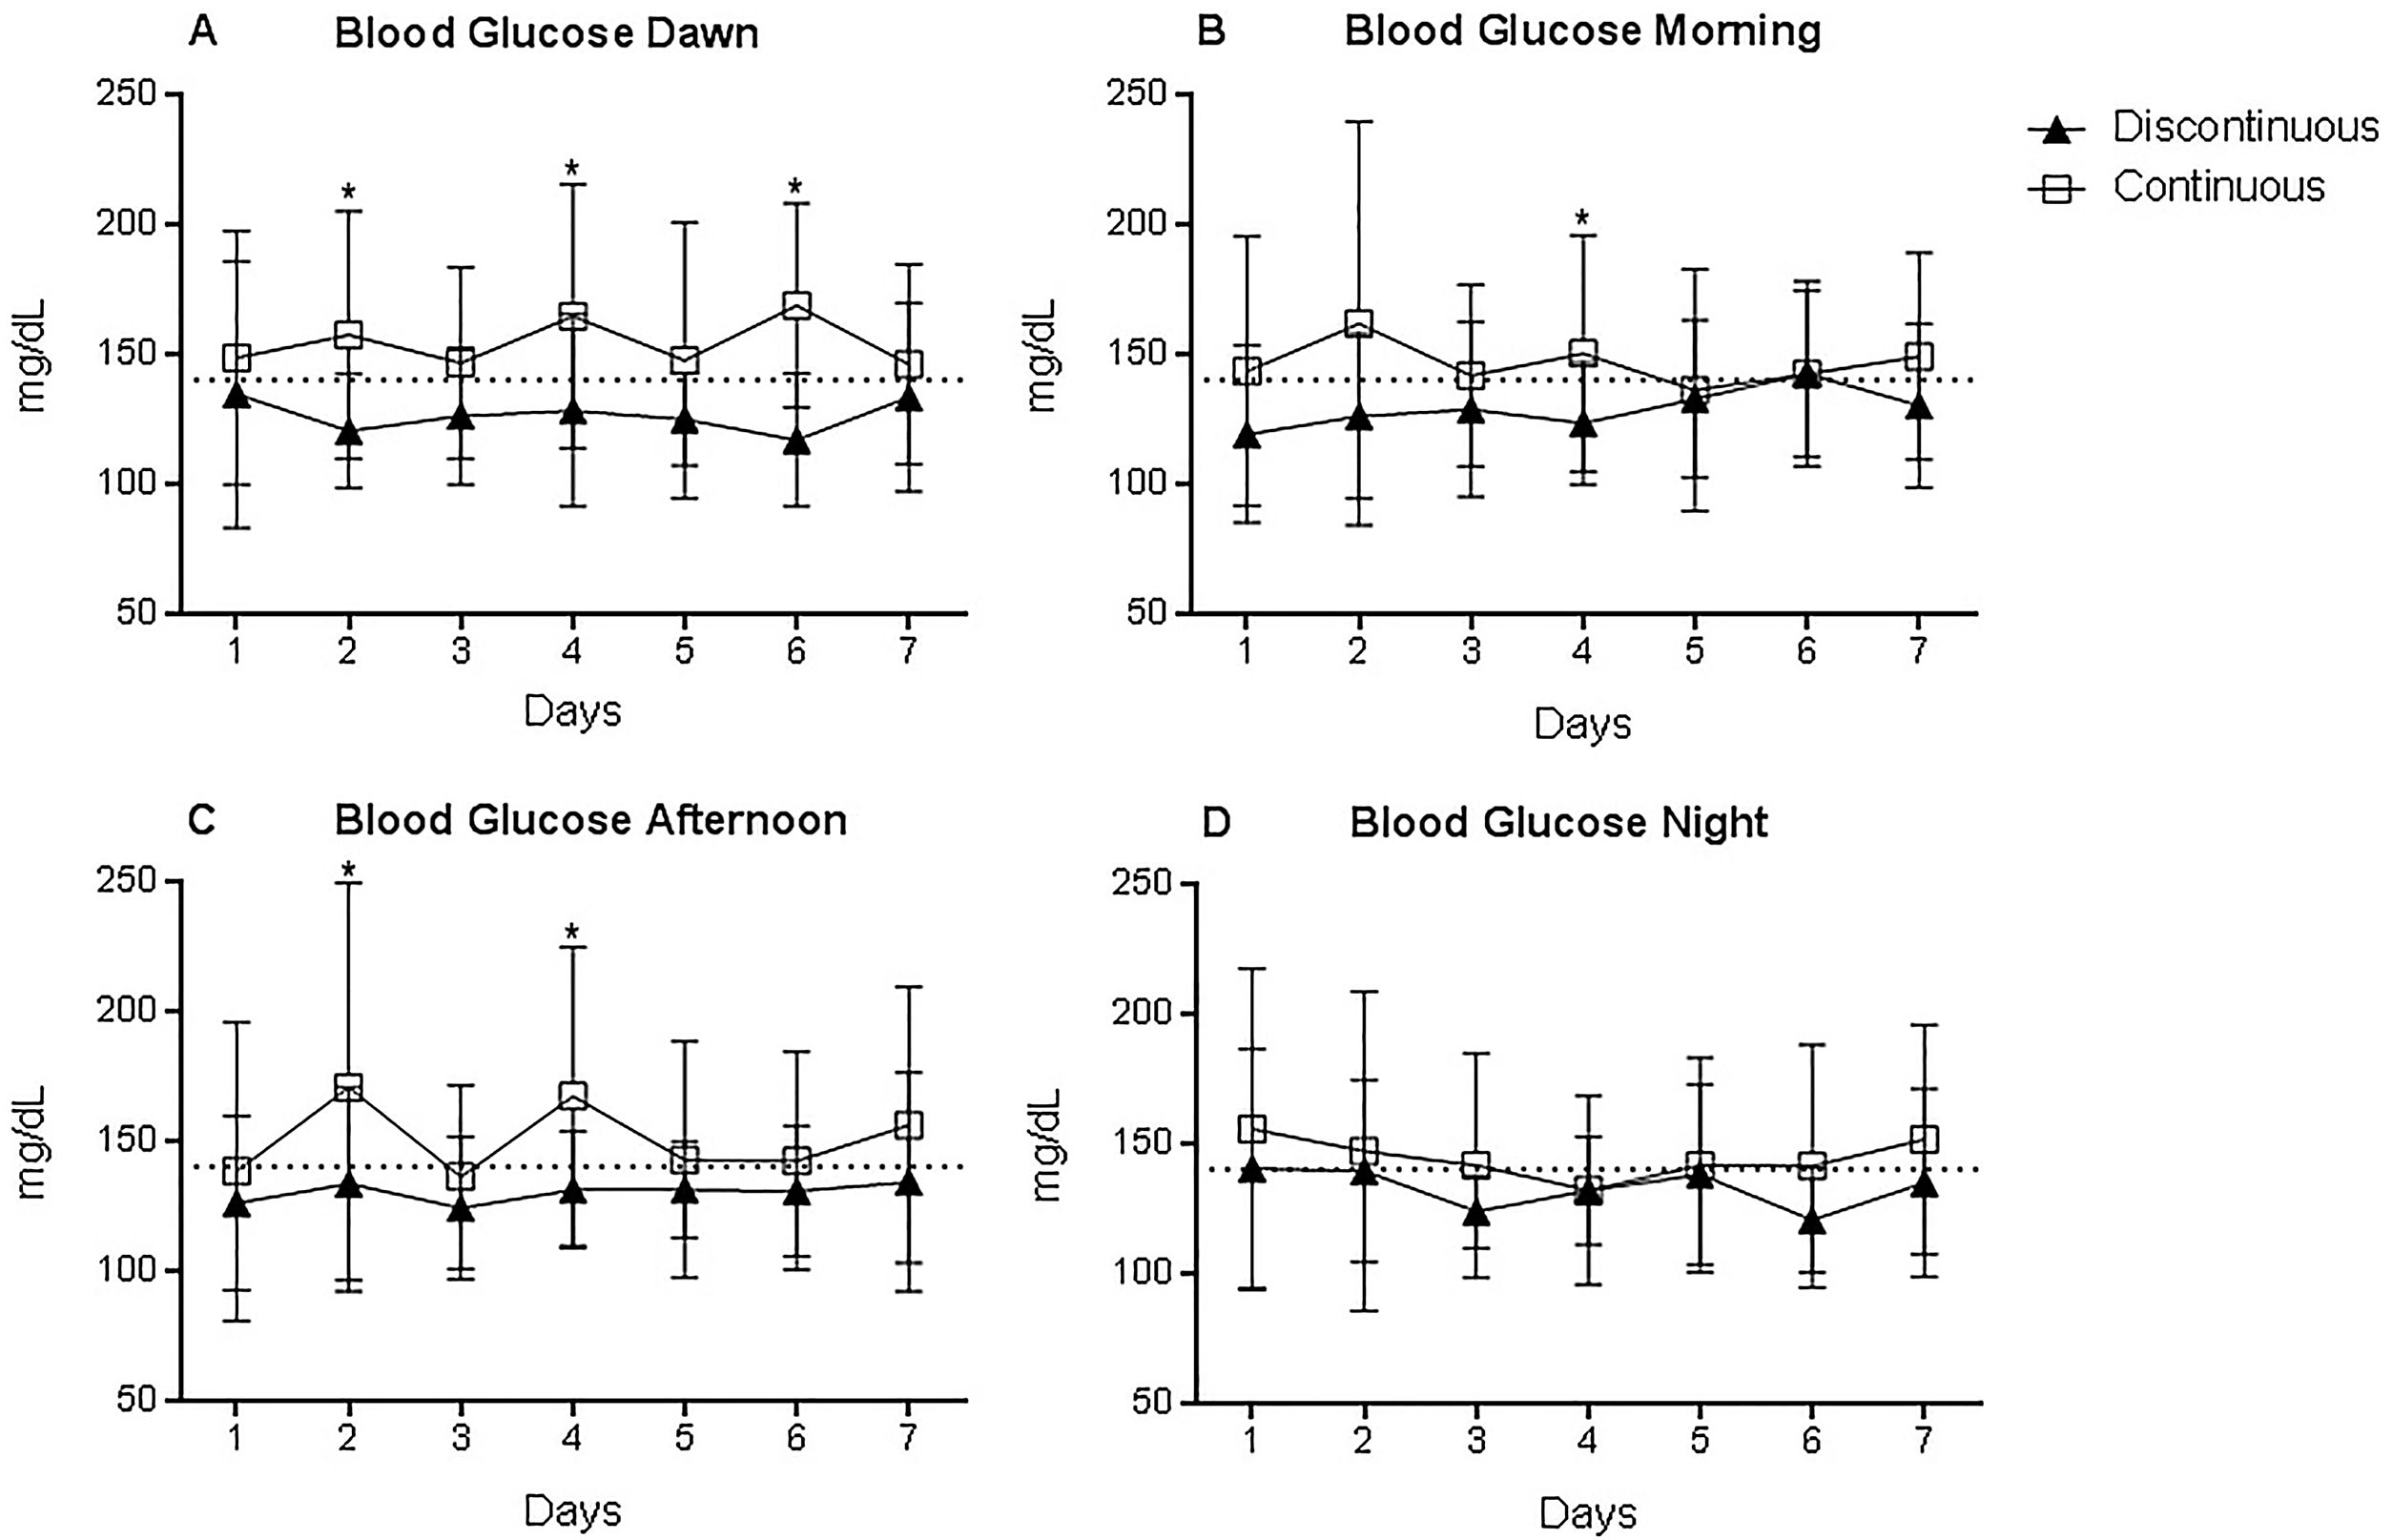
Capillary glucose (Fig. 2) in the DG was in the normal range for hospitalised patients (<140mg/dL), according SBD23 and ADA,27 during the evaluation period, whereas the CG had an average glucose level above the reference range, indicating interaction between time and DG and CG groups (F=1.83; p=0.013). During the dawn period (Fig. 2A), when the patients in the DG were not receiving any nutrition, they had lower capillary glucose than those in the CG, with a significant difference on day two (p=0.032), day four (p=0.002), and day six (p<0.001). During the morning period (Fig. 2B), a significant difference in the glucose levels between the CG and DG groups was observed on day four (p=0.017). During the afternoon (Fig. 2C) on day two (p=0.03), and day four (p=0.003). At night (Fig. 2D), no significant differences were observed.
 Dawn, (B) Morning, (C) Afternoon, (D) Night. Two-way ANOVA indicated a significant main effect of time vs groups F (6, 557.6)=1.83; p=0.013.")
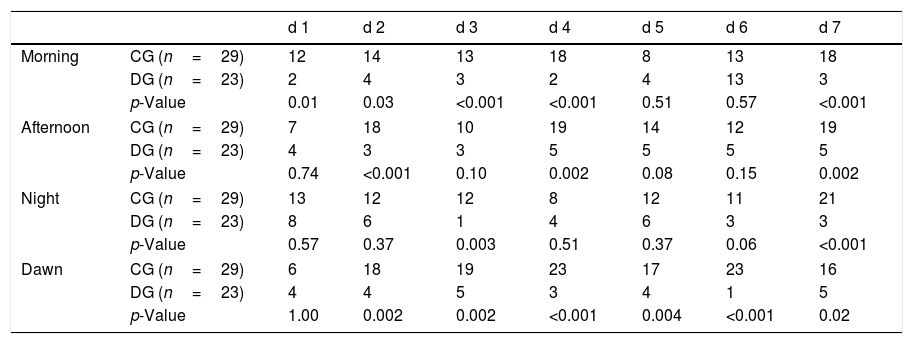
No hypoglycaemia was observed in patients in either group during the study period. However, hyperglycaemic events were more frequently observed in the CG, when compared to DG group (statistically higher values were observed in the CG in the morning: day one (p=0.01), day two (p=0.03) and days three, four and seven (p<0.001); afternoon day two (p<0.001) and days four and seven (p=0.002); night: day three (p=0.003) and day seven (p<0.001); and dawn only day one showed no statistical differences between groups (p>0.05), according to Fisher's exact test (Table 2).
Number of hyperglycaemic events in the discontinuous and continuous groups during the 7-d follow-up.
| d 1 | d 2 | d 3 | d 4 | d 5 | d 6 | d 7 | ||
|---|---|---|---|---|---|---|---|---|
| Morning | CG (n=29) | 12 | 14 | 13 | 18 | 8 | 13 | 18 |
| DG (n=23) | 2 | 4 | 3 | 2 | 4 | 13 | 3 | |
| p-Value | 0.01 | 0.03 | <0.001 | <0.001 | 0.51 | 0.57 | <0.001 | |
| Afternoon | CG (n=29) | 7 | 18 | 10 | 19 | 14 | 12 | 19 |
| DG (n=23) | 4 | 3 | 3 | 5 | 5 | 5 | 5 | |
| p-Value | 0.74 | <0.001 | 0.10 | 0.002 | 0.08 | 0.15 | 0.002 | |
| Night | CG (n=29) | 13 | 12 | 12 | 8 | 12 | 11 | 21 |
| DG (n=23) | 8 | 6 | 1 | 4 | 6 | 3 | 3 | |
| p-Value | 0.57 | 0.37 | 0.003 | 0.51 | 0.37 | 0.06 | <0.001 | |
| Dawn | CG (n=29) | 6 | 18 | 19 | 23 | 17 | 23 | 16 |
| DG (n=23) | 4 | 4 | 5 | 3 | 4 | 1 | 5 | |
| p-Value | 1.00 | 0.002 | 0.002 | <0.001 | 0.004 | <0.001 | 0.02 | |
CG=continuous group; DG=discontinuous group. Number of hyperglycaemic events (>140mg/dL, according to SBD – 2019 and ADA – 2020). Fisher's exact test.
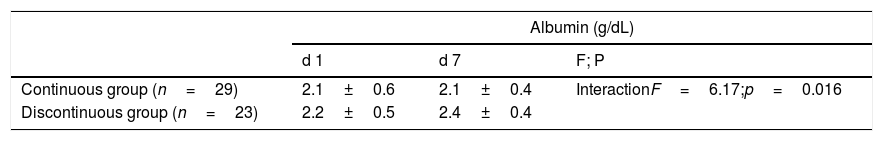
When the Alb levels were compared with the reference level of >3.5g/dL,22 both groups presented hypoalbuminaemia. Interaction between time and DG and CG groups was observed (F=6.17; p=0.016), as shown in Table 3. Both groups had average Hb and Ht values below the reference values on admission [DG (Hb=10.2±1.9g/dL; Ht=31.6±5.3%) and CG (Hb=9.7g/dL±1.6; Ht=30.5±4.9%)], and they remained low during the hospitalisation. When the patients’ haemograms were examined, the difference between Hb values indicated the main effect of time, independently of the groups (F=4.16; p=0.047), there was a tendency of values to increase after seven days of hospitalisation in comparison with the day of admission. Analysis of Ht revealed a similar tendency, but the main effect of time was not significant (F=3.18; p=0.08), as indicated in Table 3. The CRP decreased in both groups (CG; CRP2−CRP1=−3.7±3.5mg/dL) and in DG (CRP2−CRP1=−2.1±4.1mg/dL); however, the main effect of time was not significant (F=1.41; p=0.24) (data not shown).
Albumin, haemoglobin and haematocrit distribution in the discontinuous and continuous groups during the seven-day follow-up.
| Albumin (g/dL) | |||
|---|---|---|---|
| d 1 | d 7 | F; P | |
| Continuous group (n=29) | 2.1±0.6 | 2.1±0.4 | InteractionF=6.17;p=0.016 |
| Discontinuous group (n=23) | 2.2±0.5 | 2.4±0.4 | |
| Haemoglobin (g/dL) | |||
|---|---|---|---|
| Continuous group (n=29) | 9.7±1.6 | 9.8±1.6 | Time effectF=4.16;p=0.047 |
| Discontinuous group (n=23) | 10.2±1.9 | 10.6±1.5 | |
| Haematocrit (%) | |||
|---|---|---|---|
| Continuous group (n=29) | 30.5±4.9 | 31.1±5.2 | Time effectF=3.18;p=0.08 |
| Discontinuous group (n=23) | 31.6±5.3 | 32.7±4.5 | |
Data are expressed as means±SD. (Repeated measures-ANOVA).
In the DG group, 17 patients received EN by nasoenteric tube and six by gastrostomy; in the CG group, 23 patients received EN by nasoenteric tube and six by gastrostomy. The number of patients with intercurrences is also indicated during the seven-day follow-up in the continuous and discontinuous groups (Table S3). The comparison by Mann–Whitney Test revealed no significant differences between the groups (U values varied from 289 to 326 and p values from 0.41 to 0.89).
Open-tube probe, tube replacement, and tube control X-ray were the most common procedures during the follow-up in both groups (Table S4). The high occurrence of tube replacement and tube control X-ray was due to tube removal by the patient.
Besides the most common complications observed in both groups, the DG had four episodes of gastrostomy diet leak. In the CG, the most observed intercurrence was the pause of the diet for the performance of exams; this was higher than in the DG. Regarding medications, antibiotics were used in six and 10 DG and CG patients, respectively, and antibacterial agents in five patients of the CG. This might have been associated with the number of gastrointestinal complications observed in the CG, and their absence in the DG.
DiscussionIn the present investigation we observed that the discontinuous EN was more effective in meeting nutrient recommendations and closer to the patient's needs. This factor may have been attributed to the higher intake volume in the discontinuous EN group and fewer intercurrences in this group compared to the continuous EN group. In addition, the overall data about glucose levels indicated a beneficial effect of 4h of EN discontinuation in relation to the continuous infusion group. The results suggested that even a small period of EN discontinuation can have some positive metabolic effects in patients receiving EN. The data also indicate that additional studies are needed to clarify if longer periods of EN discontinuation (for instance, eight or 12h) can produce better results.
The beneficial effects of discontinuation in EN may be related to the circadian rhythmicity in the general metabolism, which is dictated by the 24-h light–dark clock cycles and have an impact on metabolism.28,29 In humans, the highest glucose tolerance occurs in the morning, whereas in the evening the opposite is observed.30 Insulin secretion is critical in the control of the daily rate of glucose tolerance in mammals. Of importance for circadian regulation of carbohydrate metabolism, insulin secretion exhibits regular oscillations during the day, and together with other hormones secreted rhythmically, regulates the body metabolism.31 In the present study, lower glucose levels during the night were observed in the group with EN discontinuation for a period of 4h. These results may have been influenced by the circadian metabolic responses. Fonken et al.32 indicated that exposure to light at night can influence the circadian system and metabolism in mice. Thus, continuous enteral nutrition, indicated by the CG, may be associated with higher blood glucose levels during the night, associated with circadian disruption.
Generally, the average capillary glucose in the DG was lower and had fewer oscillations and hyperglycaemic events in comparison with the CG. Many studies have shown benefits of nightly fasting on patients’ glycaemic indexes. Saito, Nishimura, and Kato33,34 concluded in their studies that circadian rhythms can only be kept normal when the enteral diet infusion is diurnal by the cyclic method, and the continuous or nocturnal feeding method is associated with increased glucose intolerance. Also, Simon, Brandenberg, and Follenius35 observed that subjects who received continuous EN had an increase in plasma glucose levels during time sleeping. Better adaptation of glycaemia with night fasting compared to the continuous method may result in values closer to normal. These results may help in reducing inflammatory processes and improving the prognosis of hospitalised patients.36 In both groups, patients received much lower amounts of fibre than required, mainly because the enteral diets administered were fibre-free.
Although most patients were admitted with anaemia and hypoalbuminaemia, the haemogram improved in both groups during the hospitalisation, and serum albumin especially in the DG patients. Studies report that continuous feeding decreases skeletal muscle synthesis, and intermittent (bolus) feeding could provide synthesis because of greater hormonal oscillations, mainly insulin.8 A limiting factor of our study was that plasma insulin levels were not analysed—data that could clarify these findings.
The longer time of dietary pause for examination and the gastrointestinal complications seen in the CG versus the DG may be linked to the severity of cases. Additionally, the dietary gastrostomy leakage noticed in four patients of the DG might have occurred due to a greater volume infused in the DG than in the CG. However, no significant differences were observed between groups during the seven-day follow-up. Some studies report that the continuous nutrient method may alter normal intestinal physiology and is associated with side effects and increased tube obstruction.10 Nasiri et al.37 in a randomised controlled triple-blind study in ICU patients, concluded that the bolus method can still be used as a standard method to decrease the risk of EN intolerance if used properly. This disruption frequently occurs in hospital practice, resulting in an enteral diet that falls short of the patient's needs, thereby compromising the nutritional state of these patients.
In our study, there were some limitations. The first was the small number of patients included. The second limitation was the lack of monitoring of serum insulin levels and units of insulin needed to maintain glycaemic control. This would help to analyse whether the lower glucoses in the DG compared with the CG could have been influenced by the insulin oscillations caused by feeding interruptions. Also, the short evaluation time (seven days) may have been insufficient to demonstrate more significant differences in some biochemical parameters, such as albumin levels. To better evaluate the effect of discontinuation of the ENT infusion, a significantly longer monitoring time is needed.
ConclusionThe results presented here support the beneficial effects of 4h of EN discontinuation in relation to the group receiving EN continuously, providing greater nutrient administration, and when the biochemical endpoint considered was glycaemia. We also observed a very modest effect of EN discontinuation in plasma albumin levels, which can be related to the changes observed in glycaemia. However, additional studies with longer than 4h of EN discontinuation will be needed to validate our findings.
Authors’ contributionsAG, EC, ARM and LDS contributed equally to the conception of the research; AG and EC contributed equally to the design of the research; AG, SRJ, BA, and JF contributed to the acquisition of the data; AG, JBTR, and EC contributed to the interpretation and analysis of the data; and AG and EC drafted the manuscript. All authors critically revised the manuscript, agree to be fully accountable for ensuring the integrity and accuracy of the work, and read and approved the final manuscript.
FundingThis research received no specific grant from any funding agency in the public, commercial, or not-for-profit sectors.
Conflict of interestThe authors declare that there is no conflict of interest.
We are thankful for the opportunity and support given to us by the multidisciplinary team at Hospital Universitário de Santa Maria.
The following are the supplementary data to this article:
