


Weight gain and changes in body composition are associated with the onset of diabetes after kidney transplantation, and detailing these changes can help prevent this situation. The study aimed to assess the prevalence of diabetes mellitus after kidney transplantation and changes in the nutritional status and body composition in patients with diabetes one year from surgery.
Materials and methodsThis survey was a single-center, prospective cohort study. Twenty-nine patients over 18 years old who underwent isolated kidney transplantation, without diabetes, were included and followed up for one year. At hospital discharge after transplantation and one year later, anthropometric (weight, height and abdominal circumference), body composition (electrical bioimpedance), routine biochemical and dietary intake assessments were performed.
ResultsMost of the patients were male (75%), and the mean age was 48.0±11.8 years old. In the first-year post-surgery 27.6% of patients had DM and the diagnosis was made, on average, 4 months after transplantation. The group with diabetes had, from the beginning to the end of the study, greater weight and body fat, especially abdominal fat. The non-diabetic group, after one year, showed an increase in phase angle, body weight and body masses, more pronounced of fat-free mass, when compared with fat mass gain.
ConclusionsBoth groups showed weight gain, but in the non-diabetic group these changes can be interpreted as an improvement in the nutritional profile. Metabolic abnormalities associated with immunosuppression and eating habits, combination that maintains increased the risk for diabetes for long time, keeping this group with priority in nutritional care.
El aumento de peso y los cambios en la composición corporal se asocian a la aparición de diabetes tras el trasplante renal, por lo que detallar estos cambios puede ayudar a prevenir esta situación. El objetivo del estudio fue evaluar la prevalencia de diabetes mellitus tras el trasplante renal y los cambios en el estado nutricional y la composición corporal en pacientes con diabetes un año después de la cirugía.
Materiales y métodosSe trató de un estudio de cohortes prospectivo y unicéntrico. Se incluyeron 29 pacientes mayores de 18 años sometidos a trasplante renal aislado, sin diabetes, a los que se realizó un seguimiento durante un año. Al alta hospitalaria tras el trasplante y un año después, se realizaron evaluaciones antropométricas (peso, talla y perímetro abdominal), de composición corporal (bioimpedancia eléctrica), bioquímicas rutinarias y de ingesta dietética.
ResultadosLa mayoría de los pacientes eran varones (75%), y la edad media era de 48,0±11,8 años. En el primer año postoperatorio, el 27,6% de los pacientes presentaba DM y el diagnóstico se realizó, de media, 4 meses después del trasplante. El grupo con diabetes presentó, desde el inicio hasta el final del estudio, mayor peso y grasa corporal, especialmente grasa abdominal. El grupo no diabético, después de un año, mostró un aumento del ángulo de fase, del peso y de la masa corporal, más pronunciado de la masa libre de grasa, en comparación con el aumento de la masa grasa.
ConclusionesAmbos grupos presentaron aumento de peso, pero en el grupo no diabético estos cambios pueden interpretarse como una mejoría en el perfil nutricional. Las alteraciones metabólicas asociadas a la inmunosupresión y a los hábitos alimentarios, combinación que mantiene aumentado el riesgo de diabetes durante largo tiempo, mantienen a este grupo con prioridad en el cuidado nutricional.
Kidney transplantation (KT) is the best treatment option for patients with end-stage renal disease (ESRD) due to the improvement of the quality of life. It reduces the mortality risk for the majority of patients when compared with dialysis.1 It is well known that patient and graft survival is influenced by several variables, such as graft rejections, infections, and metabolic disorders, all related to the recipients and transplant characteristics.2 Diabetes is a common and vital complication following kidney transplantation. Post-transplantation diabetes mellitus (PTDM) describes the presence of diabetes after transplantation, irrespective of the timing of diagnosis or whether it was present but undetected before transplantation.3 The term is previously known as new-onset diabetes after transplantation (NODAT), can be defined as persistent hyperglycemia after 30 days of transplantation, and excludes patients with pretransplant diabetes that was undiagnosed as post-transplant hyperglycemia that resolves by the time of discharge.4 It is well known that kidney transplant recipients gain significant weight during the first year after KT.5 This weight gain may contribute to the development of PTDM, cardiovascular diseases, and other comorbidities, leading to less favorable graft outcomes in these individuals.6
Studies for PTDM reported rates ranging from 14% to 20% in the first year post-transplantation.7–9 PTDM results from predisposing factors (similar to type 2 diabetes mellitus), such as old age and obesity,10 but also as a result of specific post-transplant risk factors as the immunosuppressive drugs used in this population like glucocorticoids, calcineurin inhibitors, and mammalian target of rapamycin (mTOR) inhibitors.10–12 The present study aimed to assess the prevalence of diabetes mellitus after KT and changes in the nutritional status and body composition profile in patients who developed diabetes one year after KT surgery.
Material and methodsThis survey was a single-center, prospective cohort study. All patients over 18 years old who underwent isolated kidney transplantation were included consecutively for 14 months, unless they had diabetes before transplant, had a neoplasia diagnosis, hepatic cirrhosis, or had some amputated member. Patients with severe infections who needed hospital admission for more than 30 days were not included. The study was reviewed and approved by the local Ethics Committee, in accordance with the ethical standards on human experimentation and with the Helsinki Declaration of 1975, as revised in 2000.
The patients were evaluated after surgery, when renal function stabilized and the patient was discharged, free of acute infections (T0), and one year after (T1). It was considered impaired fasting glucose (IFG) blood glucose values between 100 and 125mg/dL. Patients who remained with IFG for 30 days were submitted to the oral glucose tolerance test (OGTT) and were considered diabetic when presented, after 2h, OGTT glucose level ≥200mg/dL or fasting glucose ≥126mg/dL on more than one occasion or classic symptoms of hyperglycemia and random plasma glucose ≥200mg/dL.4 Glomerular filtration rate (GFR) was calculated with CKD-EPI Creatinine Equation (2009). Anthropometric measurements such as weight, height, and waist circumference were taken and the body mass index (BMI) was calculated. The body composition assessment was performed using multifrequency bioelectrical impedance – spectroscopy (BIS – Fresenius Medical Care® Body Composition Monitor equipment) for quantification of phase angle, fat and fat-free masses and calculation of mass indices. The 24-hour recall13 was applied to evaluate energy and macronutrients intake and all calculations were performed using the DietWin Professional system.
Data were expressed as percentages, mean and standard deviation. For the comparison between times in each group and between groups, a linear model with mixed effects was used to analyze variables. To compare the groups at a single moment, an ANOVA-oneway analysis with Tuckey's post-test was performed. The Student's t-test was performed for independent samples, with a 95% confidence interval of the difference between groups. Their respective p (p<0.05) with a 95% confidence interval were calculated for all these analyses. The statistical software used was the R Core Team (2016) and SAS Statistical Software (version 9.3; SAS Institute, Inc. Cary, NC).
ResultsInitially, thirty-two patients were included in our analysis; however, three had impaired glucose tolerance and were excluded; therefore, 29 patients without diabetes were studied. In the study group the majority were male (75%), and the mean age was 48.0±11.8 years old, ranging from 23 to 72 years. The most prevalent etiology of CKD was systemic arterial hypertension. No female patient had a history of gestational diabetes mellitus. The mean time to onset of graft function was 9.16±10.8 days, and the time from hospital discharge to the first assessment was 14.5±7.22 days. Before KT, hemodialysis was the most prevalent therapy (90.6%), and the mean dialysis treatment time was 56.6±33.3 months. Five patients had undergone a previous kidney transplant, but none became diabetic. Most of the 29 patients received the graft from deceased donors. Of the 29 patients studied, 8 (27.6%) developed diabetes (PTDM) with a mean time to diagnosis of 4.12±3.59 months. The remaining 21 patients (72.4%), remained diabetes-free up to 1 year after (ND).
When comparing the groups PTDM and ND, the mean fasting glucose levels in the first week after transplantation were not statistically different (99.2±27.9mg/dL and 78.4±17.9mg/dL, respectively). Among the other variables analyzed, age, time on dialysis, length of stay, the onset of graft function, cold ischemia time, age of the donor, and time from discharge to first evaluation, no differences were observed between groups. In induction immunosuppression, rabbit thymoglobulin (r-ATG) was the most used agent in most patients (93.7%), and the other patients, basiliximab. The triple regimen was used in maintenance immunosuppression: prednisone, mycophenolate, and tacrolimus.
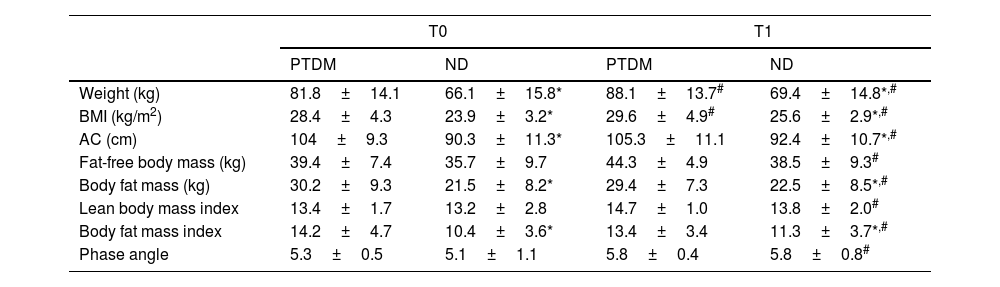
Table 1 shows the results regarding anthropometric and body composition measurements. It was observed that weight, BMI, and abdominal circumference (AC) were already higher at baseline (T0) in PTDM, when compared to ND. After one year (T1) there was an increase in these three variables in both groups, maintaining the baseline differences. The mean weight gain was 8.6% in the PTDM group and 4.5% in the ND.
Anthropometric and body composition data for groups at T0 (baseline) and T1 (one year after transplantation).
| T0 | T1 | |||
|---|---|---|---|---|
| PTDM | ND | PTDM | ND | |
| Weight (kg) | 81.8±14.1 | 66.1±15.8* | 88.1±13.7# | 69.4±14.8*,# |
| BMI (kg/m2) | 28.4±4.3 | 23.9±3.2* | 29.6±4.9# | 25.6±2.9*,# |
| AC (cm) | 104±9.3 | 90.3±11.3* | 105.3±11.1 | 92.4±10.7*,# |
| Fat-free body mass (kg) | 39.4±7.4 | 35.7±9.7 | 44.3±4.9 | 38.5±9.3# |
| Body fat mass (kg) | 30.2±9.3 | 21.5±8.2* | 29.4±7.3 | 22.5±8.5*,# |
| Lean body mass index | 13.4±1.7 | 13.2±2.8 | 14.7±1.0 | 13.8±2.0# |
| Body fat mass index | 14.2±4.7 | 10.4±3.6* | 13.4±3.4 | 11.3±3.7*,# |
| Phase angle | 5.3±0.5 | 5.1±1.1 | 5.8±0.4 | 5.8±0.8# |
PTDM: patients with diabetes after one year of transplant; ND: patients without diabetes; BMI: body mass index; AC: abdominal circumference.
For body composition data, the patients in the PTDM group had significantly higher values of FT (fat mass) and fat mass index (FMI) at baseline when compared to the ND group, and these differences remained so after one year. Searching for changes after one year, the PTDM group did not show changes in body masses or phase angle (PA), meanwhile the ND group showed a significant increase in PA and all body masses and indices at T1 (Table 1). For the ND group these increases were 4.7% in fat mass and 8.5% in fat-free mass. According to the BMI classification, in the PTDM group there was an increase in the number of patients with obesity from T0 to T1, from 63 to 83%. ND group showed an increase in patients with overweight (from 30% to 47%) and a reduction of obesity, from 45% to 26%.
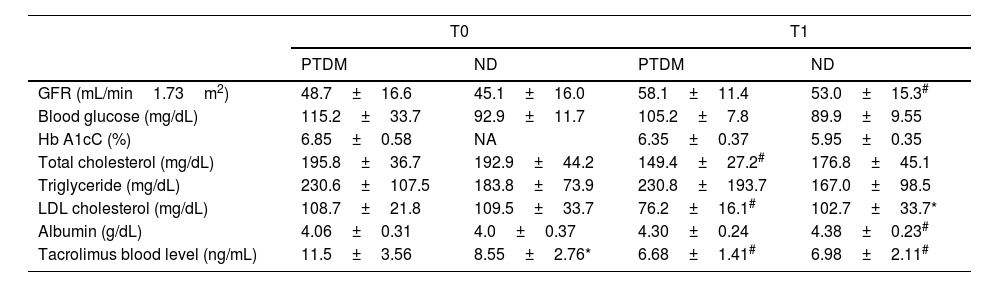
Table 2 shows the biochemical data evaluated and the estimated GFR for the groups and evaluation times. No differences were observed for glycemia and HbA1c, but regarding lipid control, only the PTDM group showed a substantial reduction in total cholesterol and LDL from T0 to T1. In cases of PTDM, at T1, 23% of patients used lipid-lowering drugs, while in the ND group, 15%. Triglyceride levels were not different between groups in both assessments. There was no statistical difference in albumin between groups. Albumin showed an improvement in T1 in the ND group and in the PTDM group there was no change between the evaluations, furthermore values were maintained within the normal range. Tacrolimus dosage was significantly reduced from T0 to T1 in both groups. At baseline, patients with PTDM had higher tacrolimus levels than those in the ND group, but at T1 there was no difference between groups.
Biochemical data for groups at T0 (baseline) and T1 (one year after transplantation).
| T0 | T1 | |||
|---|---|---|---|---|
| PTDM | ND | PTDM | ND | |
| GFR (mL/min1.73m2) | 48.7±16.6 | 45.1±16.0 | 58.1±11.4 | 53.0±15.3# |
| Blood glucose (mg/dL) | 115.2±33.7 | 92.9±11.7 | 105.2±7.8 | 89.9±9.55 |
| Hb A1cC (%) | 6.85±0.58 | NA | 6.35±0.37 | 5.95±0.35 |
| Total cholesterol (mg/dL) | 195.8±36.7 | 192.9±44.2 | 149.4±27.2# | 176.8±45.1 |
| Triglyceride (mg/dL) | 230.6±107.5 | 183.8±73.9 | 230.8±193.7 | 167.0±98.5 |
| LDL cholesterol (mg/dL) | 108.7±21.8 | 109.5±33.7 | 76.2±16.1# | 102.7±33.7* |
| Albumin (g/dL) | 4.06±0.31 | 4.0±0.37 | 4.30±0.24 | 4.38±0.23# |
| Tacrolimus blood level (ng/mL) | 11.5±3.56 | 8.55±2.76* | 6.68±1.41# | 6.98±2.11# |
PTDM: patients with diabetes after one year of transplant; ND: patients without diabetes; NA: not available; GFR: glomerular filtration rate; Hb A1cC: glycosylated hemoglobin.
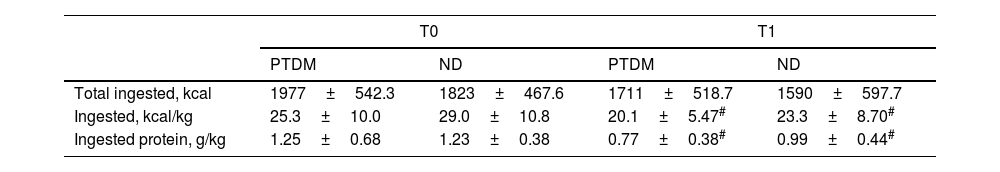
Dietary intake analysis showed that total energy intake was not different between groups and did not change after one year, but mean energy and protein intake, per kilogram of body weight, was significantly lower at T1 for both groups, but without differences between them. The mean decrease in energy intake was approximately 20% in both groups, and protein intake/kg body weight was lower by 40% in the PTDM and 20% in the ND group. Intake of other macronutrients was not different for groups and between times. As a percentage of the total energy value, the intake of fat and carbohydrates was within the recommended range and showed no significant changes in the post-KT period (Table 3).
Food intake data for groups at T0 (baseline) and T1 (one year after transplantation).
| T0 | T1 | |||
|---|---|---|---|---|
| PTDM | ND | PTDM | ND | |
| Total ingested, kcal | 1977±542.3 | 1823±467.6 | 1711±518.7 | 1590±597.7 |
| Ingested, kcal/kg | 25.3±10.0 | 29.0±10.8 | 20.1±5.47# | 23.3±8.70# |
| Ingested protein, g/kg | 1.25±0.68 | 1.23±0.38 | 0.77±0.38# | 0.99±0.44# |
PTDM: patients with diabetes after one year of transplant; ND: patients without diabetes.
The results show that 27.6% of patients had diabetes at the end of one year after transplantation, and that the average time to onset of the disease was 4 months. Some modifiable and non-modifiable risk factors have been related to the development of PTDM, such as age, ethnicity, personal history, gender, family history of DM, time of cold ischemia, immunosuppressive drugs, and weight gain.9,14,15 The patient's age can be an independent risk factor for developing PTDM.16 The mean age of patients evaluated in our study is within the range of increased risk. The association between corticosteroids and PTDM is well established, but currently, prescribed doses of corticosteroids are low, and many studies have not found an association with PTDM.17,18 However, tacrolimus is associated with impaired glucose metabolism by inhibiting insulin secretion and probably precipitating the development of PTDM in some cases.9,18 Some authors have shown that a blood level above 15ng/mL of tacrolimus during the first month after transplantation was associated with developing PTDM.19,20 From the first month, blood levels of tacrolimus decreased and became equal between groups. In the present study, serum levels of tacrolimus were in the range of 5–10ng/mL, not as high as the levels found by other authors.19,20
In a retrospective study with 420 patients, 70 (16.6%) developed PTDM in the first year after KT.20 In another study with 125 patients, PTDM was identified in 24.8% of the patients in the first year post-KT.21 Studies suggest that the family history of DM plays an important role in its development in the general population, and the risk may persist in transplant patients,16 but we did not find this association.
The increase in body weight and fat mass had greater relevance as a risk factor for developing PTDM, as the results showed weight gain in all patients after one year of surgery, but weight gain was more intense in the PTDM group. Results showed more body fat, total and abdominal, in the PTDM group at the first assessment, and this difference was maintained at T1. The ND group showed a small but significant increase in fat mass after 1 year, althought at baseline the group had 30% less IMG. At T1 the ND group showed changes in body masses in addition to weight gain: there was a more pronounced increase in fat-free mass (8.5%) than the increase in fat mass (4.7%), in addition to the improvement in phase angle. Although the numbers showing an increase in fat-free mass in the PTDM group at T1, this change was not significant.
Post-transplant weight gain is frequently reported in the literature due to the improvement in the previous uremic condition after the transplant.22 Obesity is a risk factor for the development of PTDM, as also observed in the present study.15,20 Larger abdominal circumference (AC), as fat mass, are risk factors that may be associated with the development of PTDM.9,22–24 The results showed that patients who developed PTDM had higher AC and FM percentage than ND patients, who did not develop diabetes.
The prevalence of lipid abnormalities after kidney transplantation is high and is influenced by genetic predisposition, immunosuppressive drugs, diuretics, beta-blockers, obesity, insulin resistance, proteinuria, and impaired renal function.25 In the present study, the patients were using medications to control LDL cholesterol, making it difficult to analyze its impact on the appearance of PTDM in that first year.
Albumin values were within the normal range in all patients during the evaluations. In a situation of clinical stability, albumin may be a marker of nutritional status,26 and an increase in serum albumin levels may indicate an improvement in nutritional status due to better appetite, recovery of renal function, end of dietary restrictions, and use of medications that increases food intake.24,27 Studies show that patients, after kidney transplantation increase their protein and energy intake in the first six months and then maintain consumption stabilized for up to one year after transplantation, within the recommended ranges (30kcal/kg weight/day; 0.8–1g/kg/day).27,28 In this study, between assessments, patients reported an energy and protein intakes significant lower from T0 to T1, below the recommended levels. There was also no difference in the protein-calorie intake of patients who developed PTDM compared to those in the ND group. These results do not explain the weight gain shown by the two groups, but as the assessment of food intake was performed using 24-hour recalls, a widely used tool in clinical practice, probable dietary underreporting cannot be ruled out.
We can mention limitations. The sample size of transplant patients studied in the period was small but in a prospective follow-up. Especially the sample size of the PTDM group was small and this may have limited the observation of statistical differences in the comparison between the groups. The statistics done allow us to find associations between nutritional and clinical variables with the development of diabetes, but do not allow inferences about causal reasons. Another limitation is the lack of information on patients’ level of physical activity, a factor directly related to changes in body composition.
In this study it was observed that 27.6% of patients undergoing kidney transplantation had DM one year after the procedure, and the diagnosis of diabetes was made, on average, four months after surgery. Factors linked to the transplant, such as type of donor, TIF, and immunosuppression scheme, were not different beetween groups. The group that developed diabetes had, from the beginning and at the end of the follow-up, greater weight and body fat, especially in the abdominal region. The non-diabetic group, after one year, showed changes that can be interpreted as an improvement in the nutritional profile, with an increase in phase angle, body weight and body masses, more pronounced of fat-free mass; when compared with fat mass gain. Despite a certain improvement in body composition profile, it is known that the new metabolic abnormalities are common in the long term, associated with immunosuppression and eating habits, combination that maintains the risk for diabetes increased for long time, keeping this group in nutritional care priority.
Conflict of interestNone declared.
