


This study aimed to assess the validity and reliability of a self-administered screening questionnaire to detect deficiencies in the health habits of the adult population of the Canary Islands (Spain).
DesignThe questionnaire initially included 30 items based on previous questionnaires and following the recommendations of the World Health Organization about healthy and unhealthy diet, screen time, physical activity, and sleep habits. It also included a section related to hygiene due to the importance that hygienic habits have in people's health.
SettingThe questionnaire was self-administered online.
ParticipantsData was collected from 401 participants from the Canary Islands (age range: 18–73 years) who volunteered to fill in the questionnaire online.
ResultsThe questionnaire revealed adequate overall reliability indexes (Cronbach's α>.70, Mcdonald's ω>.70), and construct validity. Hierarchical linear regression analysis revealed age, sex, and income to be significantly (p<.05) related to adults’ health lifestyle habits in our population, sex and age explaining the majority of the variance. However, education and incomes were found non-significant (p>.05) when education was introduced into the model. Those results pointed out that older people and women show healthier lifestyle habits.
ConclusionThe questionnaire proved to be a brief, reliable, and valid tool to assess health lifestyle habits in adults in the Canary Islands. Furthermore, results pointed out that in future intervention studies with children, variables such as adults’ sex, age, and, to a lesser extent, monthly income should be taken into consideration.
Este estudio tiene como objetivo evaluar la validez y fiabilidad de un cuestionario de cribado autoadministrado para detectar deficiencias en los hábitos de salud de la población adulta de Canarias (España).
DiseñoEl cuestionario incluía inicialmente 30 ítems basados en cuestionarios existentes y siguiendo las recomendaciones de la Organización Mundial de la Salud en relación con la alimentación, el tiempo dedicado a pantallas, la actividad física y los hábitos de sueño. También se incluyó un apartado relacionado con la higiene debido a la importancia que tienen los hábitos higiénicos en la salud de las personas.
ParticipantesSe recopilaron datos de 401 participantes de las Islas Canarias (rango de edad: 18-73 años), que se ofrecieron como voluntarios para completar el cuestionario en línea.
ResultadosEl cuestionario reveló índices de confiabilidad general adecuados (α de Cronbach >0,70, ω de Mcdonald >0,70) y validez de constructo. El análisis de regresión lineal jerárquica reveló que la edad, el sexo y los ingresos están significativamente (p < 0,05) relacionados con los hábitos de vida saludables de los adultos en nuestra población, con el sexo y la edad explicando la mayor parte de la varianza. Sin embargo, la educación y los ingresos no resultaron significativos (p > 0,05) cuando se introdujo la educación en el modelo. Los resultados señalaron que las personas mayores y las mujeres muestran hábitos de vida más saludables.
ConclusiónEl cuestionario resultó ser una herramienta breve, fiable y válida para evaluar hábitos de vida saludables en adultos de Canarias. Además, los resultados señalaron que en futuros estudios de intervención con niños se deben tener en cuenta variables como el sexo de los adultos, la edad y, en menor medida, los ingresos mensuales.
Childhood obesity is one of the most important current public health challenges, affecting not only a child's health but also their educational achievement and quality of life,1 as well as a wide range of physical, psychological, and social aspects.2 Many weight-related behaviors (i.e., dietary intake, physical activity patterns, sleep duration, and screen time) are developed during childhood,2,3 weight loss becoming harder once children become obese,4 tending to track from childhood to adulthood.5
Research has mainly explored the effects that food intake, physical activity, sedentary behavior, or sleep duration have on health outcomes as independent components,6 but health is the result of the combination of all these behaviors. Health habits such as following dietary recommendations, sleeping 8–10h/night, or at least 60min of physical activity per day have been found to be related with health outcomes.7–10 Unhealthy habits such as sedentary behaviors, screen time and poor dietary quality have been found to be related to non-communicable diseases like obesity.11,12
In the Canary Islands (Spain) the rates of childhood overweight and obesity are high and increasing. The Aladino study (the national branch of the World Health Organization's international effort to monitor childhood obesity) reported rates of overall overweight and obesity in children between 6 and 9 years of age of 44.2% in 2014.13 Recent reports have shown stable values in the prevalence of overweight and obesity for the Canary Islands’ pediatric population from 2011 (32.42%) to 2018 (33.74%).14 These are among the highest rates of childhood obesity reported for Spain15 and Europe.16 For the adult population, in a previous study, carried out with approximately 5000 participants from the Canary Islands, 42.5% of the participants reported a BMI≥25.17 A possible solution to the increase in overweight and obesity in the Canary Islands, and the comorbidities resulting from it, lies in new policies and interventions that influence not only children but their contexts as well.
According to previous research, obesity should be framed as a system affected by multiple interdependent individual-level and socioenvironmental factors.18 Family's habits19 and socioeconomic status (SES),20 and teachers’ habits21 and beliefs22 stand out among the factors that influence health habits during childhood and should be assessed and controlled when designing and evaluating childhood intervention programs. However, in order to do so, reliable and valid tools are needed.
Although there are several questionnaires designed to assess health habits in the Spanish adult population,23 we lack a screening tool capable of detecting unhealthy habits in adults briefly and concisely. To our knowledge, there are two questionnaires that have been designed with that aim: The Prescribe Healthy Life Screening Questionnaire24 and The Healthy Lifestyle Questionnaire.23 However, none of them include questions related to the wider range of obesity risk factors (i.e., food intake, physical activity, screen time, and sleep habits). Furthermore, due to the kind of items included in those questionnaires (i.e., smoking or alcohol consumption), parents’ health habits cannot be compared with their children's. Therefore, the need for a short, standardized screening tool that assesses healthy and unhealthy diet, physical activity, screen time, and sleeping habits for the Canarian population prompted us to create the Health Lifestyle Habits Screening Questionnaire for Adults (HLHSQ-A).
The design of the HLHSQ-A questionnaire is the first step within a more extensive intervention program in the schools aimed to prevent and reduce children's overweight and obesity in the Canary Islands by working hand in hand with schools, teachers and families.
Based on the premises, through this research, we aim to explore the construct validity and reliability of the HLHSQ-A to efficiently assess adults’ health lifestyle habits in the Canary Islands. In addition, the study examines whether age, sex, incomes, and education mediate in adults’ health lifestyle habits in our population.
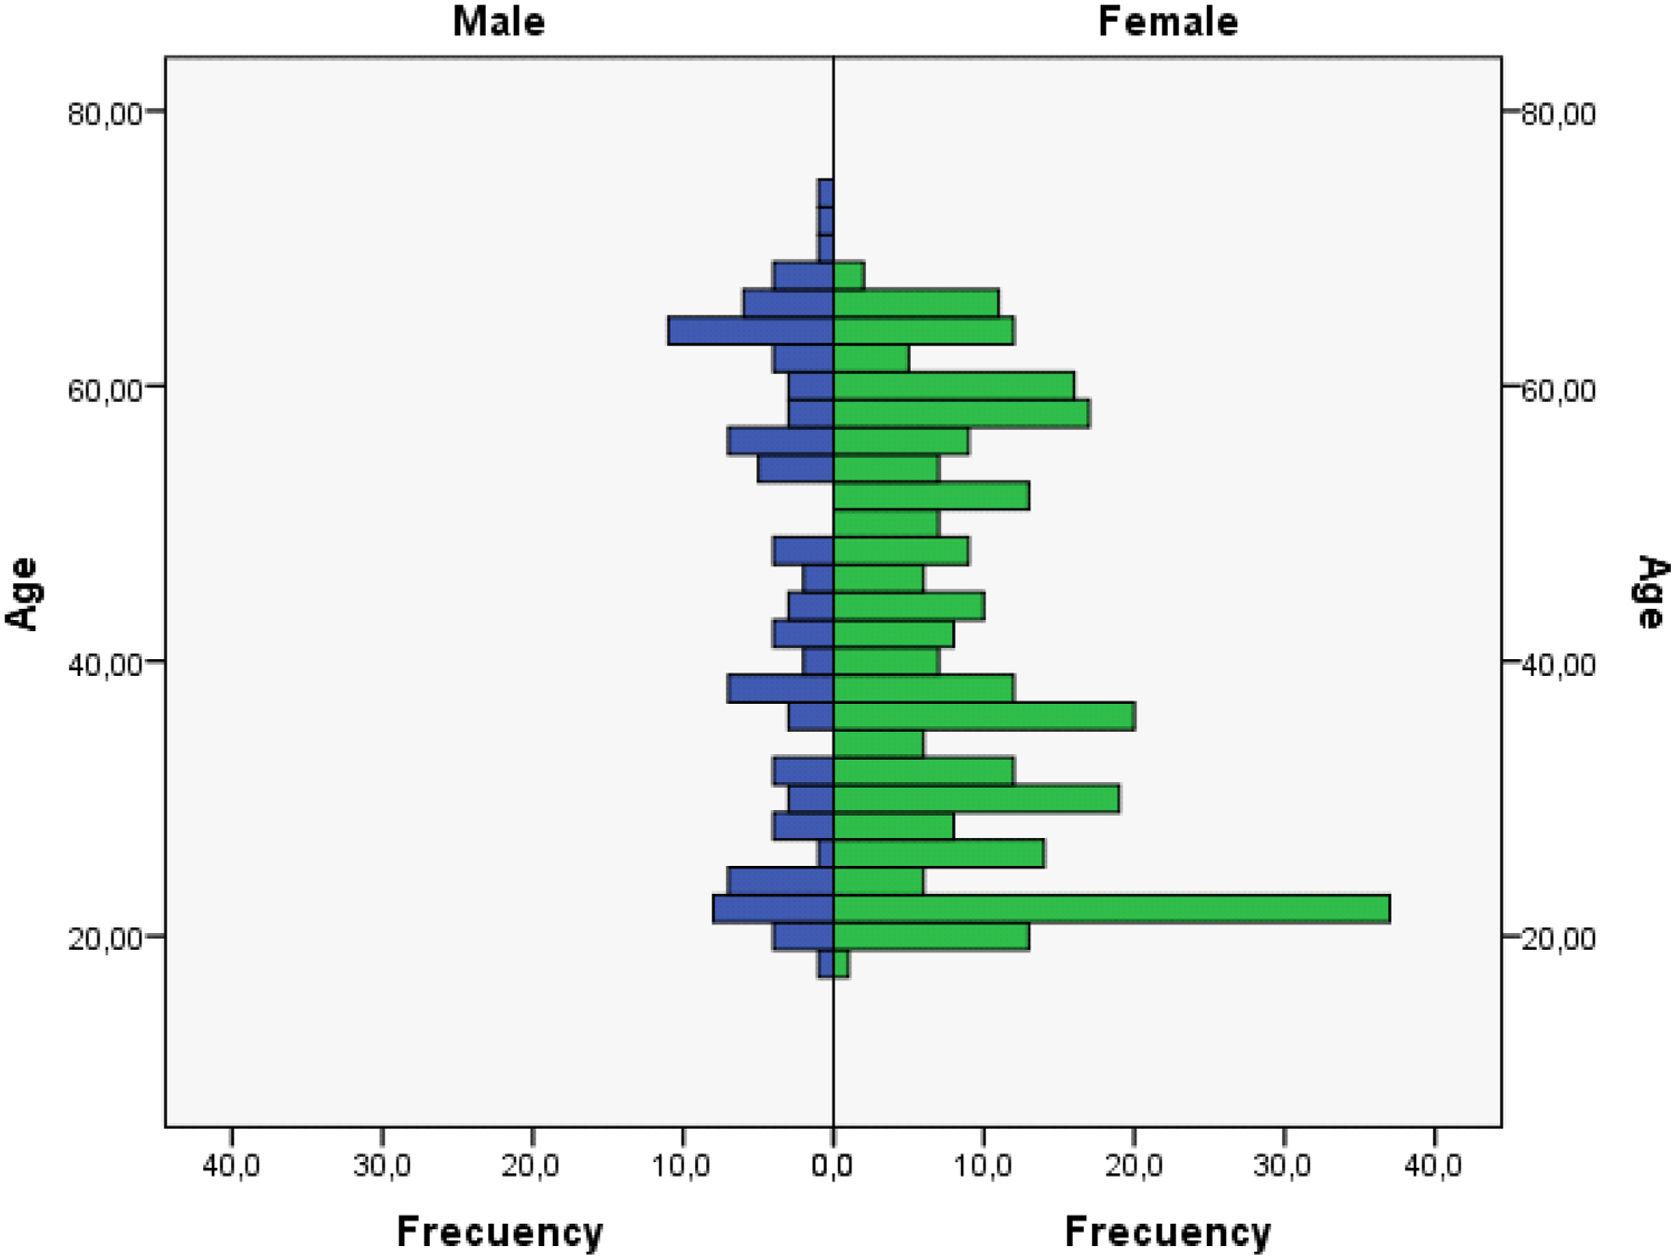
MethodParticipantsA total of 401 participants between 18 and 73 years old (Appendix A; Mage=41.60, SD=15.59; 73.8% females, 26.2% males) from The Canary Islands (Spain) volunteered to answer the questionnaire. Since the questionnaire was posted online, all the participants read the information note before deciding to fill in the questionnaire. In the information sheet, they were informed of the aim of the study, and they were assured of complete anonymity.
MaterialsThe Health Lifestyle Habits Screening Questionnaire for Adults (HLHSQ-A [Cuestionario de Cribado de Hábitos de Vida Saludables para Adultos]) was developed based on the World Health Organization (WHO)’s recommendations7,8,25 regarding diet, physical activity, hygiene, screen time and sleep habits, and the items included in both the Krece Plus26 and KidMED27 questionnaires, which have been widely used for the Spanish pediatric population. The questionnaire started with a pool of 43 items. Those items were reviewed by a panel of two experts in nutrition and three experts on education and psychology. Redundant, ambiguous, or non-relevant items were excluded. Also, item readability was improved. The final questionnaire included 30 items. The items were divided into three categories based on previous research where some behaviors have been negatively or positively related to the later presence of obesity7–12 and to the importance the hygiene have in the prevention of non-communicable diseases28: healthy diet and activities (HDA), unhealthy diet and activities (UDA), and hygiene (H). HDA included items related to healthy food intake, physical activity, and sleep habits. UDA included items concerning unhealthy food intake and screen time. Finally, H involved items regarding hygiene habits (Table 1). For each item participants were asked to indicate the number of days per week (i.e., 0=none, 7=every day) they carried out a specific action (e.g., How many days a week do you eat three or more fruits?) related to different health lifestyle habits (i.e., diet, physical activity, sleep, screen time or hygiene). Items were later score following the recommendations of the WHO,7,8,25 ranging from 1 to 3 (1=bad, 2=regular, and 3=good) (Appendix B). The questionnaire was built using Google Forms.
Demographic characteristics of the participants.
| n | % | |
|---|---|---|
| Sex | ||
| Male | 105 | 26.2 |
| Female | 296 | 73.8 |
| Educational level (highest degree achieved) | ||
| Primary education | 11 | 2.7 |
| Secondary education | 8 | 2.0 |
| Baccalaureate/vocational training | 112 | 27.9 |
| Undergraduate degree | 199 | 49.6 |
| Master degree | 41 | 10.2 |
| PhD | 28 | 7.0 |
| Non-response | 2 | .5 |
| Income | ||
| ≤900€ | 149 | 37.2 |
| 901–1500€ | 79 | 19.0 |
| 1501–2000€ | 57 | 14.2 |
| 2001–2500€ | 58 | 14.5 |
| ≥2501€ | 61 | 15.2 |
The questionnaire was posted online for two weeks (i.e., 21/04/2020 to 2/05/2020). Participants were recruited online using social media platforms (e.g., Facebook page of the Canarian Association for Pediatric Research [ACIP canarias]) and WhatsApp groups. University students from La Universidad de La Laguna were recruited via email or by posting the questionnaire in their Moodle classrooms. Participants were informed of the aim of the study, and they were assured of complete anonymity before answering the questionnaire. Because the questionnaire was posted online, all participants received the same information about the questionnaire and the study. Those who agreed with the aim of the study continued and fulfilled the questionnaire.
Data analysisPreliminary analyses of descriptive statistics were computed. Item response theory (IRT) analyses were conducted to identify the items with the best discrimination (α) parameters.29
A Confirmatory Factor Analysis (CFA) was conducted to explore the construct validity of the HLHSQ-A. A second-order factor (i.e., Health lifestyle habits) model was hypothesized with the latent factors HDA, UDA, and H as first-order factors and the items as observable indicators. The first-order factors were proposed following research evidence. A healthy diet, physical activity and healthy sleep habits (i.e., HAD) have been found to be related to adequate weight and health; unhealthy diet and screen time (i.e., UDA) are considered to be related to overweight, and hygienic habits (H) have shown to reduce communicable diseases. The reliability of the model was tested using Chronbach's alpha (α≥.70), omega (Macdonnal's ω≥.60),30 and omega hierarchical (ωH≥.50)31 coefficients. Model quality of fitness was estimated using the robust weighted least squares estimator method (WLSMV) and assessed using the following indexes30,32: χ2, p>.05; χ2/df≤3; TLI≥.90; CFI≥.90, and RMSA≤.06; SRMS≤.08.
Finally, a hierarchical linear regression analysis was performed to examine the joint effects on healthy lifestyle habits of four variables in three subsequent steps, i.e., demographics (sex and age), incomes, and educational level. F statistics, β coefficients, and R2 were reported in each step.
Statistical analyses were computed using IBM SPSS Statistics (v. 25) and the R software program (v. 3.5.3).
ResultsParticipants’ demographic information and items’ descriptive statistics are showed in Tables 1 and 2, respectively. After scoring the items, item 27 (i.e., how many days a week do you shower or bathe?) showed high skewness and kurtosis indexes, above the recommended 3.00 and 10.00, respectively.33 Therefore, it was excluded from further analyses.
Descriptive statistics of the HLHSQ-A.
| Items | Days a week | Scored (1–3) | |||||
|---|---|---|---|---|---|---|---|
| M | SD | M | SD | S | K | ||
| Healthy diet and activities | |||||||
| 1 | How many days a week do you eat three or more pieces of fruit a day? | 4.13 | 2.43 | 1.89 | .83 | .22 | −1.52 |
| 2 | How many days a week do you eat fresh or cooked vegetables? | 4.72 | 1.71 | 1.97 | .70 | −.04 | −.94 |
| 3 | How many days a week do you eat pulses/legumes? | 2.52 | 1.31 | 2.42 | .54 | −.16 | −1.06 |
| 4 | How many days a week do you eat potatoes, pasta, or rice? | 3.44 | 1.61 | 2.69 | .48 | −1.04 | −.40 |
| 5 | How many days a week do you consume whole grains? | 3.67 | 2.39 | 1.71 | .78 | .55 | −1.15 |
| 6 | How many days a week do you eat nuts? | 3.14 | 2.31 | 2.40 | .72 | −.79 | −.71 |
| 7 | How many days a week do you use olive oil for cooking? | 6.11 | 1.68 | 2.62 | .65 | −1.44 | .78 |
| 8 | How many days a week do you consume at least two servings of dairy (one serving equals one glass of milk, two yogurts, or 40 grams of cheese)? | 5.48 | 2.10 | 2.35 | .76 | −.67 | −.99 |
| 9 | How many days a week do you drink four or more glasses of water? | 6.00 | 1.79 | 2.57 | .69 | −1.29 | .26 |
| 10 | How many days a week do you eat breakfast? | 6.26 | 1.84 | 2.72 | .63 | −2.06 | 2.64 |
| 11 | How many days a week do you eat white meat? | 2.93 | 1.47 | 2.56 | .56 | −.81 | −.39 |
| 12 | How many days a week do you eat fish? | 1.99 | 1.15 | 2.24 | .56 | .02 | −.37 |
| 19 | How many days a week do you practice 60min or more of light physical activity (unscheduled or structured) such as walking? | 3.38 | 2.42 | 1.83 | .78 | .30 | −1.29 |
| 20 | How many days a week do you practice 60min or more of scheduled or structured physical activity (gym, team sports, classes)? | 2.34 | 2.24 | 2.08 | .89 | −.16 | −1.73 |
| 21 | How many days a week do you do outdoor leisure activities (go to the beach, take a walk, hiking)? | 2.62 | 1.92 | 2.31 | .68 | −.47 | −.82 |
| 25 | How many days a week do you sleep 8h or more? | 3.66 | 2.51 | 1.81 | .86 | .37 | −1.54 |
| 26 | How many days a week do you sleep well and wake up feeling rested? | 4.05 | 2.22 | 1.90 | .82 | .19 | −1.49 |
| Unhealthy diet and activities | |||||||
| 13 | How many days a week do you drink packaged juices or smoothies? | .84 | 1.75 | 2.60 | .73 | −1.47 | .46 |
| 14 | How many days a week do you eat red meat (beef or pork)? | 1.54 | 1.21 | 2.40 | .77 | −.82 | −.87 |
| 15 | How many days a week do you eat groceries like chorizo or mortadella? | 1.33 | 1.71 | 2.25 | .78 | −.47 | −1.21 |
| 16 | How many days a week do you drink soda or soft drinks? | 1.17 | 1.95 | 2.43 | .77 | −.90 | −.75 |
| 17 | How many days a week do you eat candy, sweets or chocolate? | 2.78 | 2.17 | 1.69 | .70 | .53 | −.88 |
| 18 | How many days a week do you eat industrial pastries? | 1.50 | 1.81 | 2.15 | .78 | −.27 | −1.29 |
| 22 | How many days a week do you spend 2h or more a day on activities related to the use of screens (mobiles, computers, video games)? | 5.44 | 2.20 | 1.21 | .54 | 2.55 | 5.21 |
| 23 | How many days a week do you play video games before sleeping? | 1.68 | 2.55 | 2.35 | .89 | −.75 | −1.32 |
| 24 | How many days a week do you watch television before sleeping? | 5.19 | 2.44 | 1.28 | .64 | 2.01 | 2.45 |
| Hygiene | |||||||
| 27 | How many days a week do you shower or bathe?a | 6.80 | .70 | 2.89 | .36 | −3.20 | 10.23 |
| 28 | How many days a week do you wash your hands before each meal? | 6.31 | 1.73 | 2.73 | .62 | −2.07 | 2.72 |
| 29 | How many days a week do you brush your teeth after each meal? | 5.67 | 2.25 | 2.50 | .76 | −1.12 | −.36 |
| 30 | How many days a week do you wash your hands after using the bathroom? | 6.54 | 1.45 | 2.81 | .53 | −2.74 | 6.11 |
Note. S=skewness; K=kurtosis.
An IRT analysis was conducted and is presented in Table 3. Following Baker's recommendations,29 items with α parameters below .35 were considered to have a low discrimination ability and were therefore removed for following analysis (i.e., items 3, 4, 5, 8, 11, 20, 21, 24, and 25). Furthermore, items 17, 19, 22, and 26 showed low discrimination, ranging between .35 and .64. The remaining items showed from moderate (above .65) to high (above 1.35) discrimination, the best items being items 1 and 13.
Item response theory: discrimination and threshold parameters.
| Items | β1 | β2 | α |
|---|---|---|---|
| 1 | −.37 | .82 | 1.51 |
| 2 | −1.22 | 1.43 | 1.05 |
| 3 | −12.95 | .77 | .29 |
| 4 | 30.95 | 5.40 | −.16 |
| 5 | −.24 | 7.15 | .20 |
| 6 | −2.36 | −.27 | .89 |
| 7 | −2.49 | −1.00 | 1.09 |
| 8 | −4.91 | −.32 | .32 |
| 9 | −3.32 | −1.27 | .66 |
| 10 | −2.70 | −1.92 | .95 |
| 11 | 10.45 | 1.16 | −.32 |
| 12 | −4.37 | 1.38 | .66 |
| 13 | −1.63 | −1.03 | 1.49 |
| 14 | −2.22 | −.46 | .75 |
| 15 | −1.69 | .21 | .93 |
| 16 | −1.74 | −.49 | 1.09 |
| 17 | −.36 | 3.35 | .57 |
| 18 | −1.39 | .51 | 1.04 |
| 19 | −.79 | 2.29 | .57 |
| 20 | −2.67 | 1.08 | .22 |
| 21 | −54.85 | 7.79 | .04 |
| 22 | 4.42 | 6.63 | .42 |
| 23 | −1.43 | −.85 | .75 |
| 24 | 17.81 | 25.74 | .08 |
| 25 | −.49 | 4.73 | .19 |
| 26 | −.89 | 1.79 | .53 |
| 28 | −2.85 | −1.95 | .90 |
| 29 | −2.19 | −.94 | .85 |
| 30 | −2.78 | −2.10 | 1.14 |
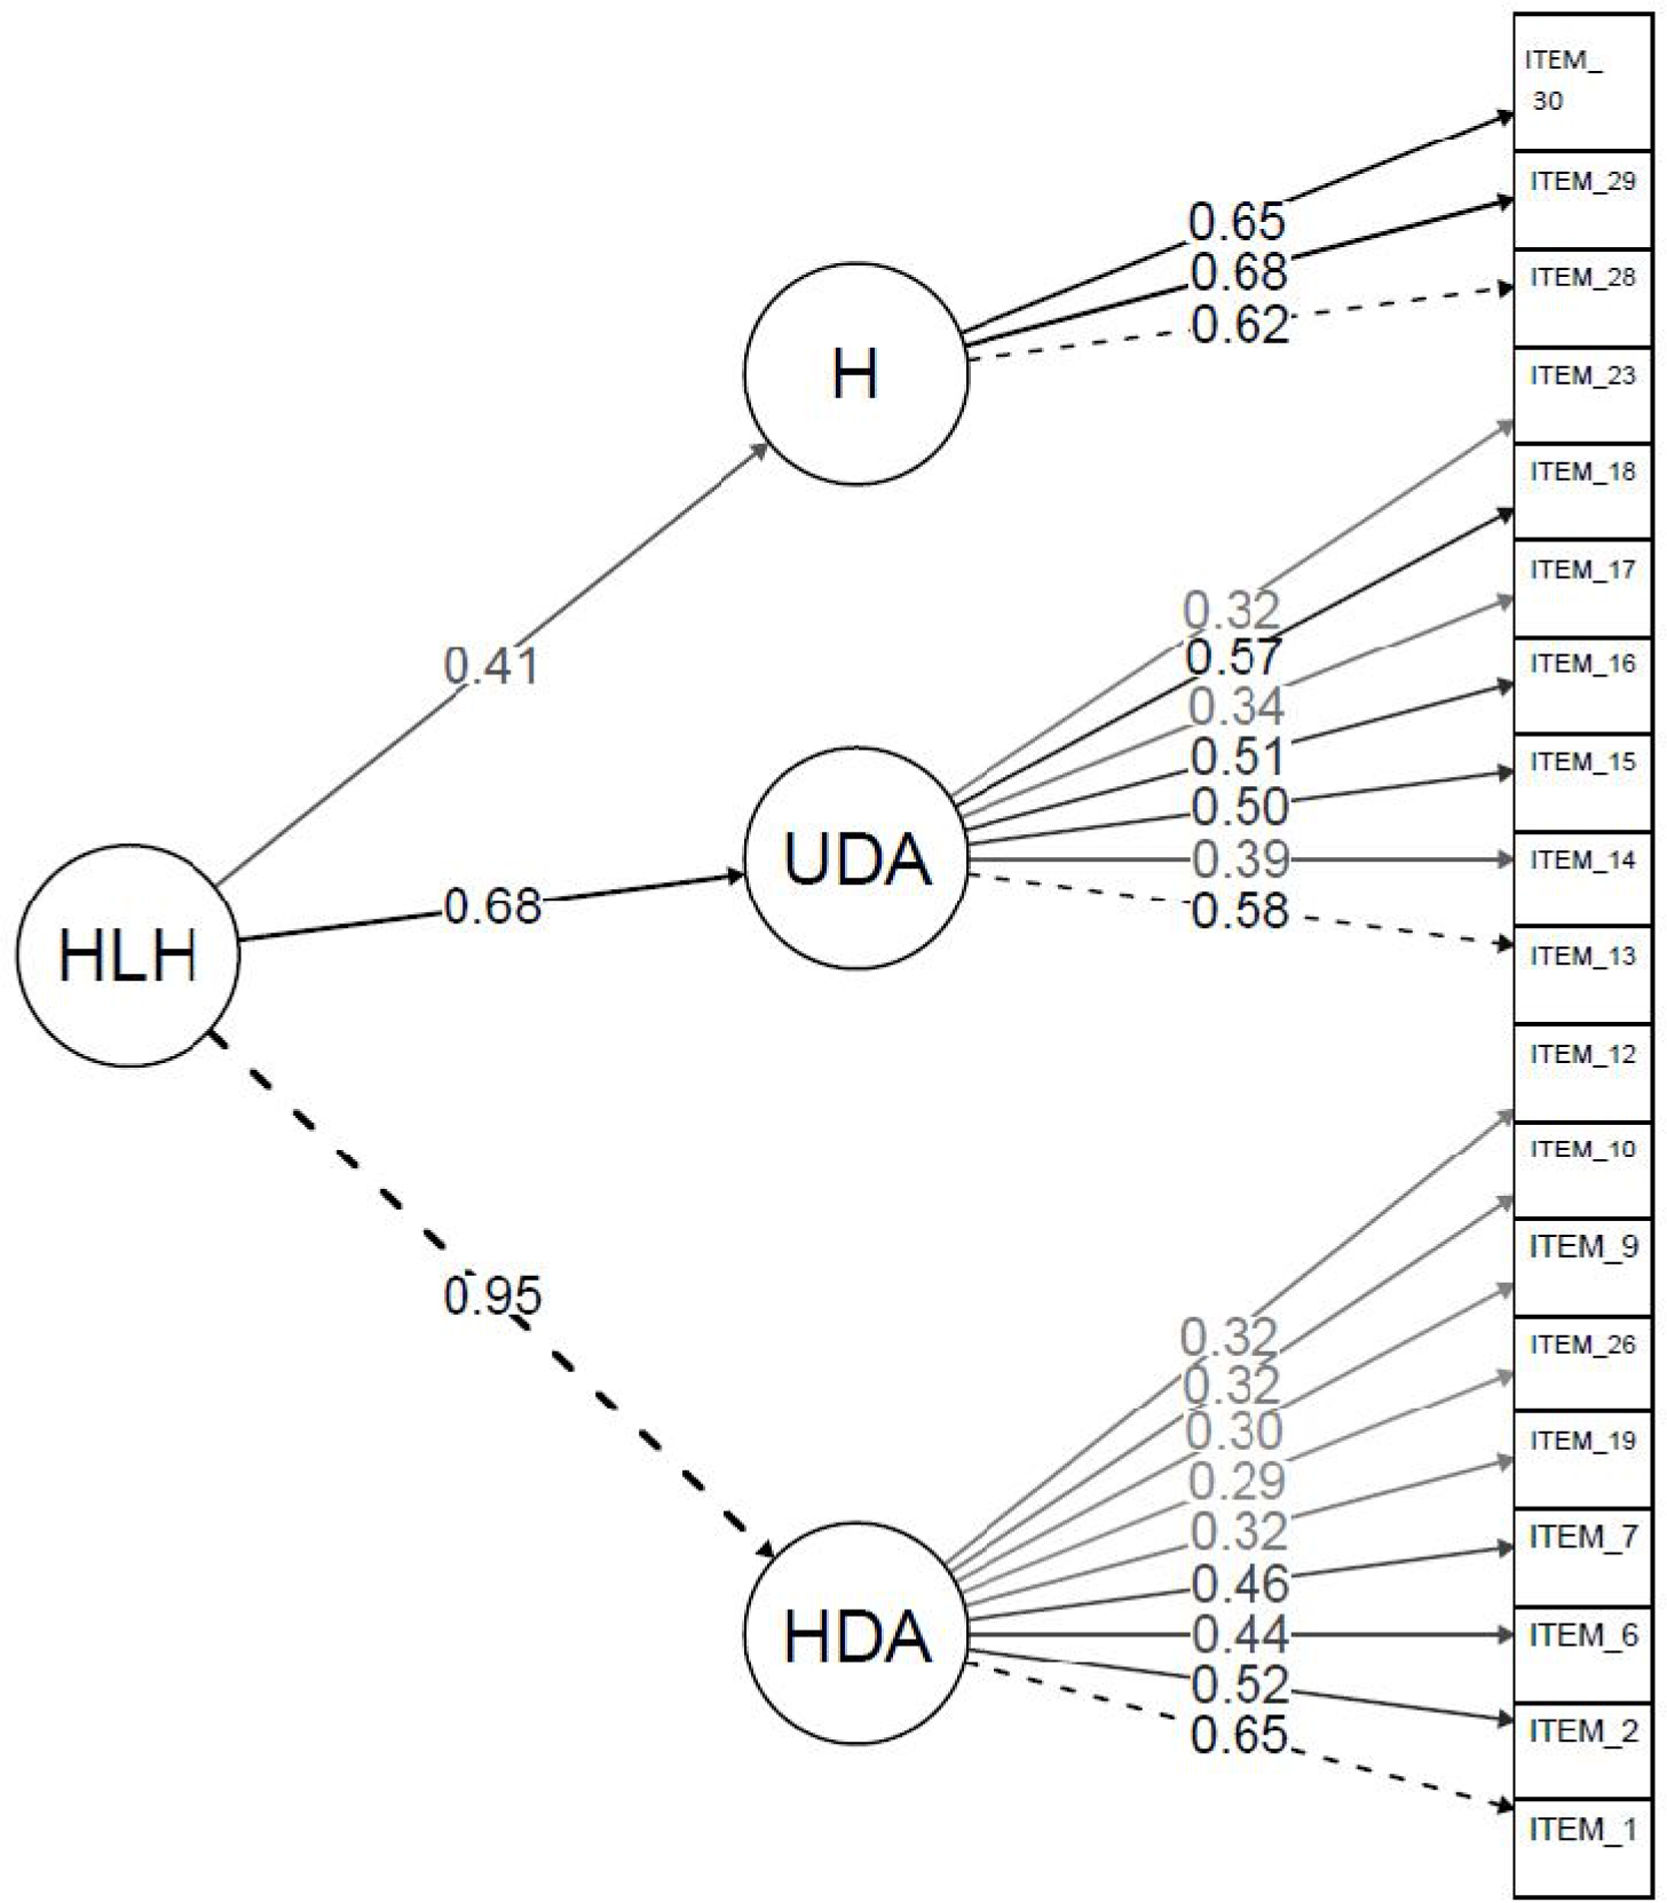
A CFA was conducted to analyze the construct validity of the scale (Fig. 1). A second-order factor model was estimated. Item 22 was removed from the analysis due to the low factorial loading (i.e., λ=.20). After removing item 22, the indices of fit of the final model indicated an adequate fit of the model to the data: χ2=215.70, df=149, p=.001; χ2/df=1.45; CFI=.92; TLI=.91; SRMR=.05; RMSEA=.03, CI=[.02–.04]. All freely estimated unstandardized parameters were statistically significant (p<.001). Factor loading estimates revealed that the indicators were from weakly to strongly related to their purported factors (range of R2=.09–.90). The reliability index for the first-order latent factors (i.e., healthy diet and activities, α=.63 and ω=.64; unhealthy diet and activities, α=.64 and ω=.65; hygiene, α=.69 and ω=.67) was lower than for the whole model (α=.75 and ω=.77, ωH=.50).

According to the previous results, the screening version of the HLHSQ-A finally involved 19 items (Appendix C). A composite score (Health Lifestyle Habits, HLH; minimum=3.89; maximum=8.89; M=7.19; SD=.95) was calculated for the questionnaire by adding the average score of each factor (i.e., HDA, UDA, H).
Table 4 presents the results of the hierarchical regression analysis. Sex and age effects were observed in step 1. Males (M=6.99, SD=.94) had lower scores than females (M=7.25, SD=.94), and older participants had better scores than younger participants, indicating than older people and females had better scores in HLH. Age and sex explained 18% of the variance in HLH. In step 2, income was introduced, and the explained variance in HLH increased by 1%. Higher incomes were associated with higher HLH. In the third step, the educational level was introduced. However, education level and incomes had no significant effects in the third step.
Hierarchical regression analysis to examine the effects on health lifestyle habits.
| Quadratic mean | F | df | p | R2 | t | β | p | 95% CI | |
|---|---|---|---|---|---|---|---|---|---|
| Step 1 | 30.82 | 41.11 | 2, 387 | <.001 | .18 | ||||
| Sex | 3.61 | .17 | <.001 | [.17–.56] | |||||
| Age | 8.73 | .41 | <.001 | [.02–.03] | |||||
| Step 2 | 21.73 | 29.27 | 3, 387 | <.001 | .19 | ||||
| Sex | 3.98 | .19 | <.001 | [.21–.61] | |||||
| Age | 6.22 | .34 | <.001 | [.01–.03] | |||||
| Income | 2.19 | .12 | <.05 | [.01–.13] | |||||
| Step 3 | 16.43 | 22.12 | 4, 387 | <.001 | .19 | ||||
| Sex | 4.02 | .19 | <.001 | [.21–.61] | |||||
| Age | 6.26 | .35 | <.001 | [.02–.03] | |||||
| Income | 1.50 | .10 | =.135 | [−.02 to .13] | |||||
| Educational level | .85 | .05 | =394 | [−.06 to .15] | |||||
This study aimed to assess the validity and reliability of the Health Lifestyle Habits Screening Questionnaire for Adults (HLHSQ-A) in the Canary Islands. The benefits of online surveys, including speed and reduced cost, have been reported by other authors.34 Respondents often prefer them due to their flexibility, allowing them to answer at their own pace, thus increasing response rates.35 The lack of an interviewer reduces social desirability bias, with respondents giving more honest answers to the proposed questions.36 Also, geographical barriers are more easily overcome.36 Therefore, the development and use of an online, self-administered, and brief questionnaire in a fragmented territory such as the Canary Islands seems like an ideal screening tool.
The results found in this study revealed that HLHSQ-A is a reliable and valid tool for assessing adults’ health lifestyle habits in the Canary Islands. The items included in the questionnaire showed moderate to high discrimination, except for items 17 and 19 (α=.57). The best items were items 1 and 13. Item 1 has proved to be useful in several questionnaires,23,24 asking for fruit consumption as an indicator of a healthy diet. However, items related to unhealthy diet such as item 13 (i.e., How many days a week do you drink packaged juices or smoothies?) are less commonly used. Confirmatory factor analysis revealed that the Health Lifestyle Habits factor, defined as a second-order latent factor, was strongly related to the first-order factors Healthy diet and activities (HAD) (R2=.90) and unhealthy diet and activities (UDA) (R2=.47), and to a lesser extent to the Hygiene (H) factor (R2=.17). Therefore, health lifestyle habits were found to be highly related to both healthy and unhealthy diet and activities. Also, items 1(fruit consumption) and 2 (vegetable consumption) showed to be the highest related to HAD with R2=.42 and .27, respectively. Similarly, items 13 (packaged juiced consumption) and 18 (industrial pastries consumption) were highly associated with UDA, R2=.34 and .32, respectively. For the H factor, similar results were found for all items, R2 ranging from .39 to .46.
The questionnaire showed high overall reliability30 (α=.75, and ω=.77) and construct validity. However, indexes were lower when considering single constructs, ranging from α=.63 to .69 and ω=.64 to .67 and suggesting that the questionnaire should be better used as a whole, and not by means of subscales. Nevertheless, some authors have pointed out that alphas above .60 could be acceptable37 and alphas from .50 to .75 indicate that the scale is moderately reliable.38 Furthermore, omegas’ values were above .60, indicating that they were acceptable. Therefore, although the questionnaire as a whole showed to be better to identify people's healthy and unhealthy habits, subscales can be used to interpret people's results.
Since shorter surveys might have lower reliability than longer ones,39 the moderate indexes of reliability found for the subscales in this study might be explained by the number of items included in each subscale. However, increasing the number of items will affect the main aim of the questionnaire: to have a brief and efficient tool to assess healthy habits. Besides, the length of the questionnaires can be a barrier for self-administered compilation, leading to lower participation.40
Two previous screening questionnaires have been designed for the Spanish population: The Prescribe Healthy Life Screening Questionnaire (PHL-SQ),24 and The Healthy Lifestyle Questionnaire (HLQ).23 Several differences can be pointed out when comparing these two questionnaires and the one designed for this study that support the use of the HLHSQ-A as a better alternative.
First of all, although test–retest reliability indexes have been reported for the PHL-SQ, ranging from .38 to .76, p<.001, no indexes for internal consistency were reported. Moreover, they assessed for sensitivity (Se) and specificity (Sp) in their questionnaire. Findings revealed values of Sp=19.2 for physical activity, and Se and Sp below .80 for fruits and vegetable consumption, indicating a very low and moderate capability of those subscales to correctly identify true negatives when evaluating for physical activity and fruit and vegetable consumption respectively. Regarding the HLQ, it showed good construct validity, with factorial loadings ranging from .56 to .90, higher than those found for our model. The subscales included in the HLQ showed internal consistency indexes above .70, while, in our case, the reliability of the subscales was below .70, only the scale as a whole reaching a value above .70. Nevertheless, although the metric properties of the HLQ seem to be the best, the questionnaire does not assess unhealthy food intake, physical activity, or screen time. Furthermore, questions related to food consumption seem ambiguous, combining more than one product (i.e., I usually eat vegetables and fruit every day, or I think that my diet is healthy and balanced).
Secondly, the PLH-SQ was standardized with people ranging from 10 to 65 years old, and the HLQ from 14 to 88 years old. Our questionnaire is the only one to be standardized using exclusively adult population (i.e., 18–73 years old).
Thirdly, neither the PLH-SQ or the HLQ included questions regarding hygienic habits,25,41 which are important to prevent communicable diseases, such as the current coronavirus pandemic.
According to our results, the composite score HLH was developed, enabling us to explore differences regarding sociodemographic variables. Differences among sex, age, or income have been reported in previous studies.42,43 The results found in this study suggest that in the Canary Islands, health habits might be related to sex, age, and, to a lesser extent, to income. Females, older people, and a higher salary were positively associated with better scores in the questionnaire. The influence that these factors have on health have been widely established.44–49 The results found in our study are similar to those reported in a recent study in the Community of Andalucia (Spain), where greater variance in self-rated health was observed in older females depending on SES and lifestyle factors.48 We did not find a significant effect of the education level, even though educational inequalities have been found to be a risk factor in general health.50 That might be due to the fact that our sample is well educated, only around 5% of the population showing an educational level equal to or below Secondary Education. For example, Pinillos-Facnco and García Prieto51 founded an effect of education on a Spanish sample, but their sample was composed of 65% of lower educated people (i.e., Primary and Secondary Education) and 35% of higher educated (i.e., Above secondary education).
Although SES influences parents’ and, therefore, children's health lifestyle habits, evidence shows that high-quality early years’ services focusing on parenting can compensate for the adverse effects that social disadvantages have on early child development.52 This highlights the importance of intervention programs directed to compensate for children's differences and to improve children's health habits despite their SES.
LimitationsThe data of the HLHSQ-A was obtained online by sharing the questionnaire through social media, emails, and La Universidad de La Laguna Virtual Campus. Therefore, the participants in the study are not a representative sample of the population of the Canary Islands. Also, there might be some bias in the data as the responses of those who lack access to the internet or do not have the knowledge to solve online surveys will not be captured, and because invitations to participate were distributed among people related to La Universidad de La Laguna or ACIP Canarias, which may lead to the over-representation of a particular point of view.34 This would also explain higher participation in women than men, since the researchers who shared the questionnaire work in the areas of medicine, psychology, and education, where the ratio of females is usually higher than males.53 Nevertheless, although larger samples would be necessary to be able to generalize our findings to the Canary Islands’ population, the results found in this study are coincident with those found in similar studies. Furthermore, activities’ related items (i.e., sleep habits, physical activity, and screen time) showed lower discrimination parameters and factorial loadings than food or hygiene-related items. Future research should explore the adequacy of new items related to physical activity, sleep habits, and screen time.
ConclusionThe HLHSQ-A has proved to be a reliable and valid tool to screen adults’ health lifestyle habits in the Canary Islands. Furthermore, it includes items related to factors identified as mediating in weight increase and overall health for both children and adults based on the World Health Organization's recommendations7,8,25 and both the Krece Plus26 and KidMED27 questionnaires. The use of this questionnaire will allow us to easily detect adult population who do not have healthy habits. However, since HLHSQ-A is a screening survey, more specific and wider questionnaires should be used for a deeper understanding of adult population health habits.
As we pointed out before, this is the first step into a broader project aimed to improve children's health habits related to obesity outcomes in the Canary Islands. Proof of the validity and reliability of the HLHSQA will allow us to explore and control for adults’ health habits when carrying on intervention studies in Canarian schools.
Unhealthy diet, sedentary behavior, too much screen time and insufficient sleep duration have been related to obesity in both adults and children. Childhood and adult obesity are one of the main health problems in the Canary Islands. Populations’ habits screening is difficult due to the length of currently validated questionnaires.
What does this study add to the literature?This study provides a reliable, valid and short questionnaire that evaluates diet, sleep habits, physical activity, screen time and hygiene.
What are the implications of the results of the study?The use of the questionnaire might help identify unhealthy habits and monitor the efficacy of programs addressing the problem of obesity in Canarian population.
All authors contributed to the design of the study, carried out the study and contributed to the writing of the article. Data analysis was performed by S.C de León.
Ethical standards disclosureThis study was conducted according to the CEIBA (Research Ethics Committee) guidelines from La Universidad de la Laguna (https://viinv.ull.es/ceiba/). Participants were informed of the aim of the study and answered the questionnaire voluntarily.
Financial supportThis project, entitled Obesity intervention in the Canary Islands, was funded by Fundación MAPFRE Guanarteme with YNM and LPQ as PIs. The funder did not play any role in the design of the study, data collection, writing of the manuscript or the decision to submit for publication.
Conflict of interestNone.
The authors would like to thank the members of the Learning Disabilities, Psycholinguistic and Information and Communication Technologies (DEAP&NT) research team from Universidad de La Laguna, for their help with tool design and data collection, and to all the participants for volunteering to take part in this study.

Score procedure for each of the items included in the HLHSQ-A.
| Factor | Items | Score procedure per days | ||||||||
|---|---|---|---|---|---|---|---|---|---|---|
| 0 | 1 | 2 | 3 | 4 | 5 | 6 | 7 | |||
| HDA | 1 | How many days a week do you eat three or more pieces of fruit a day (whole, not juices)? | 1 | 1 | 1 | 1 | 2 | 2 | 2 | 3 |
| HDA | 2 | How many days a week do you eat fresh or cooked vegetables? | 1 | 1 | 1 | 1 | 2 | 2 | 2 | 3 |
| HDA | 3 | How many days a week do you eat pulses/legumes? | 1 | 2 | 2 | 3 | 3 | 3 | 3 | 3 |
| HDA | 4 | How many days a week do you eat potatoes, pasta, or rice? | 1 | 2 | 2 | 3 | 3 | 3 | 3 | 3 |
| HDA | 5 | How many days a week do you consume whole grains (pasta, rice, bread)? | 1 | 1 | 1 | 1 | 2 | 2 | 2 | 3 |
| HDA | 6 | How many days a week do you eat nuts? | 1 | 2 | 2 | 3 | 3 | 3 | 3 | 3 |
| HDA | 7 | How many days a week do you use olive oil for cooking? | 1 | 1 | 1 | 1 | 2 | 2 | 2 | 3 |
| HDA | 8 | How many days a week do you consume at least two servings of dairy (one serving equals one glass of milk, two yogurts, or 40 grams of cheese)? | 1 | 1 | 1 | 1 | 2 | 2 | 2 | 3 |
| HDA | 9 | How many days a week do you drink four or more glasses of water? | 1 | 1 | 1 | 1 | 2 | 2 | 2 | 3 |
| HDA | 10 | How many days a week do you eat breakfast? | 1 | 1 | 1 | 1 | 2 | 2 | 2 | 3 |
| HDA | 11 | How many days a week do you eat white meat (chicken, turkey, or rabbit)? | 1 | 2 | 2 | 3 | 3 | 3 | 3 | 3 |
| HDA | 12 | How many days a week do you eat fish? | 1 | 2 | 2 | 3 | 3 | 3 | 3 | 3 |
| UDA | 13 | How many days a week do you drink packaged juices or smoothies? | 3 | 2 | 2 | 1 | 1 | 1 | 1 | 1 |
| UDA | 14 | How many days a week do you eat red meat (beef or pork)? | 3 | 2 | 2 | 1 | 1 | 1 | 1 | 1 |
| UDA | 15 | How many days a week do you eat groceries like chorizo or mortadella? | 3 | 2 | 2 | 1 | 1 | 1 | 1 | 1 |
| UDA | 16 | How many days a week do you drink soda or soft drinks? | 3 | 2 | 2 | 1 | 1 | 1 | 1 | 1 |
| UDA | 17 | How many days a week do you eat candy, sweets or chocolate? | 3 | 2 | 2 | 1 | 1 | 1 | 1 | 1 |
| UDA | 18 | How many days a week do you eat industrial pastries (cookies, buns...)? | 3 | 2 | 2 | 1 | 1 | 1 | 1 | 1 |
| HDA | 19 | How many days a week do you practice 60min or more of light physical activity (unscheduled or structured) such as walking? | 1 | 1 | 1 | 2 | 2 | 2 | 3 | 3 |
| HDA | 20 | How many days a week do you practice 60min or more of scheduled or structured physical activity (gym, team sports, classes)? | 1 | 2 | 2 | 3 | 3 | 3 | 3 | 3 |
| HDA | 21 | How many days a week do you do outdoor leisure activities (go to the beach, take a walk, hiking)? | 1 | 2 | 2 | 3 | 3 | 3 | 3 | 3 |
| UDA | 22 | How many days a week do you spend 2h or more a day on activities related to the use of screens (mobiles, computers, video games)? | 3 | 2 | 2 | 1 | 1 | 1 | 1 | 1 |
| UDA | 23 | How many days a week do you play video games (console, computer or mobile) before sleeping? | 3 | 2 | 2 | 1 | 1 | 1 | 1 | 1 |
| UDA | 24 | How many days a week do you watch television before sleeping? | 3 | 2 | 2 | 1 | 1 | 1 | 1 | 1 |
| HDA | 25 | How many days a week do you sleep 8h or more? | 1 | 1 | 1 | 1 | 2 | 2 | 3 | 3 |
| HDA | 26 | How many days a week do you sleep well and wake up feeling rested? | 1 | 1 | 1 | 1 | 2 | 2 | 3 | 3 |
| H | 27 | How many days a week do you shower or bathe? | 1 | 1 | 1 | 1 | 2 | 2 | 2 | 3 |
| H | 28 | How many days a week do you wash your hands before each meal (at least 3 times a day)? | 1 | 1 | 1 | 1 | 2 | 2 | 2 | 3 |
| H | 29 | How many days a week do you brush your teeth after each meal (at least 3 times a day)? | 1 | 1 | 1 | 1 | 2 | 2 | 2 | 3 |
| H | 30 | How many days a week do you wash your hands after using the bathroom (each time you go to the bathroom)? | 1 | 1 | 1 | 1 | 2 | 2 | 2 | 3 |
Note: Items are organized in the same order as they were presented to the participants. HDA=healthy diet and activities; UDA=unhealthy diet and activities; H=hygiene.
Final version of the HLHSC-A in the Spanish language.
| ¿Cuántos días a la semana…? | Marque de 0 a 7 | |
|---|---|---|
| Ejemplo: Consume café | 3 | |
| 1 | Consume 3 o más piezas de fruta al día (enteras, no en zumos) | |
| 2 | Consume zumos o batidos envasados | |
| 3 | Consume verduras frescas o cocinadas | |
| 4 | Consume frutos secos | |
| 5 | Utiliza aceite de oliva para cocinar | |
| 6 | Bebe cuatro vasos o más de agua | |
| 7 | Consume carne roja (vaca o cerdo) | |
| 8 | Consume pescado | |
| 9 | Consume embutidos tipo chorizo o mortadelas | |
| 10 | Consume bebidas gaseosas o refrescos | |
| 11 | Consume dulces, golosinas o chocolate | |
| 12 | Desayuna | |
| 13 | Consume bollería industrial (galletas, bizcochos…) | |
| 14 | Practica 60 minutos o más de actividad física suave (no programada o estructurada) como pasear, caminar… | |
| 15 | Juega a videojuegos (consola, ordenador o móvil) antes de dormir | |
| 16 | Duerme bien y se levanta descansado | |
| 17 | Se lava las manos antes de cada comida (al menos 3 veces al día) | |
| 18 | Se lava los dientes después de cada comida (al menos 3 veces al día) | |
| 19 | Se lava las manos después de ir al baño (cada vez que va al baño) |
Note: Items must be scored using Appendix B. Formula to calculate the composite score Health Lifestyle Habits: HLH=X¯HDA+X¯UDA+X¯H. HDA=healthy diet and activities (items: 1, 3, 4, 5, 6, 8, 12, 14, 16); UDA=unhealthy diet and activities (items: 2, 7, 9, 10, 11, 13, 15); H=hygiene (items=17, 18, 19). Interpretation of the composite score: HLH≤3=very unhealthy habits; HLH≥4 and ≤7=needs improvement, HLH≥8=adequate.
