INTRODUCTION
Diabetic retinopathy remains the leading cause of blindness among the working age population, and macular edema is one of the primary causes of poor visual acuity in patients with diabetic retinopathy1,2. The breakdown of the blood retinal barrier (BRB) due to the disruption of the tight junctions is the main factor accounting for diabetic macular edema3. While extensive work has been carried out to identify the factors involved in the disruption of the tight junctions of the inner BRB, the mechanisms implicated in the outer BRB regulation have been poorly explored.
The retinal pigment epithelium (RPE) is a highly specialized epithelium that serves as a multifunctional and indispensable component of the vertebrate eye. Through the expression and activity of specific proteins, RPE regulates the transport of nutrients and waste products to and from the retina, contributes to outer segment renewal by ingesting and degrading the membranous disks shed by the photoreceptor outer segments, protects the outer retina from excessive high-energy light and light-generated oxygen reactive species and maintains retinal homeostasis through the release of diffusible factors4. In addition, RPE forms the outer BRB, thus controlling the flow of solutes and fluid from the choroidal vasculature into the outer retina4,5. The inner BRB is constituted by the blood vessels of the retina and directly controls the flux into the inner retina4,5. The strict control of fluid and solutes that cross the BRB is achieved through well-developed tight junctions. Over 40 proteins have been found to be associated with tight junctions, including transmembrane, scaffolding, and signaling proteins6. Zonula occludens-1 (ZO-1), claudins and occludin are the most studied of these proteins, especially concerning the aspects on how they are related to the BRB.
Treatment of RPE cells with either serum, interferon gamma, tumor necrosis factor alpha, hepatocyte growth factor (HGF), interleukin (IL)-1β or placental growth factor-1 (PLGF-1) decreased transepithelial electrical resistance (TER), increased permeability and altered the expression or content of tight junction molecules7-11. However, to the best of our knowledge, the direct effect of high glucose concentrations has never been reported.
The aim of the study was to explore the effect of 5.5 mmol D-glucose (mimicking physiological conditions) and 25 mmol D-glucose (mimicking hyperglycemia that occurs in diabetic patients) on expression (mRNA and protein) of occludin, ZO-1 and claudin-1 in a spontaneously immortalized human RPE line (ARPE-19).
METHODSHuman RPE cell culturesThe immortalized human RPE cell line ARPE-19 was obtained from American Type Culture Collection (Manassas, VA, USA). The cells were maintained in tissue culture flasks in DMEM/F12 1:1 (Gibco; Invitrogen, San Diego, CA, USA) containing 10% fetal bovine serum (FBS; Hyclone, Logan, UT, USA) and 5.5 mmol D-glucose in a humidified incubator at 37 °C in 5% CO2. The medium was changed every 3-4 days. The cells used in these experiments were between passages 16 and 19. In order to rule out a potential bias by an osmotic effect the experiment was also performed using manitol as an osmotic control agent.
We preferred to maintain ARPE-19 cultures in base medium with 10% FBS throughout the experiment because it more closely resembled the physiological conditions. In addition, it should be noted that serum deprivation produces a depletion of nutrients that could lead to a non-specific reduction in protein biosynthesis/secretion.
Real-time PCRRNA was extracted with the Rneasy Mini kit with DNAase digestion. RT-PCR specific primers were used (TaqMan assays): OCLN Hs00170162_m1; TJP1 (ZO-1) Hs00268480_ m1; CLN1 Hs00221623_m1. Automatic relative quantification data was obtained with ABI Prism 7000 SDS software (Applied Biosystems, Foster City, CA, USA) using β-actin as endogenous control gene. The measurements were performed at 14 and 21 days.
Western blot analysisARPE-19 cells were cultured at confluence in Petri dishes during 14 and 21 days in DMEM/F12 medium containing 10% fetal bovine serum and 5.5 mmol D-glucose or 25 mmol D-glucose. Protein was extracted using lysis buffer (10 mmol TRIS, 50 mmol NaCl, 2 mmol EDTA, 1 mmol MgCl2, pH 7.5, 1% SDS, phenylmethylsulfonyl fluoride and complete protease inhibitors) and then homogenized by sonication. The protein concentration was determined using the Bradford assay (Bio-Rad Laboratories, Hercules, CA, USA). A total of 20 μg protein was resolved by 10% SDS-PAGE (for claudin-1 and occludin) and 7.5% SDS-PAGE (for ZO-1) and transferred to a polyvinylidene fluoride membrane (Millipore, Billerica, MA, USA). The membranes were incubated with rabbit primary antibody against claudin-1, rabbit primary antibody against occludin and mouse primary antibody against ZO-1, all diluted 1:1000 (Zymed Lab Gibco; Invitrogen, San Diego, CA, USA ), and further incubated with goat anti rabbit or mouse horseradish peroxidase-conjugated secondary antibody (Pierce; Thermo Scintific, Rockford, IL, USA). Proteins were visualized using the enhanced chemiluminescence detection system (Supersignal CL-HRP Substrate System; Pierce; Thermo Scientific, Rockford, IL, USA). The same blot was stripped and reblotted with a mouse primary antibody specific to β-actin (Calbiochem; EMD, Nottingham, UK) to normalize the protein levels. Densitometric analysis of the autoradiographs was performed with a GS-800 calibrated densitometer (Bio-Rad Laboratories, Hercules, CA, USA) and analyzed with Quantity One 4.6.2 software (Bio-Rad Laboratories, Hercules, CA, USA). The measurements were perfomed at 14 and 21 days.
ImmunohistochemistryInmmunohistochemistry was performed in cells grown in 24-well plates containing one circle cover slip of glass (12 mm of diameter) (Thermo scientific, Menzel-Gläser; Braunschweig, GE) inside each well. The initial concentration was 20,000 cells/ml and cells were grown at confluen ceA for 21 days in DMEM/F12 medium containing 10% FBS under the conditions previously described. Cells were washed with PBS and fixed with methanol for 10 minutes, was hed again with PBS two times and blocked with PBS BSA 2% 0.05% Tween overnight at 4 °C. Rabbit anti-claudin1 or occludin, and mouse anti-ZO1 (Zymed Lab Gibco; Invitro gen, San Diego, CA, USA ), all diluted 1/200 were incu bated for 1 hour at room temperature. After washing two times with PBS, cells were further incubated with Alexa 488 goat anti-rabbit and Alexa 594 donkey anti-mouse secondary antibodies (Invitrogen; San Diego, CA, USA) for 1 hour at room temperature. After washing two more times with PBS the slides were mounted with Vectashield mounting medium for fluorescence with DAPI (Vector Laboratories; Burlingame, CA, USA) and were observed with a fluorescent microscope (BX61; Olympus, Hamburg, Germany). Images were acquired with a confocal laser scanning microscope (FV1000; Olympus, Hamburg, Germany). Each image was saved at a resolution of 2,048 × 2,048 pixel image size.
Cell countingNuclei from seven fields of each condition were counted to determine the total number of cells and cells in division per field. Images were acquired at 20× with the Olympus fluorescence microscope BX61 (equivalent to an area of 0.57 mm2).
CytotoxicityLactate dehydrogenase (LDH) was measured as an indicator of cell death by using a cytotoxicity detection kit (Roche;Applied Science, Barcelona, Spain). LDH activity was measured in a 96-well plate with two replicates for each condition at an absorbance of 490 nm. Results are expressed as percentage of cells showing cytotoxicity ± SD. Percent cytotoxicity = (exp value – low control) / (high control-low control) × 100.
Statistical analysisThe Kolmogorov-Smirnov test was employed to confirm the assumption of the normality of the variables. Student’s t test was used to compare continuous variables that were expressed as mean ± SD. Levels of statistical significance were set at p < 0.05. Unless otherwise specified, the results are expressed in arbitrary units.
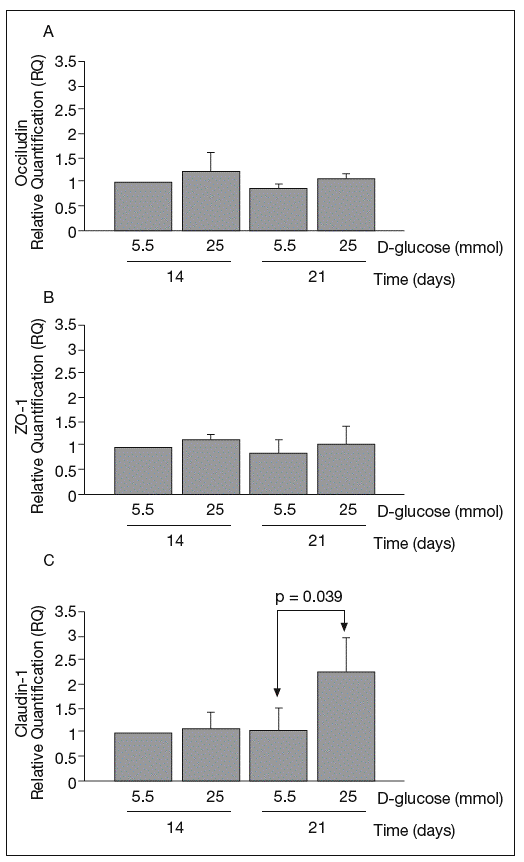
RESULTSReal-time PCRThe results of real-time PCR for occludin, ZO-1 and claudin-1 mRNA obtained at 14 and 21 days of culture are shown in figure 1. Occludin and ZO-1 mRNA levels were similar in cultures maintained in 5.5 mmol and 25 mmol of D-glucose at 14 and 21 days. By contrast, high glucose concentration produced a clear upregulation of claudin-1 mRNA expression at 21 days (1.03 ± 0.48 vs 2.29 ± 0.7; p = 0.039).
Fig. 1. Results of real-time PCR. A: results of occludin. B: zo-1. C: claudin-1. The vertical axis is the relative expression level of each gene against the 5.5 mmol D-glucose medium at 14 days. Gene expression levels were calculated after normalizing with β-actin. Bars represent the mean ± SD of the values obtained.
Western blot analysis
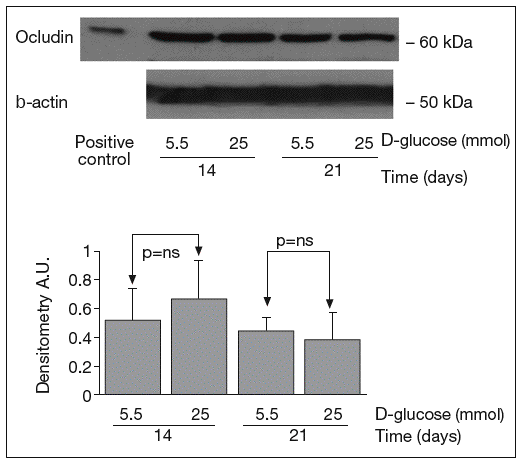
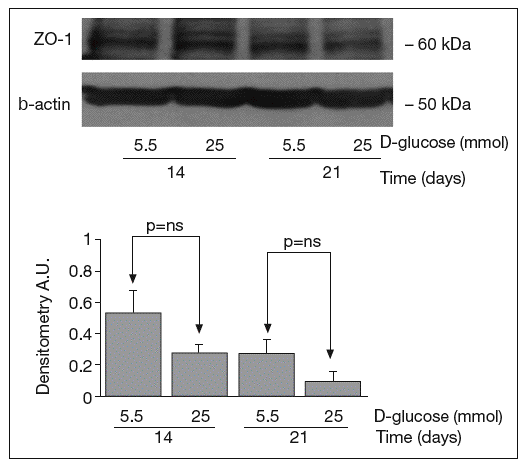
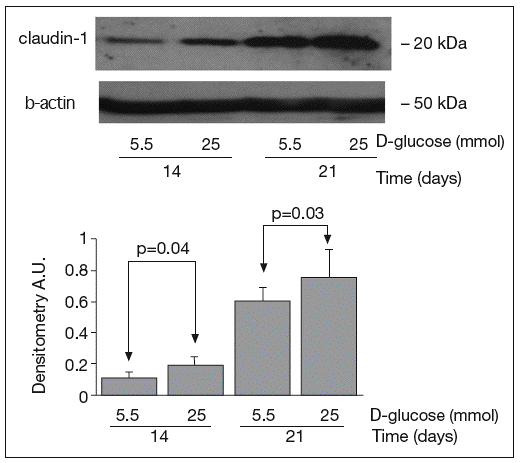
The results of Western blot analysis are displayed in figures 2-4. Bands at approximately 60 kDa were found for occludin, but there were no significant differences between both glucose conditions in the measurements performed at 14 days (0.52 ± 0.22 vs 0.66 ± 0.28; p = 0.42) and at 21 days (0.44 ± 0.10 vs 0.38 ± 0.19; p = 0.56) (fig. 2). For ZO-1, a low protein content was observed in samples grown at 25 mmol of D-glucose at 14 (0.53 ± 0.15 vs 0.27 ± 0.06; p = 0.09) and 21 days (0.28 ± 0.09 vs 0.09 ± 0.07; p = 0.1), but these differences were not significant (fig. 3). By contrast, we found significant differences in claudin-1 expression between the two glucose conditions. At 14 days, we observed a significantly higher claudin-1 protein content in cells cultured under 25 mmol of D-glucose (0.14 ± 0.08 vs 0.28 ± 0.11; p = 0.04). This difference was even more evident at 21 days (0.92 ± 0.12 vs 1.14 ± 0.28; p = 0.03) (fig. 4).
Fig. 2. Results of Western blot analysis of occludin. Protein levels are expressed in arbitrary units after correction for β-actin. Bars represent the mean ± SD. NS: no significant.
Fig. 3. Results of Western blot analysis of ZO-1. Protein levels are expressed in arbitrary units after correction for β-actin. Bars represent the mean ± SD.
Fig. 4. Results of Western blot analysis of claudin-1. Protein levels are expressed in arbitrary units after correction for β-actin. Bars represent the mean ± SD.
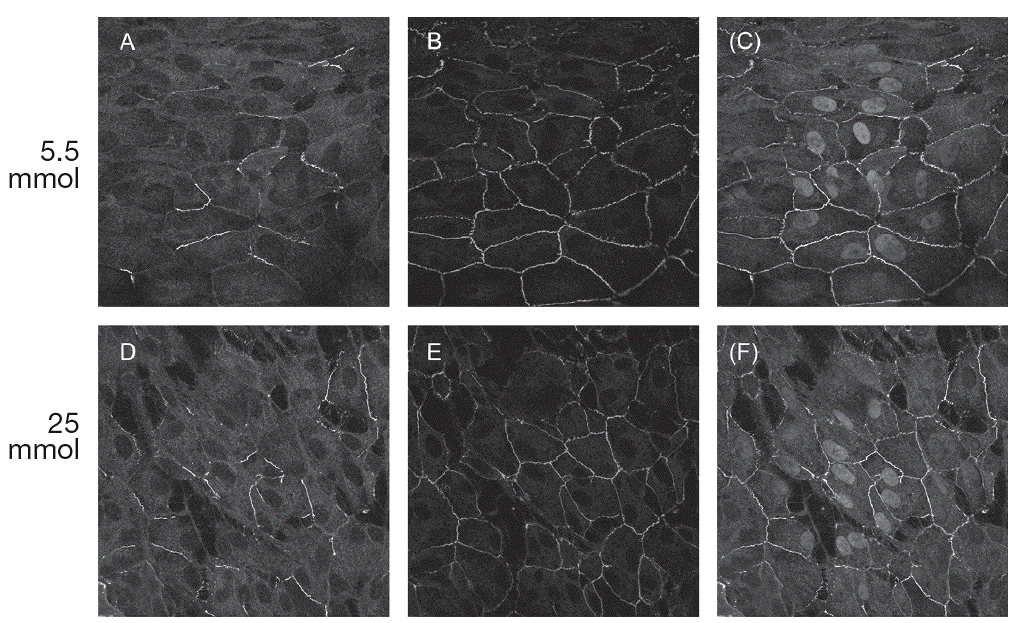
ImmunohistochemistryThe results of the immunohistochemistry performed at 21 days of the experiment are shown in figure 5. Immunofluorescence confocal micrographs demonstrate that in both glucose conditions the cells were grown forming a monolayer. When cells were cultured at 25 mmol of D-glucose, claudin-1 staining (fig. 5D) appeared to be stronger than when cultured at 5.5 mmol (fig. 5A). Claudin-1 was observed to colocalize with ZO-1 in junctional complexes (fig 5C, F).
Fig. 5. Results of immunohistochemistry for claudin-1 and ZO-1. Expression of claudin-1 (A, D) and zo-1 (B, E) in ARPE-19 cultured cells. C, F: merged image showing colocalization of claudin-1 and ZO-1.
Cell counting and cytotoxicity detectionIn order to rule out a potential bias in the results due to changes in cell proliferation, the total number of cells and cells in division were counted. No significant differences were found in the total cell number be-tween 5.5 mmol of D-glucose and 25 mmol (146 ± 27.37 vs. 141.29 ± 20.01; p = NS). The number of cells in division was very similar between both glucose concentrations (16.14 ± 4.95 vs 19.57 ± 7; p = NS). In addition, we did not observe any significant differences regarding cytotoxicity as measured by LDH assay (5.43% ± 0.56 vs 6.72% ± 0.46; p = NS).
Controlling by osmotic effectThe results of RT-PCR and Western blot of tight junction proteins were very similar to the above mentioned when the experiment was controlled by the osmotic effect using manitol (data not shown).
DISCUSSIONThe effect of the RPE on the properties of the neighboring cells is well documented but the effects of neighboring environments on RPE are less well studied12,13. Intercellular junction integrity of RPE can be impaired by several proinflammatory cytokines, such as HGF and PLGF-18-11. However, the specific effects of high glucose concentrations on the function and molecular constituents of RPE cell tight junctions have never been reported. In the present study, we found that glucose at a concentration mimicking severe hyperglycemia (25 mmol) significantly increases the expression and content of claudin-1. Therefore, it seems that high glucose concentrations strengthen rather than weaken the tight junction properties of ARPE-19 cells. These findings have important implications in both the design and the interpretation of the results of in vitro experimental studies using ARPE19 cultured cells.
There is little information regarding the effect of the pathogenic factors involved in diabetic retinopathy on ARPE-19 tight junction proteins. Abe et al10 reported that IL-1β impaired the barrier function in ARPE-19 cells and this was accompanied by an aberrant expression of the tight junction molecules (downregulation of occludin and upregulation of claudin-1). Ghassemifar et al14 demonstrated that VEGF significantly upregulates ZO-1α+ and ZO-1α– transcripts and proteins. In the current study, we found that high glucose concentrations lead to a differential expression of tight junction proteins in ARPE-19 cells. Whereas occludin expression (mRNA and protein levels) was unaffected, a low but not significant protein content of ZO-1 was detected at 14 and 21 days. By contrast, a significant upregulation of claudin expression (mRNA and protein levels) was found at day 14 and was even higher at day
21. This increase of claudin-1 protein content in cultures treated with glucose 25 mmol as compared with 5.5 mmol suggests that glucose exerts its effects on the barrier function by a process involving a specific increase in claudin-1 expression. The complexity of the tight junction complex is just beginning to be understood in epithelial model systems and the relative contribution of the various junctional proteins to BRB properties and the changes in permeability in disease states will be critical areas for future studies. In fact, claudins are thought to constitute the backbone of tight junction strands15.
The results of the present study can not be easily transferred to clinical practice because the diabetic milieu is something more than high blood glucose levels, and other elements such as cytokines, growth factors, reactive oxygen species and advanced glycation end-products could be involved in the tight junction dysfunction that occurs in diabetic retinopathy. However, our findings strongly suggest that hyperglycemia per se is not an important factor accounting for the impairment of the outer BRB in diabetic retinopathy. It is worth noting that Busik et al16 have recently reported that in vivo diabetes-related endothelial injury in the retina may be due primarily to the release of cytokines induced by glucose but not a direct effect of high glucose. Another potential weakness of our study is that cultured cells do not perfectly fit in as a model of the tissue from which they were derived, simply because cells need to interact with their environment to maintain a native phenotype. One of the most difficulty properties to retain in epithelial cell culture is precisely the barrier function performed by tight junctions. However, ARPE-19 cell line is a spontaneously transformed line of human RPE that retains barrier function and, therefore, is a good model for studying RPE tight junctions17.
In conclusion, high glucose concentration leads to differential expression of tight junction proteins in ARPE-19. Our results suggest that the upregulation of claudin-1 by glucose is involved in the increase of junction sealing function. However, further investigation is needed to determine the mechanisms involved in the up-regulation of claudin-1 mediated by glucose as well as its functional consequences and the clinical applicability of these findings.


