


The aim of this study was the development and validation of a fast and simple high performance liquid chromatography method for measuring voriconazole in human serum using ravuconazole as an external standard. The experience of the reference laboratory in therapeutic drug monitoring of voriconazole is also reported. This method is based on the precipitation of proteins in human serum and detection by HPLC/UV. Chromatographic separation is achieved using an isocratic solvent delivery with detection at 255nm and a run time of 7min. The assay was validated according to international guidelines and was also applied to the analysis of 141 trough serum samples from patients treated with voriconazole. All validation parameters met the criteria set out in FDA guidelines for bioanalytical methods. A high interpatient and intrapatient variability was observed in clinical samples. This method is accurate enough to perform therapeutic drug monitoring in patients receiving voriconazole treatment.
El objetivo de este estudio fue el desarrollo y validación de un método rápido y sencillo mediante cromatografía líquida de alta eficacia para la cuantificación de voriconazol en muestras de suero de origen humano usando ravuconazol como estándar de extracción. Además se detalla la experiencia de un centro de referencia en la monitorización de voriconazol. El método está basado en la precipitación de proteínas con acetonitrilo para su posterior procesamiento en un aparato de HPLC/UV. La separación cromatográfica se llevo a cabo usando flujo isocrático con longitud de onda de detección a 255nm y un tiempo de análisis de 7 minutos. En ensayo se validó de acuerdo con las guías internacionales y se aplicó al análisis de 141 muestras de pacientes tratados. Todos los parámetros de validación cumplían los criterios de la Guía de la FDA para la validación de métodos bioanalíticos. Se observó una gran variabilidad intra e interpaciente en las muestras clínicas evaluadas. El método es suficientemente preciso y exacto para la monitorizacón de pacientes en tratamiento con voriconazol.
Voriconazole (VRC) is a triazole with broad-spectrum antifungal activity, currently considered to be the first-line agent for the treatment of invasive aspergillosis1,2. This compound is available in both intravenous and oral formulations3–5 with an activity that is influenced by both genetic (CYP polymorphisms) and clinical conditions (i.e. hepatic failure, concomitant medications, etc.). This metabolic pathway makes it prone to interactions with a large number of drugs.
In light of this pharmacodynamic and pharmacokinetic variability, many studies have attempted to correlate blood levels of the compound with the clinical response. Most of the published data has shown substantial inter- and intra-individual variability in absorption and metabolism of VRC, resulting in a wide range in its trough plasma concentration6–9.
In the past, regular VRC blood level monitoring was not indicated, although it was useful to guide the dosing in patients with reduced hepatic function, undergoing renal dialysis, or on concomitant treatment with drugs that affected its metabolism. Most recent published data, however, have suggested that efficacy and tolerance of VRC could be increased with therapeutic drug monitoring (TDM) in patients with invasive mycosis, which would be a suitable strategy to maximise the cost-effectiveness of treatment of these infections10–12.
Several methods, including bioassay and high-performance liquid chromatography (HPLC) combined with mass spectrometry or with UV detection, have been described for the determination of VRC in biological fluids13–17. Some of these methods use an internal standard with different structural and chemical properties to VRC11,13. These previously reported HPLC-UV methods are clinically useful, but tedious pre-treatment procedures, a considerable amount of sample and a long run-time are usually required for the assay18,19.
Here we present the development and validation of a fast and simple HPLC-UV method for measuring VRC in human serum using ravuconazole (RVC) as the external standard to control the extraction process of each sample.
The stability, specificity, linearity, precision and accuracy of the assay were validated according to international guidelines20,21. The method is suitable for routine clinical use, as it is simple and does not involve any complicated pre-treatment procedures or large amounts of serum. The suitability of this method was tested on a collection of serum samples from patients treated with VRC.
Materials and methodsChemicalsVRC pure drug substance was kindly supplied by Pfizer (Pfizer S.A., Madrid, Spain). Extraction standard (ES), ravuconazole, RVC, was purchased from Bristol Myers Squibb Company (Madrid, Spain). Other antifungal drugs tested were amphotericin B, AMB (Sigma–Aldrich Química S.A., Madrid, Spain), flucytosine, 5FC (Sigma–Aldrich Química), fluconazole, FLC (Pfizer S.A.), itraconazole, ITC and hydroxy itraconazole, OHITC (Janssen Pharmaceutica, Madrid, Spain), posaconazole, POS (Schering-Plough, Kenilworth, NJ), caspofungin, CAS (Merck & Co. Inc., Rahway, NJ), micafungin, MCF (Astellas Pharma, Inc., Tokyo, Japan) and anidulafungin, AND (Pfizer S.A).
Antibacterial drugs used in the specificity assay (imipenem, amoxicillin/clavulanic acid, ciprofloxacin, ceftazidime and gentamicin) were supplied by Oxoid S.A (Oxoid SA, Madrid, Spain). HPLC grade acetonitrile was purchased from Panreac Química SAV (Castellar del Vallés, Spain). HPLC water from Millipore's Milli-Q System was used throughout the analysis. Stock solutions of VRC and IS were prepared in dimethyl sulfoxide, DMSO (Sigma–Aldrich Quimica). Serum from human male AB Plasma was supplied by Sigma–Aldrich Quimica, product reference H4522.
HPLC instrumentThe HPLC system consisted of a Waters 2695 separation module system with column heater and degasser coupled to a Waters 2996 Photodiode array detector (Waters Cromatografía, S.A., Cerdanyola del Vallés, Spain). The Empower Software (version 2.0, Waters Corporation) enabled HPLC system control, acquisition and processing of data. Chromatographic and detection conditions are described in Table 1. The mobile phase consisted of a filtered and degassed mix of acetonitrile:ultrapure water (70:30, v/v).
Chromatographic and instrumental conditions.
| Instrumental parameters | Conditions |
| Elution mode | Isocratic |
| Flow rate | 0.8ml/min |
| Volume of infection | 50μl |
| Wave length detection | 255nm/285nm |
| Column | SunFire C18 5μm 4.6×150mm |
| Guard column | SunFire C18 5μm 4.6×20mm |
| Temperature of the column | 25°C |
| Temperature of the autosampler | 25°C |
| Pressure of the system | 900–1200psi |
| Quantitative detection methodology | Peak area |
| Qualitative detection methodology | Time retention; U.V. Spectrum |
| Calibration mode | Calibration curve |
| Concentration units | μg/ml |
| Retention time | Voriconazole 3.2minRavuconazole 5.90min |
| Run time | 7min |
Two separate stock solutions of VRC were prepared for the calibration standards (CS) and quality control samples (QC), respectively, by dissolving 3.2mg VRC in 2mL of DMSO for each solution, yielding concentrations of 1.6mg/mL.
One solution was used to prepare eight CS at final concentrations of, 0.125, 0.25, 0.5, 1, 2, 4, 8, 16μg/mL by spiking the appropriate amounts of the VRC stock solution into drug-free human serum. Another five QC samples were prepared in the same way using the second stock solution of VRC to obtain final concentrations of, 0.25, 1, 2, 4, 8μg/mL. A stock standard solution of 400μg/mL ES was prepared in DMSO.
CS and QC sample solutions for assay were processed as follows: Ice cold acetonitrile in volume of 150μL was added in a 1:1 proportion to CS and QC. Both solutions also included 1.5μL of ES resulting in a final concentration of 4μg/mL. The final mixture was then shaken for 30s on a Vortex Shaker at maximum speed followed by centrifugation at 13800×g at 25°C for 15min.
Validation proceduresLinearityLinearity (response function) was evaluated by analysing standard VRC solutions in the range of 0.25–16.0μg/mL. Experiments were performed in triplicate and on two non-consecutive days. Linearity was assessed by linear regression (best fit obtained when plotting peak areas measured by HPLC against VRC concentration).
Accuracy and precisionIntra- and inter-day precision and accuracy of the analytical method were evaluated by triplicate processing and analysis of five QC samples (0.25, 1, 2, 4 and 8μg/mL).
Precision was expressed as coefficient of variation calculated as follows: [CV%=(standard deviation/mean of measured values)×100], whereas accuracy was expressed as percentage of the relative error, determined with the formula [(mean measured concentration/nominal concentration)/nominal concentration]×100.
Criteria for acceptability of data included accuracy within ±15% deviation from the nominal values and precision within ±15% of CV%, except for the lower limit of quantification (LLOQ), for which values should not exceed 20% of CV%20,21.
Limit of detection and quantificationLimit of detection (LOD) is defined as the concentration at which the analyte can be distinguished from background signal. This was determined by measuring the peak area that was greater than or equal to the average of the blanks +3 standard deviation (SD). Five replicates of the blank and incrementally increasing amounts of VRC were used in the determination.
The limit of quantification (LOQ) was defined as the analyte response that was at least five times the response of a blank sample and whose precision and accuracy were within 20%.
RecoveryRecovery experiments (extraction efficiency) were performed by comparing the peak area of extracted samples (0.5, 2, and 4μg/mL, n=3) to that of a pure solution at the same concentration.
Selectivity and specificitySelectivity was investigated for potential interferences of endogenous substances by using six independent batches of human serum samples. Selectivity was indicated by the absence of any endogenous interference at VRC and ES retention times.
The specificity was evaluated with respect to all registered anti-fungal and several antibacterial drugs commonly used in the management of patients also treated with VRC (see Chemicals). Specificity was indicated by the absence of interference peaks at retention times of interest.
StabilityQC samples were tested for stability of VRC under a variety of storage and handling conditions:
(a) Three freeze–thaw cycles; (b) short-term storage (freeze for 24h at −20°C and then thaw for 4h at room temperature); (c) long term storage (freeze for 1 month at −20°C and then thaw for 4h at room temperature); (d) post-preparation stability (firstly pre-processed, then storage at room temperature for 24h and 90h, and then processed). For each experiment, percentage deviations of measured peak areas were compared with those obtained from QC samples at the beginning of the study. All stability tests in serum matrix were performed using low (0.5μg/mL), medium (2μg/mL) and high (4.0μg/mL) QC concentrations, and analysed in triplicate.
Quality control programOur laboratory participates in the international quality control program of antifungal drugs of the Association for Quality Assessment in Therapeutic Drug Monitoring and Clinical Toxicology (KKGT). The participation in this program contributes to optimisation of the performance of our clinical service of therapeutic drug monitoring of VRC.
Clinical applicationThe method described here was also applied to the analysis of 141 trough serum samples (median=4/patient, range=2–23) from 32 adults and children treated with VRC and admitted to 13 Spanish hospitals over a two-year period (2009–2010). A small volume of serum (150μL) was required for the analysis. Clinical samples were processed as described above (see CS and QC sample preparation).
Ethics committee approvals were obtained and hospital patients signed the informed consent form which authorised researchers for the therapeutic drug monitoring of VRC and analysis.
ResultsVRC and ES were eluted at 3.20 and 5.90min, respectively, thus allowing the whole procedure including sample preparation and analysis to be completed within 7min (Fig. 1).
 blank plasma, (b) plasma calibrator 2.0μg/mL retention time of voriconazole (3.2min) and retention time of ravuconazole (5.83min).")
The standard curve was linear over a concentration range of 0.25–16.0μg/mL for VRC, with a correlation coefficient of 0.999 (Fig. 2). The LLOQ of VRC was determined to be 0.25μg/mL. The LOD was found to be 0.125μg/mL. The precision and accuracy of the six replicates ranged from 0.92 to 8.80% and from −0.473 to 15.00%, respectively.

The within-day precision and between-day precision for QC samples were <15%. The method also showed an accuracy within 15% (20% for LLOQ), which can be observed in Table 2.
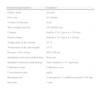
Within-day and between-day precision (expressed as coefficient of variation, CV (%)) and accuracy (as mean percentage deviation, RE (%)) of determined VRC concentrations in serum quality controls.
| Cnom (μg/ml) | C (μg/ml)-(mean±SD) | Precision (CV, %) | Accuracy (RE %) |
| Within-day variability (n=6) | |||
| 0.25 | 0.212±0.007 | 3.58 | −15.06 |
| 1 | 0.96±0.073 | 7.61 | −3.57 |
| 2 | 1.88±0.022 | 1.18 | −5.59 |
| 4 | 3.76±0.033 | 0.89 | −5.77 |
| 8 | 7.42±0.054 | 0.73 | −7.23 |
| Between-day variability (n=18) | |||
| 0.25 | 0.205±0.03 | 14.92 | −2.31 |
| 1 | 0.955±0.08 | 8.38 | −4.42 |
| 2 | 1.87±0.068 | 3.66 | −6.44 |
| 4 | 3.92±0.123 | 3.13 | −1.83 |
| 8 | 7.81±0.309 | 3.96 | −2.31 |
Cnom, nominal or theoretical concentration; C, experimental concentration; SD, standard deviation; CV%, coefficient of variation in percent; RE%, relative error in percent.
The CV% and RE% data were all within the acceptable limits stated for bioanalytical method validation.
The mean recovery from human serum was in the range 93.10–97.7% for VRC. The mean recovery of the ES was in the range 99.33–108.26%.
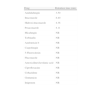
VRC free serum samples did not show any interference with the VRC signal. In addition, no interactions between VRC and matrix components were detected. None of the other frequently used drugs tested showed chromatographic interference with VRC or ES. The compounds evaluated are listed in Table 3.
Retention times of other antifungal and antibacterial drugs.
| Drug | Retention time (min) |
| Anidulafungin | 3.50 |
| Itraconazole | 8.40 |
| Hidroxi-itraconazole | 4.36 |
| Posaconazole | 4.11 |
| Micafungin | NR |
| Terbinafin | NR |
| Amfotericin b | NR |
| Caspofungin | NR |
| 5-Fluorocitosin | NR |
| Fluconazole | NR |
| Amoxiciline/clavulanic acid | NR |
| Ciprofloxacine | NR |
| Ceftazidime | NR |
| Gentamicin | NR |
| Imipenem | NR |
NR, not retained by the column.
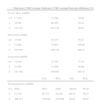
Post-preparation stability testing showed a decrease in stability after 90h, and a slight loss of stability after thaw and freeze cycles, and after long-term storage, in the lowest VRC concentrations. Results of stability conditions are listed in Table 4.
Stability of voriconazole.
| Peak area 1 VRC average | Peak area 2 VRC average | Peak area difference (%) | |||
| Freeze–thaw stability | |||||
| 0.5 | 17234 | 13594 | 78.88 | ||
| 2 | 74541 | 69497 | 93.23 | ||
| 4 | 153732 | 152279 | 99.05 | ||
| Short-term stability | |||||
| 0.5 | 17647 | 16273 | 92.21 | ||
| 2 | 71692 | 75923 | 105.90 | ||
| 4 | 155583 | 156110 | 100.33 | ||
| Long-term stability | |||||
| 0.5 | 14470 | 11163 | 77.14 | ||
| 2 | 72595 | 71640 | 98.68 | ||
| 4 | 152782 | 156955 | 102.73 | ||
| 24h | 90h | 24h | 90h | ||
| Post-preparative stability | |||||
| 0.5 | 5648 | 5651 | 4304 | 100.04 | 76.20 |
| 2 | 72775 | 65777 | 55870 | 90.34 | 76.77 |
| 4 | 166113 | 149584 | 134584 | 93.42 | 84.07 |
As regards the results from the quality control program for VRC during 2009 and 2010, six out of seven samples analysed passed the requirements defined by the program regulations. All results but one were within the 80–120% acceptable range for the theoretical value (median 96.7%, range 76–110%), providing an additional external validation of the method.
The suitability of this analytical method to determine VRC concentration was investigated using a total of 141 trough serum samples from 32 treated patients (average number of samples per patient, 4.6; range, 2–23). While monitoring results from this cohort of patients, concentrations ranged from below LLOQ (<0.25μg/mL) in 26.24% (37/141) of the samples, to above 5.5μg/mL (concentration associated with potential toxic effect) in 4.25% (6 out of 141). A high percentage of samples analysed (51.06%, 72 out of 141) showed concentrations below 1μg/mL, which corresponded to the minimal therapeutic targets for VRC recently proposed by Pascual et al.6
Eighteen patients (18/32, 56.25%) showed a level <1μg/mL at the beginning of monitoring, and for most of them (10 out of 18), the mean VRC concentration reached the therapeutic levels (>1μg/mL) in subsequent samples. Not all the remaining fourteen patients who reached therapeutic VRC concentrations at the beginning of monitoring maintained it persistently above 1μg/mL (5 out 14). It is worth mentioning that a high intrapatient variability in results was detected (Fig. 3).
.")
The highest VRC concentration (9.86μg/mL) was detected in a patient suffering from liver dysfunction, with two serum samples over toxicity levels (patient 23).
DiscussionA simple and fast analytical method was developed to quantify VRC using a small volume of human serum. This method required 150μL of serum and made a result available for clinical decisions in less than 1h (45min). It should be noted that all validation parameters of this procedure met the criteria set out in the EMEA guidelines for bioanalytical methods21.
Other previously published methods have longer run times11,13,16,18, undetermined sample processing times12,13 or required an amount of sample that is not always available from all patients11,18,19,22. Most of them use different chemical compounds as standards to control the chromatographic process. The ES selected for this assay, RVC, has a similar chemical profile to that of VRC. This similar structure (azole class of antifungal drugs) ensures a comparable chromatographic behaviour for both compounds, facilitating the development of a common methodology. As has been shown here, RVC recoveries from spiked samples were in the range of VRC (99.33–108.26% vs. 93.10–97.7%). There are also several LC–MS or LC–MS/MS methods described to quantify azole agents17,23,24. These methods are highly sensitive compared with the other techniques, and generally thought to be superior to HPLC-UV and bioassays. However, they are expensive, and the equipment required is not universally available. Nowadays, chromatographic apparatus with UV detection are frequently available in clinical laboratories and its management does not require such experienced personal as LC–MS/MS does. In addition, the method described has proved to be accurate enough (LLOQ of 0.25μg/mL) to quantify therapeutic or prophylactic levels of VRC as has been described previously. Some authors have recently suggested a VRC level above 0.5μg/mL as a target concentration for prophylaxis and above 1.0μg/mL for therapy, with increased adverse effects when concentrations exceeded 5.0μg/mL6,25.
Taking into account the validation procedure described here, our results showed that VRC was stable under most of the conditions applied. Nevertheless, this study highlights the need to take precautions when handling samples in order to minimise potential compound degradation, especially at low concentrations in continuous thaw and freeze cycles.
We must emphasise that an important advantage of this method is the use of a simple mobile phase with no buffers or additives, compared to other previously published methods11,13,16,18,26. Furthermore, if RVC is given approval as an antifungal for clinical use, this method could also be valid to quantify RVC using VRC as ES.
As regards the results from monitored patients, we found a high inter- and intra-patient variability, similar to that previously published6,8–10. We also found that any target VRC concentration in the therapeutic range (1–5.5μg/mL) does not guarantee therapeutic concentration in a subsequent samples, as has been suggested previously by other authors9. For this reason, any change of dose and/or VRC administration route would require new VRC monitoring in order to maintain an adequate concentration. In our opinion, VRC should be frequently measured for patients at high risk. An important limitation of our study is that we cannot assess the relationship between high levels and toxicity, and low levels with lack of response due to the absence of clinical data.
In conclusion, this method can be applied by clinical laboratories for routine therapeutic drug monitoring. Taking into account the simplicity and speed of the analysis, this method can be offered to the physician to optimise drug dosage on an individual basis.
FundingThis work has been partially financed by a research Project from the Fondo de Investigaciones Sanitarias (Health Research Fund) (FIS, PI09/0624). E. Cendejas has a research Contract from the Fondo de Investigaciones Sanitarias (Grant CM08/0083).
Conflict of interestIn the past 5 years, M.C.E. has received grant support from Astellas Pharma, bioMérieux, Gilead Sciences, Merck Sharp and Dohme, Pfizer, Schering Plough, Soria Melguizo SA, the European Union, the ALBAN program, the Spanish Agency for International Cooperation, the Spanish Ministry of Culture and Education, the Spanish Health Research Fund, the Instituto de Salud Carlos III, the Ramon Areces Foundation, the Mutua Madrileña Foundation. He has been an advisor/consultant to the Panamerican Health Organization, Gilead Sciences, Merck Sharp and Dohme, Pfizer, and Schering Plough. He has been a paid guest speaker on behalf of Gilead Sciences, Merck Sharp and Dohme, Pfizer, and Schering Plough.
In the past 5 years, J.L.R.T. has received grant support from Astellas Pharma, Gilead Sciences, Merck Sharp and Dohme, Pfizer, Schering Plough, Soria Melguizo SA, the European Union, the Spanish Agency for International Cooperation, the Spanish Ministry of Culture and Education, the Spanish Health Research Fund, the Instituto de Salud Carlos III, the Ramon Areces Foundation, the Mutua Madrileña Foundation. He has been an advisor/consultant to the Panamerican Health Organization, Gilead Sciences, Merck Sharp and Dohme, Mycognostica, Pfizer, and Schering Plough. He has been a paid guest speaker on behalf of Gilead Sciences, Merck Sharp and Dohme, Pfizer, and Schering Plough.
Other authors: No conflicts of interests.