We present an experiment to determine whether in-group favoritism is driven by (i) a desire to be more generous to in-group members or (ii) a desire to eschew interacting with out-group members. We use a simple ultimatum game in which our treatment variable is the costly choice to interact with an in-group member. Our results suggest that rather than behaving more generously when interacting with in-group or out-group members, individuals may simply prefer interacting with an in-group member. Surprisingly, this discrimination does not result in larger ultimatum game offers, but in proposers reporting higher levels of subjective happiness with their payoffs.
Economists are increasingly exploring the role of social identity in motivating and constraining group interactions. As this research develops, we have found that social identity not only influences which individuals interact in social settings and how, but also that social identity affects market behavior. For example, consumers often prefer to purchase goods from local businesses than from less expensive chain stores, citing a desire to interact and support their community's members and organizations.1 This type of community discrimination is of significant economic interest (e.g., Adams & Adams, 2008; Zepeda & Li, 2006) and has found its way into popular culture via documentaries such as Walmart: the High Cost of Low Price and popular media.2
An argument that is commonly used to motivate this behavior is that consumers identify with members of their social group (for example, locally owned firms, local consumers, and members of their own community), casting consumers’ patronage of local businesses as an act of in-group favoritism. This favoritism suggests that consumers are willing to incur higher costs in order to purchase from firms in their in-group. The current study explores this concept using an experiment to investigate whether the effects of identity are motivated by a preference to be more generous with in-group members or by a more fundamental preference to simply interact with in-group members. We explore this idea with a simple ultimatum game, in which our treatment variable revolves around letting proposers choose to pay a cost to guarantee interacting with an in-group member. Our results demonstrate that while outcomes among in-group and out-group pairs do not differ, proposers who are offered this choice are significantly happier than those not offered a choice with the outcomes of the game (conditional on their offer being accepted).
Numerous studies have identified ways in which social or group identity influence social interactions. For example, both Chen and Li (2009) and McLeish and Oxoby (2007) identified a strong in-group bias that causes individuals to behave more generously toward in-group members than out-group members, although this generosity can take different forms. For example, Chen and Li (2009) found that participants are more generous with in-group members than out-group members in offering larger sums in a redistribution game. On the other hand, participants in McLeish and Oxoby (2007) study had expectations of greater generosity from in-group members than out-group members, and engage in greater punishment when in-group members violated the tacit norms inherent in these expectations. This type of behavior is also seen in the market place, where consumers chose to engage in transactions with members of their own in-group. Morita and Servátka (2013) found further evidence that in-group favoritism can solve the holdup problems. As such, one could imagine the various forms an in-group bias could take. For example, in a simple allocation game, one may be more generous toward in-group members (favoritism on the intensive margin) or display favoritism toward in-group members by choosing to interact with them more often (favoritism on the extensive margin). Our primary objective is to identify the extent to which in-group biases (motivated by a sense of group identity) are focused on favoring interactions with in-group members relative to being more generous to in-group members.
We posit that it is not necessarily expected that pecuniary favoritism (via greater generosity) will drive an individual's desire to interact with his or her own group. Rather, an individual may experience or expect a non-pecuniary benefit simply from the interaction with a member of his or her own group. As such, an individual may be willing to pay a non-trivial portion of his or her endowment to guarantee an own-group interaction. Such conjecture relies on the presence of an established group identity. This idea has been extensively explored with theory (e.g., Akerlof & Kranton, 2000; Benabou & Tirole, 2011; Chen & Chen, 2011) and with experiments (e.g., Benjamin, Choi, & Strickland, 2007; Bernhard, Fehr, & Fischbacher, 2006; Brown-Kruse & Hummels, 1993; Chen & Li, 2009; Falk & Zehnder, 2013; Goette, Huffman, & Meier, 2006; Klor & Shayo, 2010; Morita & Servátka, 2013).
In our experiment, subjects participated in a group identity-building task, followed by an ultimatum game in which our treatment was the option to incur a cost to guarantee interaction with an individual from their in-group. At the conclusion of the ultimatum game, subjects were asked to rate how happy they are with their earnings. Consistent with McLeish and Oxoby (2007), but unlike Morita and Servátka (2013), we found that group identity has no significant effect on social behavior (here, larger ultimatum game offers). Instead, we found that nearly 70 percent of subjects were willing to pay in order to guarantee an interaction with a member of their group. Proposers who were given the option of an in-group match (treatment group), and had their offer accepted, reported being happier than proposers in a control group who also had their offer accepted. Moreover, although the proposers in our treatment group incurred a costly choice, they indicated being just as happy as proposers in the same treatment who did not pay for the in-group match.
Experimental designWe conducted experimental sessions in which eight participants were randomly assigned into two groups of four (referred to as Teams A and B), with each group meeting separately in rooms adjacent to our experimental economics laboratory. In order create a group identity, the groups were given the opportunity to earn $10 by working together to complete a list of 25 animal congregation questions. The questions asked participants to match 25 animal names (for example, cows, wolves, jellyfish, and hyenas) with the correct collective noun for their group (for example, herd, pack, smack, cackle). If the team correctly answered at least 20 questions correctly, each team member earned $10. If the team correctly answered 19 or fewer questions, each team member received $5.3 Participants were encouraged to work as a team and were required to submit a single answer sheet for the team. Participants were told that the amount earned by each member could be kept or used in the subsequent portion of the experiment.
After completing the animal congregation questions, participants were brought into the laboratory and seated at individual computer stations. Participants were given instructions for a $10 ultimatum game in which the roles of the proposer and responder would be randomly assigned. The $10 used in the ultimatum game was in addition to the $10 that participants had earned in the animal congregation team activity. Each team sat at opposite ends of the lab with a divider installed to prevent members of different teams from seeing one another.
TreatmentsIn the ultimatum game portion of the experiment, participants from both teams were randomly assigned the role of the proposer or responder and participated in a one-shot $10 ultimatum game.4 In each treatment, participants on each team were randomly assigned the roles of proposer or responder in equal numbers.
In our control treatment (UG), proposers and responders were randomly grouped into pairs, and proposers made their offers knowing the team affiliation (Team A or Team B) of the responder. After being informed of their corresponding offer, responders made accept or reject decisions. All participants were then informed of their total payoffs for the experiment (their initial payoff from the animal congregation task plus any returns from the ultimatum game).
In our willingness-to-pay (WTP) treatment, after the roles of proposers and responders had been randomly assigned, proposers were given the option to pay $2 from their final payoffs to guarantee an interaction with a member of their own team (that is, an in-group member). Specifically, proposers were given a dichotomous choice question (yes or no) regarding their willingness to give up $2 in order to guarantee interacting with an in-group responder (that is, a responder from their team in the animal congregation task) rather than a randomly assigned responder. After answering this question, proposers who paid to interact with an in-group member were assigned a responder from their own team. Proposers who chose not to incur the $2 cost were randomly assigned to the remaining available responders. As such, the fundamental difference between the UG and WTP treatments was the option for proposers to choose to interact with an in-group member rather than face a randomly assigned responder.
At the end of all sessions, participants completed a short demographic questionnaire that included the following question regarding subjective well-being:
How happy are you with the amount of money you received from participating in this experiment? (1: not at all; 7: very)
After completing the survey and the ‘happiness’ question, participants were paid their payoffs privately in cash.5
ResultsOne hundred and twenty-eight individuals participated in the experiment, with 64 participants in each treatment (32 proposers in each treatment). Participants were recruited from the undergraduate population at a large Canadian university using the ORSEE software (Greiner, 2004). The ultimatum game portion of the experiment was conducted using the z-Tree software (Fischbacher, 2007). The identity-building task (animal congregation questions) was conducted with pen and paper. As expected, all teams correctly answered at least 20 animal congregation questions and all participants earned $10 in the identity-building portion of the experiment.
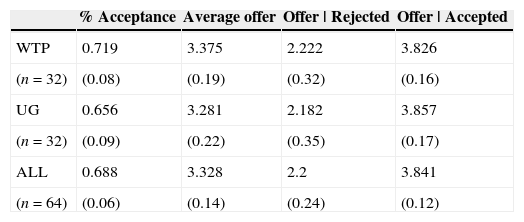
Ultimatum game resultsTable 1 reports the summary statistics from the ultimatum game, while Fig. 1 presents the CDF of offers in the WTP and UG treatments. Replicating previous ultimatum game experiments, the average offer made by proposers was $3.33. We found no significant differences in average offers or the distribution of offers (Wilcoxon p>0.3) across treatments and found no significant differences in responders’ behavior. The average rejected (accepted) offer was $2.22 (3.83) and $2.18 (3.86) in the WTP and UG treatments. As per previous ultimatum game studies, we found that accepted offers were significantly greater than rejected offers, regardless of the treatment (t=−6.982). Further, we report no significant differences between the distributions of accepted (z=0.154) and rejected offers (z=0.208) across treatments.
Summary of offers and acceptance.
| % Acceptance | Average offer | Offer | Rejected | Offer | Accepted | |
|---|---|---|---|---|
| WTP | 0.719 | 3.375 | 2.222 | 3.826 |
| (n=32) | (0.08) | (0.19) | (0.32) | (0.16) |
| UG | 0.656 | 3.281 | 2.182 | 3.857 |
| (n=32) | (0.09) | (0.22) | (0.35) | (0.17) |
| ALL | 0.688 | 3.328 | 2.2 | 3.841 |
| (n=64) | (0.06) | (0.14) | (0.24) | (0.12) |
Standard errors in parenthesis.
Predictably, statistically identical proposer behavior led to similar responder behavior. On average, nearly 70 percent of offers made by proposers were accepted. In WTP, responders accepted 72 percent of the offers, while in UG the acceptance percentage fell to 66 percent. This difference is not significant. The lack of treatment effect on ultimatum game play is not particularly surprising, as ultimatum game results are known to be quite robust across North America and Europe (Camerer, 2003). Moreover, the lack of treatment effects in the ultimatum game echoes previous work, demonstrating that stronger identity-building exercises are often required in simple bargaining environments when financial resources are at play (Johnson & Ryan, 2013; McLeish & Oxoby, 2007; Wit & Wilke, 1992). Moreover, as demonstrated by McLeish and Oxoby (2004) and others, it can be difficult to manipulate social distance or experimental protocols to result in the canonical ultimatum game results.
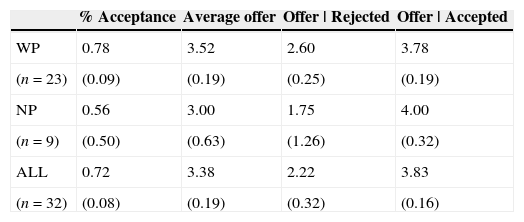
Table 2 focuses on the behavior of participants in WTP, where we can distinguish between those who chose to pay for an in-group interaction and those who did not. Here we found similar results: 72 percent of proposers were willing to pay $2 in order to be matched with responders from their own group. Moreover, a comparison of proposer/responder pairs in which the proposer was willing to pay to participate with a member of their own group (WP) against those not willing to pay (NP) revealed no differences in offers (t=−1.216) or rejection rates (t=−1.277). Further, the average accepted and rejected offers across WP and NP pairs are not significantly different (t=0.556 and t=−1.374).
Summary of offers and acceptance of WTP subjects.
| % Acceptance | Average offer | Offer | Rejected | Offer | Accepted | |
|---|---|---|---|---|
| WP | 0.78 | 3.52 | 2.60 | 3.78 |
| (n=23) | (0.09) | (0.19) | (0.25) | (0.19) |
| NP | 0.56 | 3.00 | 1.75 | 4.00 |
| (n=9) | (0.50) | (0.63) | (1.26) | (0.32) |
| ALL | 0.72 | 3.38 | 2.22 | 3.83 |
| (n=32) | (0.08) | (0.19) | (0.32) | (0.16) |
Standard errors in parenthesis.
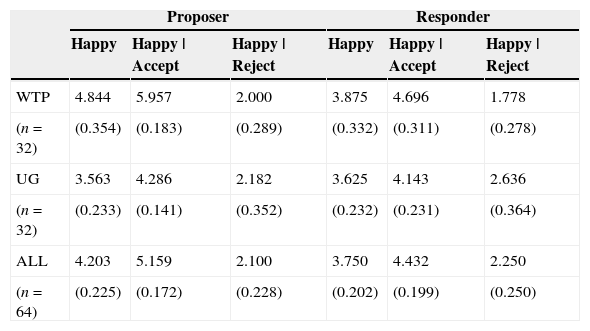
Table 3 presents the happiness reported by participants in each treatment, by role, and acceptance decision. Proposers report marginally greater happiness than responders across UG and WTP (t=1.499). This is unsurprising given that proposers generally earn more and have the added benefit of being able to determine the size of the offer (potentially increasing happiness due to power or process). As expected, proposers of accepted offers reported being happier than those who had their offer rejected (t=−10.267). Similarly, responders who accepted offers were happier than those who rejected them (t=−6.417).
Reported happiness by treatment and role.
| Proposer | Responder | |||||
|---|---|---|---|---|---|---|
| Happy | Happy | Accept | Happy | Reject | Happy | Happy | Accept | Happy | Reject | |
| WTP | 4.844 | 5.957 | 2.000 | 3.875 | 4.696 | 1.778 |
| (n=32) | (0.354) | (0.183) | (0.289) | (0.332) | (0.311) | (0.278) |
| UG | 3.563 | 4.286 | 2.182 | 3.625 | 4.143 | 2.636 |
| (n=32) | (0.233) | (0.141) | (0.352) | (0.232) | (0.231) | (0.364) |
| ALL | 4.203 | 5.159 | 2.100 | 3.750 | 4.432 | 2.250 |
| (n=64) | (0.225) | (0.172) | (0.228) | (0.202) | (0.199) | (0.250) |
Standard errors in parenthesis.
However, we identified significant differences in reported happiness among proposers in WTP (4.844) and those in the UG (3.563; t=−3.024). Thus, the option of choosing an in-group member for the interaction raised subjective happiness with the outcome of the interaction. We found no significant difference in reported happiness across responders in the two treatments (t=−0.617), nor did we identify a difference in the reported happiness of WP and NP proposers (t=−1.103, WTP treatment only).
In WTP, the average reported happiness by proposers, conditional on having their offer accepted, is 5.96, compared to only 4.29 among similar proposers in UG. This difference is significant at the 5 percent level and supported when comparing distributions (Mann–Whitney z=−2.218). Interestingly, this result cannot be attributed to wealth effects, as proposers in the WTP treatment can only earn less than proposers in the UG session. When choosing to interact with a member of their own group, WTP proposers earn $2 less than those in UG (given no observed differences in offers or acceptance rates).
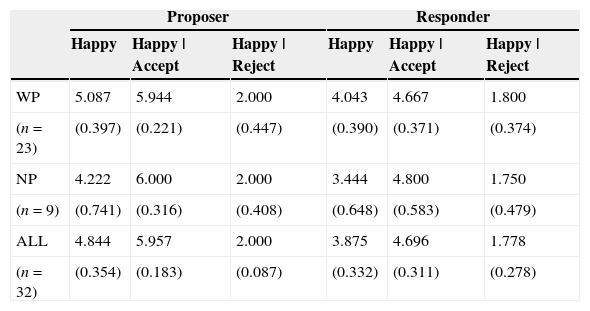
Therefore, the observed increase in happiness is not the result of greater monetary payoffs, but rather of the non-pecuniary benefit of being given the option to interact with an in-group member. Evidence for this is demonstrated by WTP proposers who are significantly happier than UG proposers (t=−3.024). However, as can be seen in Table 4, there is no significant difference in reported happiness between proposers in WTP who were matched with an own-group members and those who were not (that is, between those who paid and did not pay $2; t=0.122). Conditional on offers being accepted, WTP proposers report being happier in their earnings regardless of whether they paid to have an in-group responder. This is remarkable given that WP proposers are necessarily earning less than other proposers. The result is similar when focusing those proposers who had offers accepted: WP proposers who had offers accepted are happier than UG proposers who had offers accepted (t=−6.517), as are NP proposers with acceptances happier than similar UG proposers (t=−5.262).6
Reported happiness by role and partner.
| Proposer | Responder | |||||
|---|---|---|---|---|---|---|
| Happy | Happy | Accept | Happy | Reject | Happy | Happy | Accept | Happy | Reject | |
| WP | 5.087 | 5.944 | 2.000 | 4.043 | 4.667 | 1.800 |
| (n=23) | (0.397) | (0.221) | (0.447) | (0.390) | (0.371) | (0.374) |
| NP | 4.222 | 6.000 | 2.000 | 3.444 | 4.800 | 1.750 |
| (n=9) | (0.741) | (0.316) | (0.408) | (0.648) | (0.583) | (0.479) |
| ALL | 4.844 | 5.957 | 2.000 | 3.875 | 4.696 | 1.778 |
| (n=32) | (0.354) | (0.183) | (0.087) | (0.332) | (0.311) | (0.278) |
Standard errors in parenthesis.
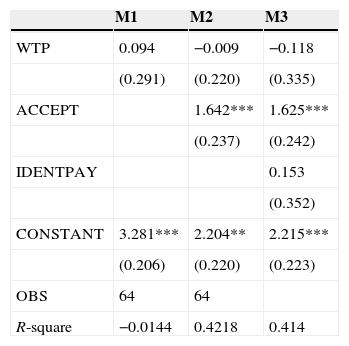
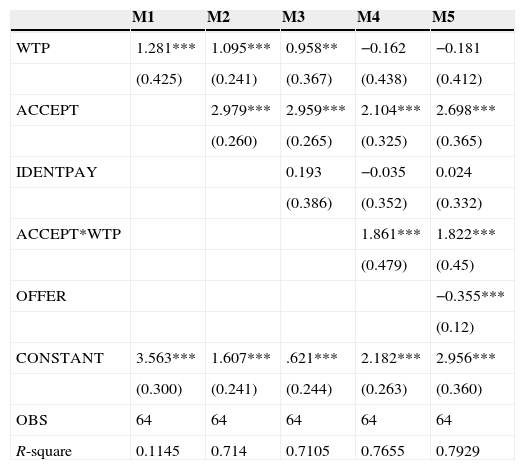
Tables 5 and 6 present regressions that estimate proposers’ offers and reported happiness as a function of a treatment dummy (WTP), a dummy variable equal to one if the proposer's offer was accepted (ACCEPT), and a dummy variable equal to one if the proposer paid extra to participate with a member of their own group (IDENTPAY). When estimating the proposers reported happiness, we use the same variables, adding an interaction between the treatment (WTP) and the responders’ behavior (ACCEPT), and the offer to the responder.7
Regression results of proposer's offers.
| M1 | M2 | M3 | |
|---|---|---|---|
| WTP | 0.094 | −0.009 | −0.118 |
| (0.291) | (0.220) | (0.335) | |
| ACCEPT | 1.642*** | 1.625*** | |
| (0.237) | (0.242) | ||
| IDENTPAY | 0.153 | ||
| (0.352) | |||
| CONSTANT | 3.281*** | 2.204** | 2.215*** |
| (0.206) | (0.220) | (0.223) | |
| OBS | 64 | 64 | |
| R-square | −0.0144 | 0.4218 | 0.414 |
Standard errors in parentheses. *** p<0.01; ** p<0.05; * p<0.1.
Regression results of proposers’ reported happiness.
| M1 | M2 | M3 | M4 | M5 | |
|---|---|---|---|---|---|
| WTP | 1.281*** | 1.095*** | 0.958** | −0.162 | −0.181 |
| (0.425) | (0.241) | (0.367) | (0.438) | (0.412) | |
| ACCEPT | 2.979*** | 2.959*** | 2.104*** | 2.698*** | |
| (0.260) | (0.265) | (0.325) | (0.365) | ||
| IDENTPAY | 0.193 | −0.035 | 0.024 | ||
| (0.386) | (0.352) | (0.332) | |||
| ACCEPT*WTP | 1.861*** | 1.822*** | |||
| (0.479) | (0.45) | ||||
| OFFER | −0.355*** | ||||
| (0.12) | |||||
| CONSTANT | 3.563*** | 1.607*** | .621*** | 2.182*** | 2.956*** |
| (0.300) | (0.241) | (0.244) | (0.263) | (0.360) | |
| OBS | 64 | 64 | 64 | 64 | 64 |
| R-square | 0.1145 | 0.714 | 0.7105 | 0.7655 | 0.7929 |
Standard errors in parentheses. *** p<0.01; ** p<0.05; * p<0.1.
Table 5 provides further evidence of the result seen in Table 1; that is, there are no significant differences in the size of the offers made by proposers across treatments. Moreover, the amounts that WP proposers offer to responders are statistically identical to those offered by UG proposers and NP proposers. Other than the constant, the only significant correlation in Table 5 is the dummy variable ACCEPT, meaning accepted offers are significantly greater than rejected offers (approximately $1.60 more) (Fig. 2).
The regression results in Table 6 are especially interesting when juxtaposed against those presented in Table 5. While we found no significant differences in the offers made by proposers, the results clearly demonstrate that WTP proposers are significantly happier with their final allocations. The increased reported happiness is due to being given the option of who to interact with (in-group or out-group member) and having the corresponding offer accepted. Note that it is the choice and acceptance that matters. WP and NP proposers do not report significantly different levels of happiness conditional on their offers being accepted.
ConclusionWe conducted an ultimatum game experiment in which we primed group identities prior to participants’ interactions and gave participants a costly option to choose whether to interact with an in-group or out-group member. We found that while proposers are willing to forgo a portion of their earnings in order to be paired with an in-group member, willingness to interact with an in-group member does not affect offer or acceptance behavior in the ultimatum game; this result is consistent with previous research (McLeish & Oxoby, 2004). Moreover, we observe that a large proportion of proposers were willing to pay 20 percent of their initial earnings to interact with members of one's own group. This suggests that in-group interactions are an important part of a social interaction and may take primacy over pecuniary returns. We found evidence for this in our measures of happiness associated with the outcomes of the interactions. Proposers who had the option of interacting with the in-group member and had their offers accepted reported significantly higher levels of happiness than proposers who did not have such an option. This suggests that one of the key non-pecuniary returns from social identity lies in the mere interaction with an in-group member.
There are several reasons why a proposer may be willing to incur a cost to ensure interaction with a member of their own group. For example, proposers may believe they are better able to predict the behavior of in-group members and are therefore better able to estimate the minimum offer of the responder. However, previous research (e.g., McLeish & Oxoby, 2007) does not support this motivation. Alternately, the willingness to pay in order to interact with an in-group member may be the result of altruistic feelings toward the in-group. As such, and as suggested by Chen and Li (2009), proposers may want to protect responders of their own group from expected lower offers made by proposers of the out-group. However, given that we observe no differences in offers or acceptance behavior across treatments, an explanation based on proposers’ expectations seems unfounded. Finally, it is possible that proposers who pay for in-group matches report greater happiness as a means to justify spending $2 for the in-group match. To identify whether this is the case, follow-up research should also consider varying the cost of the in-group match. If there is no reported change in reported happiness, this would suggest a self-serving bias wherein happiness is a means of ex post justification for choices.
Support from the Social Sciences and Humanities Research Council of Canada and the Canadian Institute for Advanced Research is gratefully acknowledged.
Tice, Carol (2010) “New Study Shows What makes Shoppers Buy Local.” Accessed on 10/2013 from: http://www.entrepreneur.com/blog/218790.
“Something Walmart This Way Comes.” South Park. Comedy Central. November 2004. Cable Television.
The threshold of 20 correct answers was chosen based on previous experiments. Our goal was to have all groups meet the threshold and receive $10, thereby avoiding ex ante wealth differences.
In an ultimatum game (Guth et al., 1982), two players bargain over an endowment. The proposer chooses an offer to extend to the responder, who may either accept or reject the offer. If the responder accepts, the responder keeps the amount of the offer and the proposer receives the endowment less the offer. If the responder rejects the offer, both players receive nothing. In previous experiments, accepted offers range between 25 percent and 50 percent. For an extensive review of these games, see Camerer (2003).
Instructions are available on the corresponding author's webpage and by request.
Additional evidence of this finding was observed due to statistically identical reported happiness in rejected offers by proposers in all sessions (Tables 3 and 4).


