


The application of telemetry systems to monitor and send physiological functions raises a number of challenges in project development of modules that can enter the body with minimal intrusion, managing and amplifying the sensitive signals generated by the body, and transmitting them to an external system for data reading. Such devices can be used to monitor and manage the signals from patients and obtain accurate readings in noisy electrical environments (such as operating rooms). The following paper shows an application of wireless communication systems applied to medical measurement and monitoring via Bluetooth.
La aplicación de sistemas telemétricos para vigilar y enviar funciones fisiológicas plantea un gran número de retos en la elaboración de proyectos de módulos que puedan introducirse en el cuerpo con un grado de intrusión mínimo, amplificando y gestionando las minúsculas señales que genera el cuerpo y transmitiéndolas después a un sistema externo de lectura de datos. Este tipo de dispositivos puede utilizarse para vigilar y gestionar las señales que provienen de los pacientes y para obtener lecturas precisas en entornos eléctricos ruidosos (tales como las salas de operaciones). En el siguiente trabajo se muestra una aplicación de un sistemas de comunicación inalámbrica aplicado a la medición y monitoreo medico a través del Bluetooth.
Measurements of arterial and venous pressure have evolved over time, from noninvasive measures performed with the sphygmometer to methods such as the cuff to processes that warrant the placement of intravenous catheters such as cardiac catheterization and placement of Swan-Ganz catheter (SG) (Tortora et al., 2001; emsp Pepine et al., 1992; emsp Maldonado et al., 2008; emsp Chatterjee et al, 2009; emsp Córdova et al., 2012). Hemodynamic monitoring is essential for medical evaluation of the clinical routine, particularly in critically ill patients and thereof. So, there is a need to find a method capable of performing measurements of the vascular mechanical activity in real time, it should be similar to catheterization evaluation, furthermore they should be noninvasive and with graphical information displayed on a screen. On the other hand, wireless communication between electronic devices and systems is increasingly used in different areas. For example, cell phones, computer networks, industrial sensors and biomedical measurement systems, to name a few examples of these technological advances. Particularly, the portability of the current medical devices could avoid cables that currently are a disadvantage in hospital rooms.
A wireless system can consist of wide-area wireless networks (WWAN), i.e. cellular systems, wireless local area networks (WLAN) (IEEE 802.11a, b, g) and wireless personal area networks (WPAN) Bluetooth, Zigbee (Vijay et al., 2007). In March 1999, the working group was created (IEEE 802.15), which has developed communication standards for wireless personal area networks (WPAN). In July of that year, Bluetooth was chosen as the first standard of the group and served as the basis for the new standard (IEEE 802.15). It was associated with the Bluetooth standard (IEEE 802.15.1) (Chatschik et al., 2001).
Completely wireless scenarios can be achieved due to the nature master-slave Bluetooth technology, where all devices are equal, identified by its own unique address 48 bits, and can be assigned as a teacher, either by function or user intervention. In particular, a teacher can connect up to seven slaves at the same time, forming a piconet point-to-multipoint. A group of piconets, no more than ten, is referred to as scatternet. This feature is what makes it different from other Bluetooth wireless technology advances (Kammer et al., 2002).
Wireless communication devices and medical monitoring measurements are increasingly used and accepted by medical staff in hospitals or outside them, as well as other providers of health care around the world (Vijay et al., 2007; emsp Amoore et al., 2008; emsp Contreras et al., 2010).
This work presents a wireless device and its potential to record biosignal of the mechanical activity and hemodynamics for arterial and venous biological systems, their wave shape in healthy volunteers, as well as the implementation of wireless communication of Bluetooth for viewing and registering data.
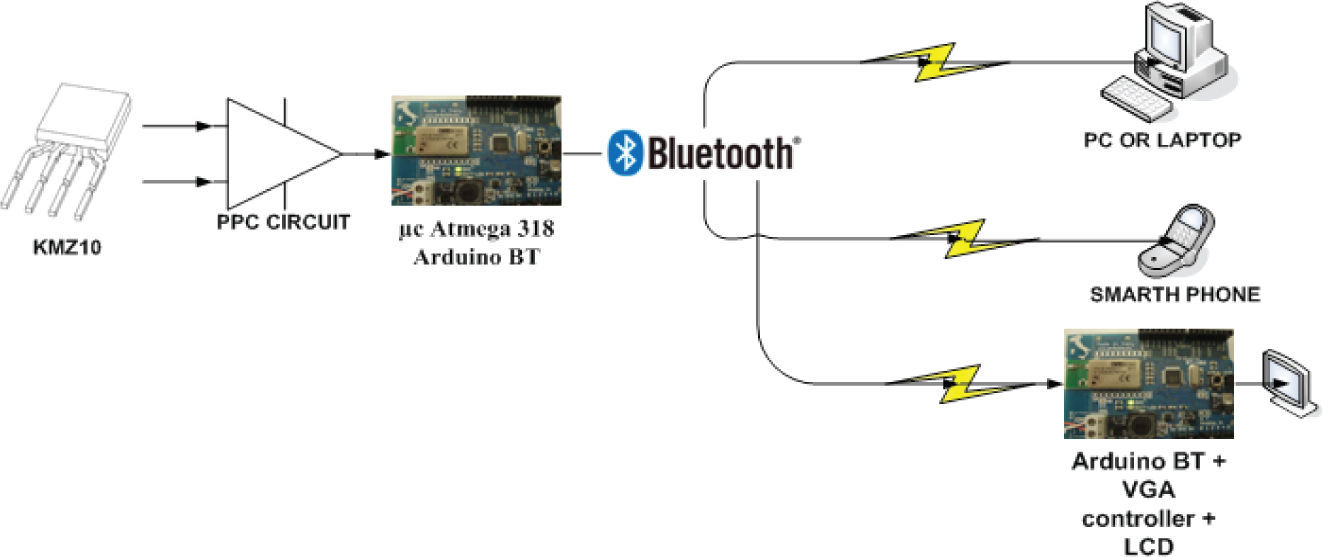
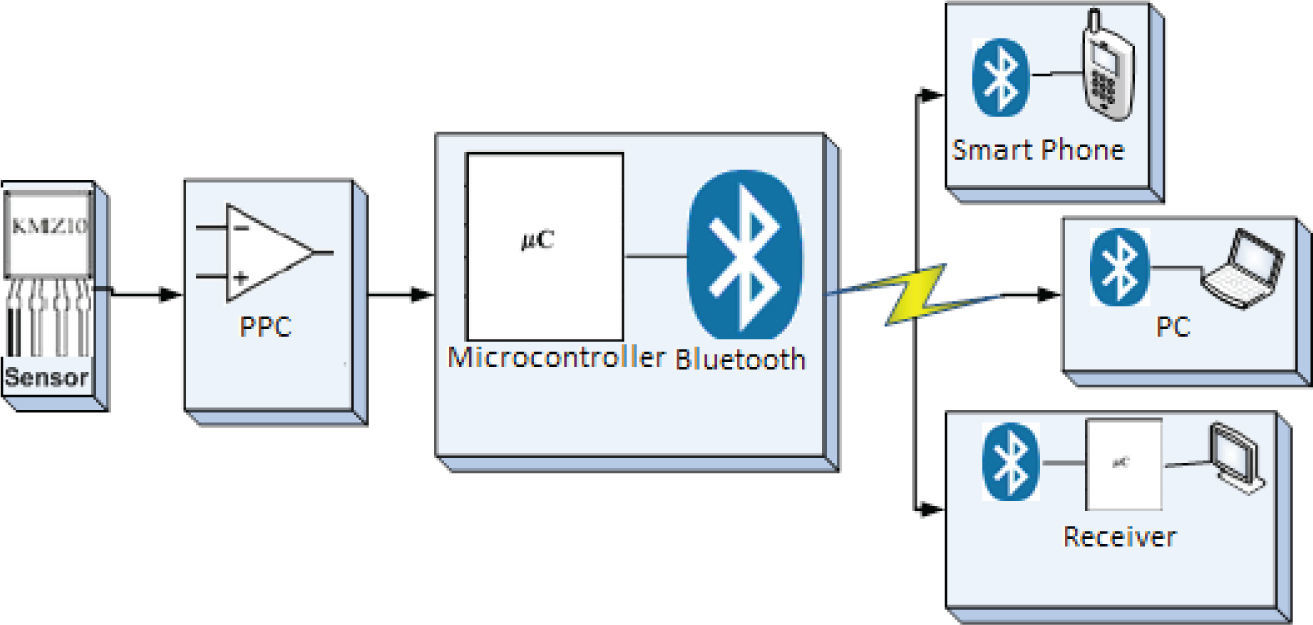
Transferring of biosignalsThere is a device developed in our laboratory (Maldonado et al., 2008), called PPC (pulse pressure gauge heart) which bases its operation that uses the sensor magnetometer KMZ10 Philips, of second generation, it was updated in order transfer recorded biomagnetic signals to three potential recipients: i) smart phone, ii) personal computer and iii) portable device developed to measure the implementation. Besides wireless communication the use of Bluetooth technology was implemented. The biomedical signal is transferred from PPC to medical staff according to the diagram shown in Figure 1, and the block diagram in Figure 2.
 Bluetooth to i) pc, ii) smart phone, and iii) LCD display")

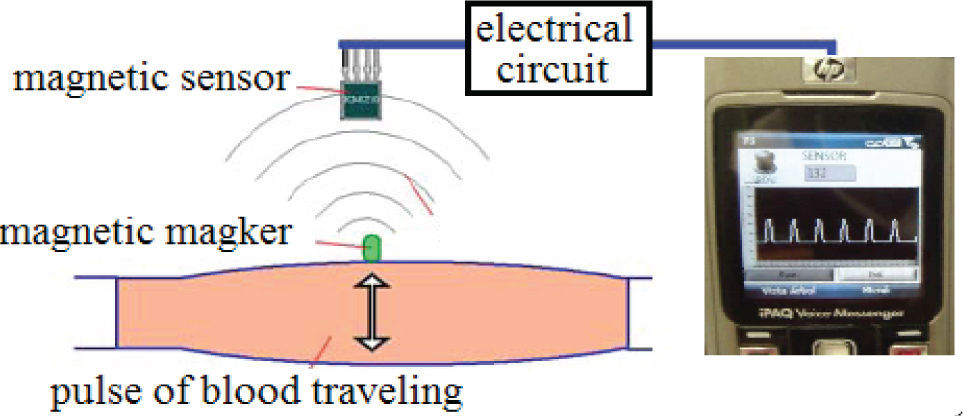
The protocol of the biomeasurements demand a patient in semi-Fowler position, a magnetic marker is placed just above the blood vessel, as shown in Figure 3. The magnetometer from the PPC, without surface contact with the magnetic marker, performs the registration of biosignal and transmits it to the Audino BT card, then to each recipient, as it is shown in Figure 1.

In order to have a wave shape similar to that recorded with the catheterized technique, the gold standard technique in this kind of studies, the measurement needs to be carried out just on a blood vessel near to the heart.
This measurement is performed for 60 seconds. Thus, it is possible to get information on raw data or in some cases a data processing is performed on them.
Electronic circuit design PPCThe PPC circuit is divided into 5 stages which, together, they filter and amplify KMZ10 the signal from the sensor, and then, it can be displayed on a screen and/or recorded.
- a)
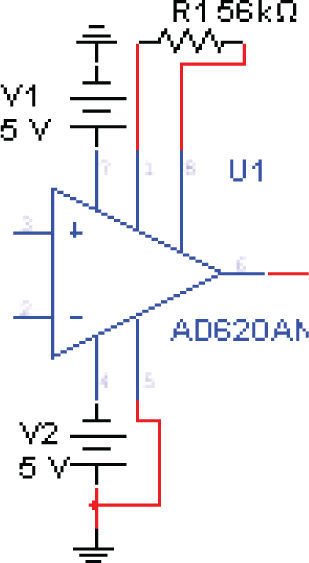
The first stage (Figure 4) consists of a differentiator instrumentation, through an operational amplifier AD620, with a gain G = 1.8 (Eq. 1), obtained by placing a resistor, R = 56KΩ, on the gain characteristic of the amplifier, the sensor is connected directly KMZ10 in the non-inverting inputs and investment in this circuit.
- b)
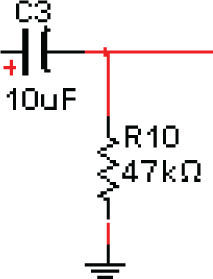
In the second stage (Figure 5) a passive high pass filter to 0.338Hz using a 47kΩ resistor and a 10μF electrolytic capacitor (Eq. 2) is included.
- c)
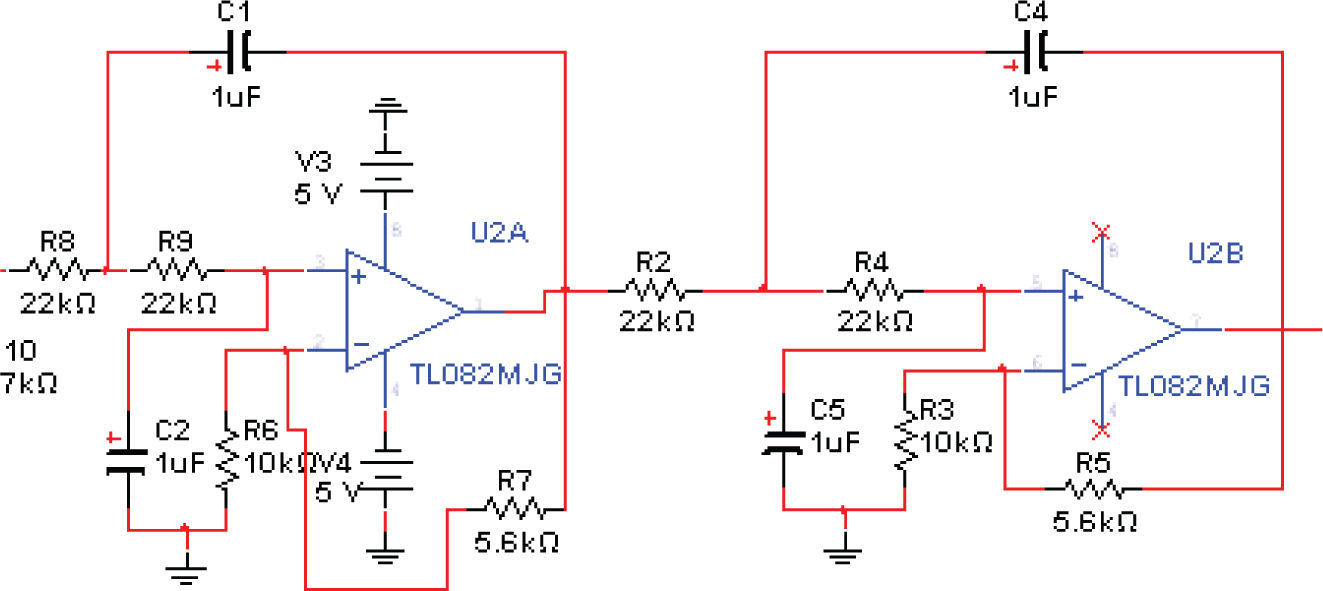
The third stage (Figure 6) is a fourth-order active filter low pass with a cutoff frequency of 7.23Hz using a TL082 operational amplifier which contains two OPAMP, to achieve the desired frequency using 22kΩ identical resistors and capacitors of 1μF. The formula used to calculate the cutoff frequency is Eq. (2).
- d)
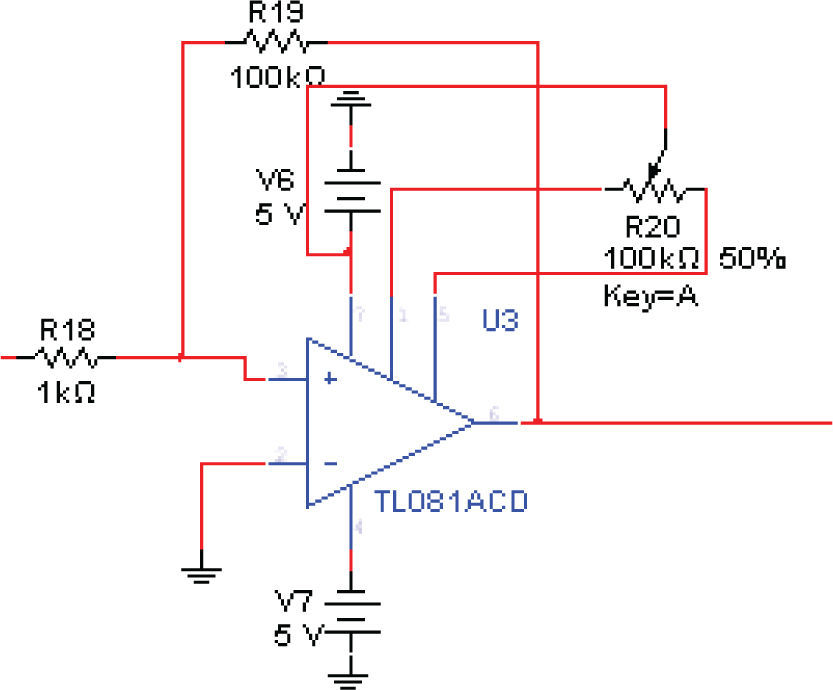
In fourth stage (Figure 7), a non-inverting amplifier with a constant gain G = 101, which can be adjusted so that you can modify your level of offset by a R = 100kΩ potentiometer and a TL081 OPAMP, the signal is amplified and be able to view it record the data properly, otherwise it would be impossible to treat the signal Eq. (3).
- e)
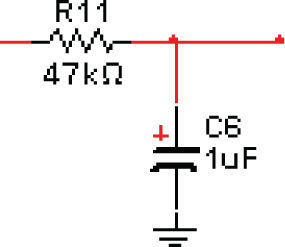
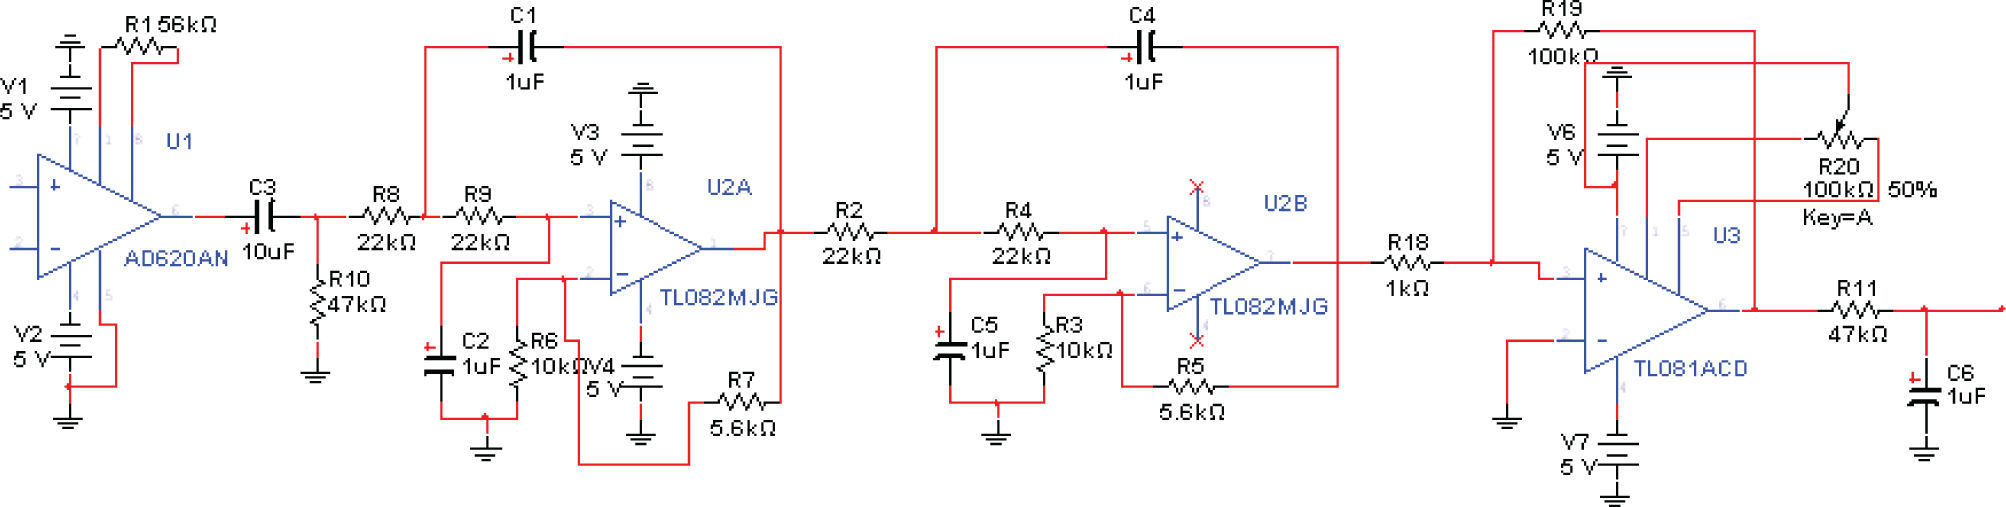
Finally, the fifth stage (Figure 8) is a passive lowpass filter with a cutoff frequency of f = 3.38Hz, this implementation is used to filter any unwanted signal that is amplified in the fourth stage. A R = 47kΩ resistor and an electrolytic capacitor C = 1.0μF are used. To calculate the cutoff frequency Eq. (2) was applied, the output of this stage is used to plot the signal and try to send data via Bluetooth. Figure 9 shows the complete schematic of PPC.


The wireless communication in this implemented device is done via Bluetooth technology; multiple mobile devices, computers, among others, are able receive the transfer of biosignals through this communication protocol. The development of communication is divided into 4 stages, which take place with the interaction to view and record the signal sent by the PPC.
- a)
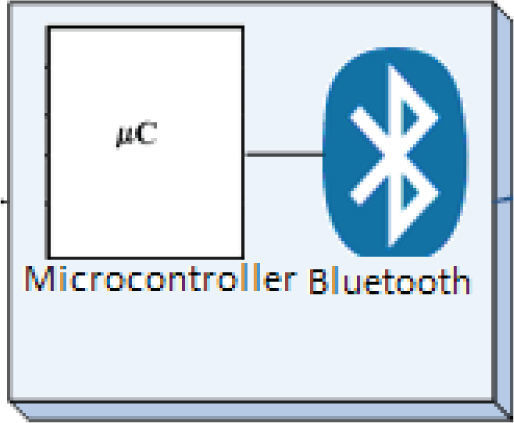
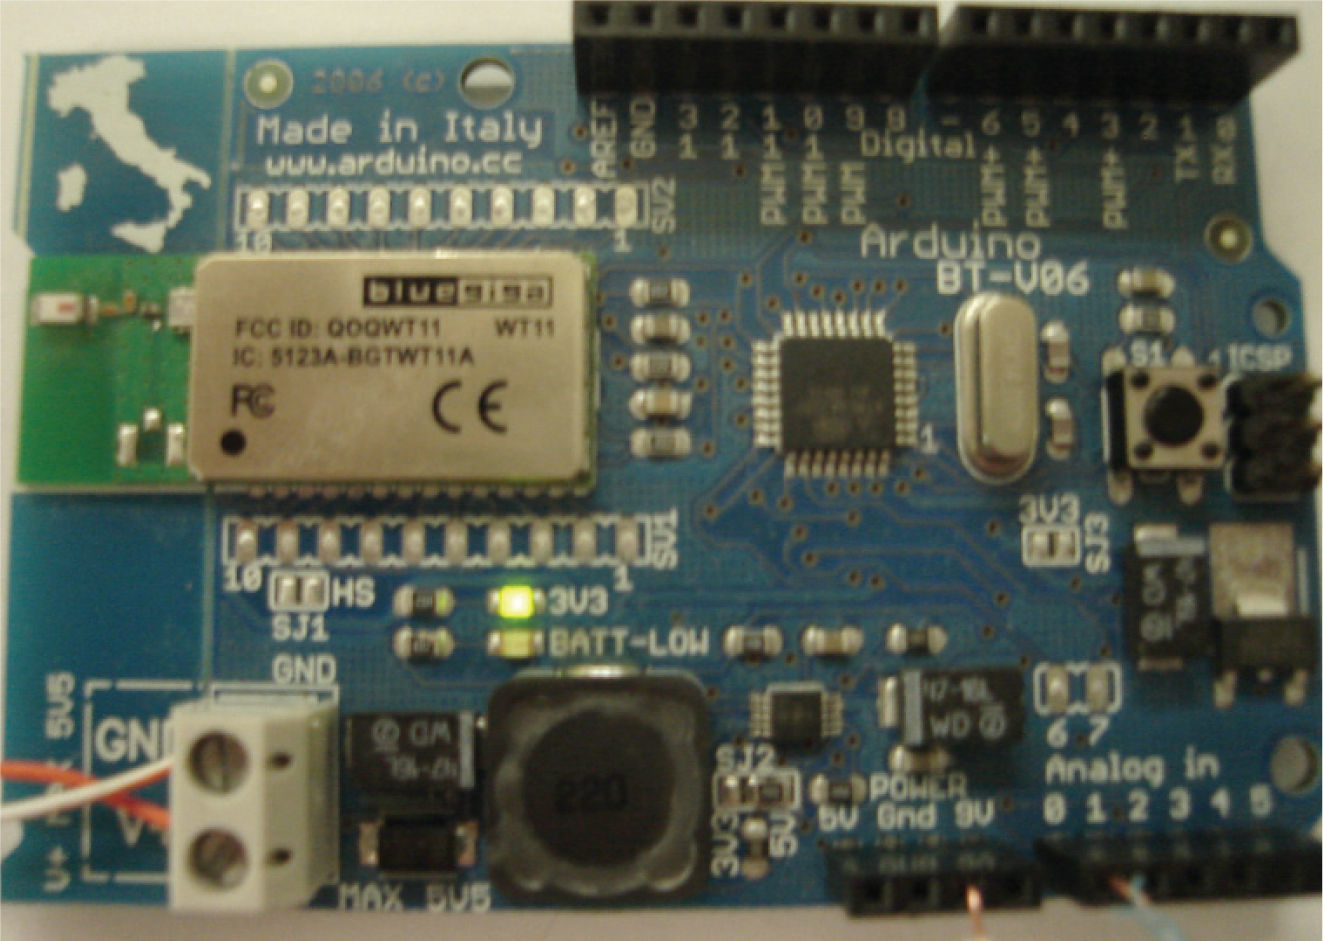
The first stage is the development of a Bluetooth transmitter; one slave device takes the signal from the PPC circuit and sends it to the later stages. For this stage ATMEGA 328 microcontroller mounted on an Arduino BT was used, the microcontroller takes the PPC signal output through an ADC (analog- digital converter) and converts the numeric data sent via the serial protocol and UART port that has the proper microcontroller, the Arduino BT was set up as a Bluetooth transmitter Bluegiga-WT1, which takes data from the microcontroller and sends it to different devices (Figure 10).
- b)
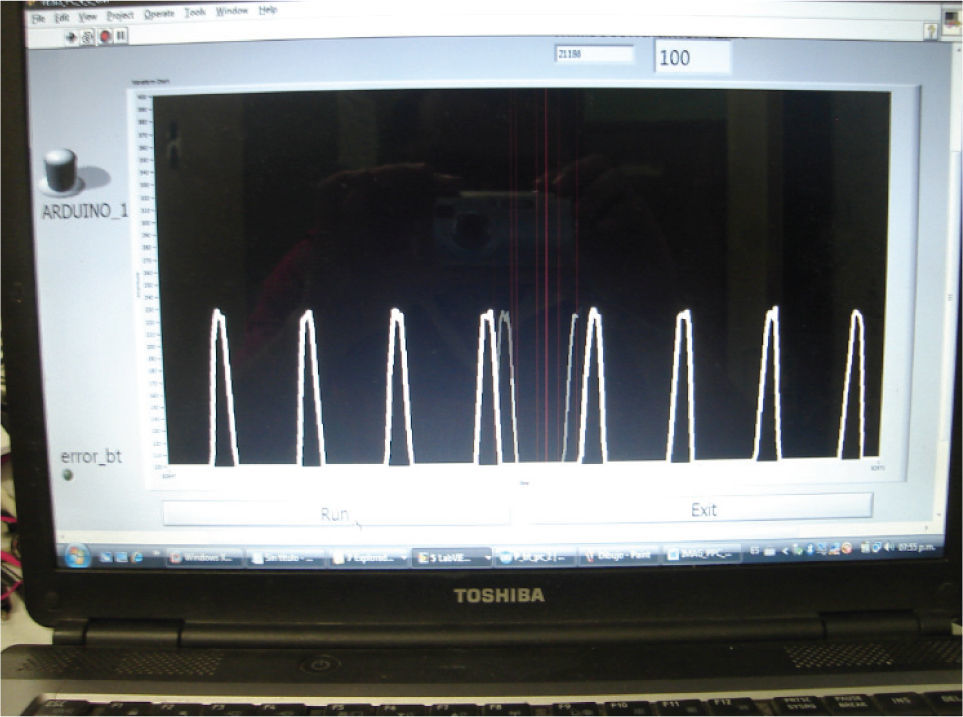
The second stage consists of a laptop or a PC that acts as a master in the wireless communication and connects to the sending device of stage one, receives the data sent by the Arduino BT and uses an interface developed in LabVIEW 2009; also, the data shows a graph and is stored as a. dat file for further analysis. We used the Bluetooth communication functions in LabVIEW therefore, almost all the control is done from the same software, and the system can be configured to store from 100 to 1000 samples per second, in this study 300 samples per second were established (Figure 11).
- c)
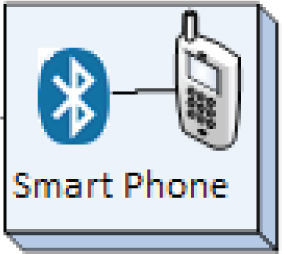
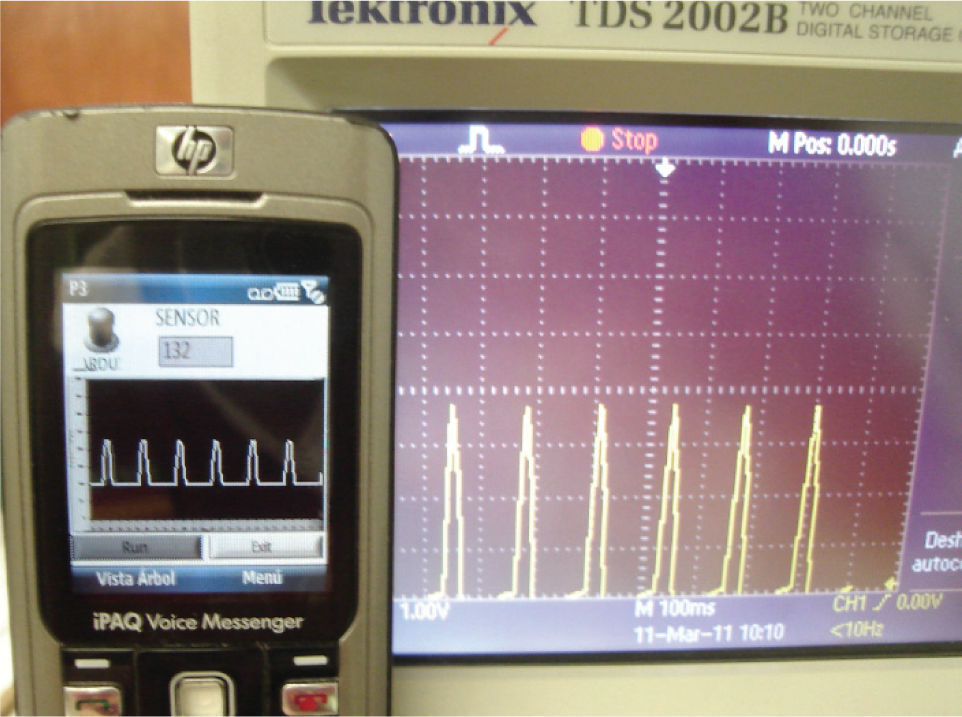
The third stage consists of a mobile device that acts as a teacher and works exactly the same way that the device developed in the second stage, and in a similar way the interface is developed in the Lab- VIEW software 2009. The smart phone should be used with a Windows Mobile operating system in any version (Figure 12).
- d)
In the fourth stage, which is still in development, a device to measure has been implemented, as in the first stage an Arduino BT is used, but it is configured as a teacher, it takes the data received and displayed in a LCD screen for viewing and interpretation (Figure 13).

, which takes the data sent for Arduino BT and graphical through interface developed with LabView software")


In order to show the efficiency of the device, it a signal of 1.3Hz from a function generator was simulated. it performs the communication with a smart phone interface to display the acquired data. In Figure 14, the Arduino which sends the information to the phone or PC is shown.

In Figures 15 and 16 the acquired signal display on both, phone and/or PC (laptop) is shown.
Discussion and conclusions

Wireless Telemetry means the transmission of data between two machines, automatically or on demand, using a wireless network for monitoring and control purposes. Sending information to the operator in a telemetry system is typically performed using wireless communication, but can also be performed by other means (telephone, computer networks, fiber optic link, etc.). Telemetry systems receive instructions and data required to be operated by remote commands. This system allows the transmission of data wirelessly to various applications of remote telemetry and remote operations that require providing physicians the ability to control, monitor, measure and remote command. A telemetry system usually consists of a transducer as an input device, a means of transmission lines as cable or radio waves, signal processing devices, recording devices and data visualization. The transducer converts a physical quantity such as temperature, pressure or vibration into an electrical signal that is transmitted at a distance for the purpose of measuring and recording.
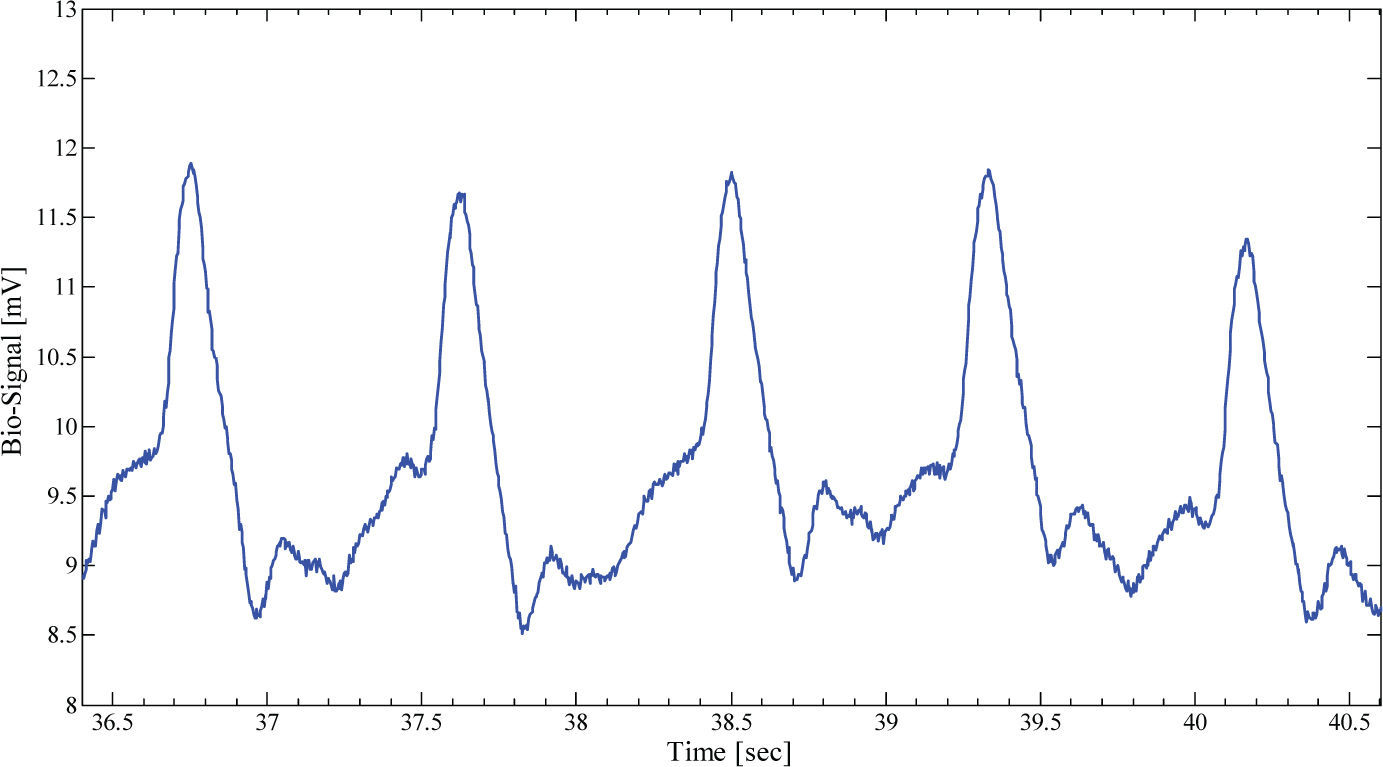
It is concluded that the development and implementation of the system would have the potential to record mechanical activity from arterial (Figure 17) and venous, hemodynamic, by analyzing the wave amplitude implementing wireless communication via Bluetooth for viewing and recording of data. A medical doctor may at any time revise the signals originated in monitoring a patient without being in his presence. The integration of common medical monitoring devices with wireless connectivity systems and information technology, taking advantage of cellular networks to transmit voice and data have emerged to provide mobility and availability of communication. Bluetooth is one of the technologies developed to provide wireless communication in areas of personal use. The goal of Bluetooth is to transmit voice or data between computers or circuits with inexpensive radio, through a range about ten to one hundred meters, using little energy. The effective range varies due to propagation conditions, material coverage, production sample variations, antenna configurations and battery conditions. However, its use goes beyond the elimination of cables, since it is flexible enough to allow the creation of multiple applications.

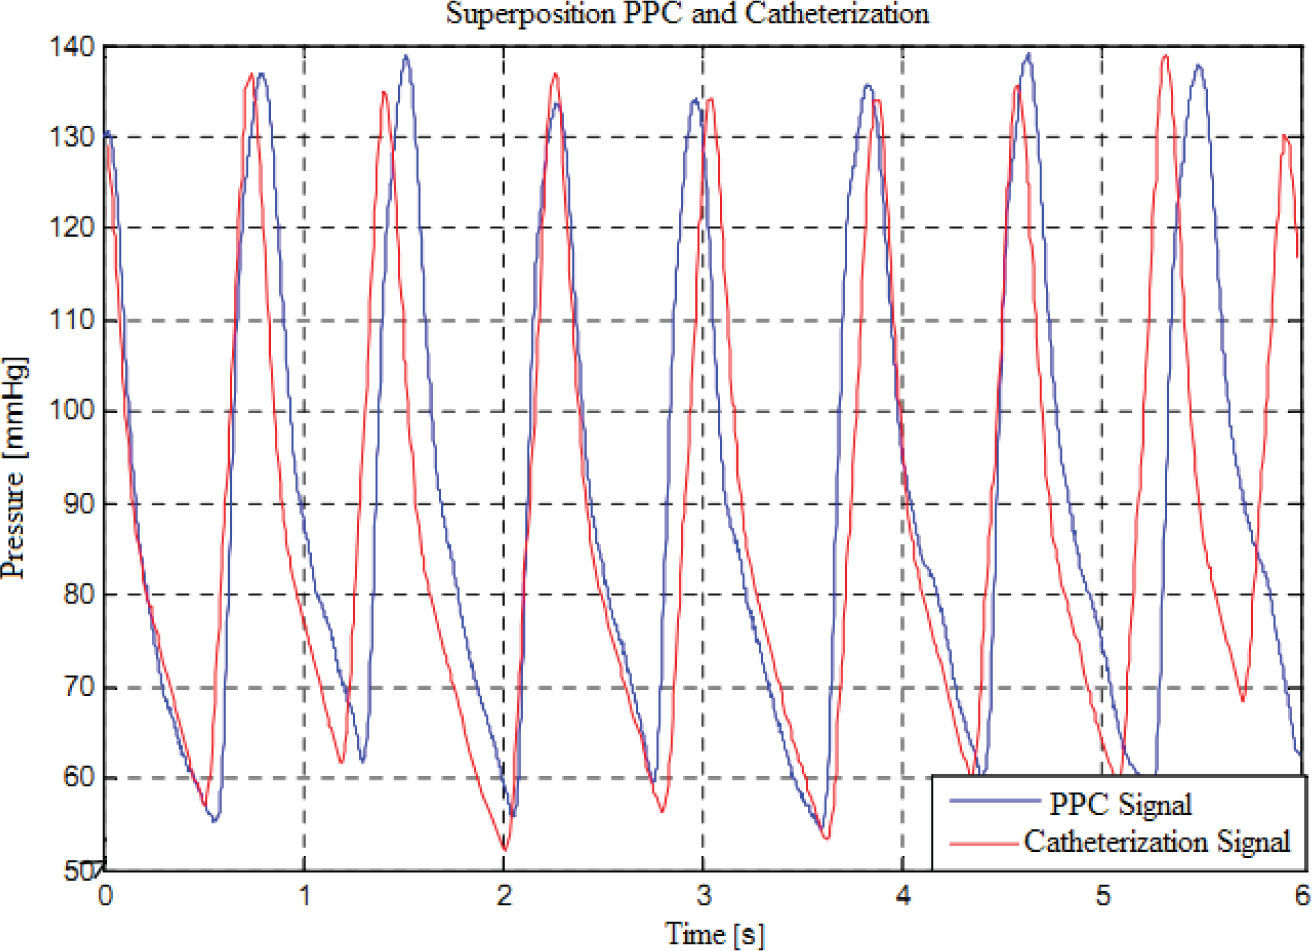
In the cardiac catheterize lab of the highly specialized medical unit (HSMU) No.1 at the Mexican Social Security Institute (IMSS), printed data were obtained from the pressure curves recorded by catheterization in 7 patients. Figure 18 shows one of the curves obtained simultaneously with the wireless communication and the polygraph in a cardiac catheter intervention, considered the gold standard (Córdova et al., 2012).

Finally, the above procedure can be easily adapted to other electrical signals like electrocardiogram (ECG) or electroencephalography (EEG).
Authors want to thank DAIP under grant number 000017/10, FESE 2010, UDLS Bajío 2010 and Instrumentación en física médica-DAIP 2012 for their partial financial support.
He obtained the degree of doctor in physics at the University of Guanajuato with a research stance for a year at the University of SaoPaulo. Currently, he is a professor at the Department of Engineering & Physics,Division of Science and Engineering, Universidad de Guanajuato campusLeón. His research interests include: bioelectrical records, signal processing,medical imaging, medical physics and biomedical communication.
Chicago citation style: Cordova-Fraga, Teodoro, José Francisco Gómez-Aguilar, José Octavio Zaragoza-Zambrano, Modesto Sosa-Aquino, Carlos Ricardo Contreras-Gaytán, Jesús Bernal-Alvarado. Wireless Implementation for Monitoring the Bio-Signal Shape of Blood Vessels. Ingeniería Investigación y Tecnología, XV, 01 (2014): 11-19.
ISO 690 citation style Cordova-Fraga T., Gómez-Aguilar J.F., Zaragoza-Zambrano J.O., Sosa-Aquino M., Contreras-Gaytán C.R., Bernal-Alvarado J. Wireless Implementation for Monitoring the Bio-Signal Shape of Blood Vessels. Ingeniería Investigación y Tecnología, volume XV (issue 1), January-March 2014: 11-19.
He obtained the degree of doctor in Physics in theDivision of Science and Engineering Campus León, University of Guanajuato.He currently works in the Department of Electrical Engineering, Division ofEngineering, University of Guanajuato, Campus Irapuato-Salamanca. His interestsare bioelectrical records, signal processing, medical imaging, medicalphysics and biomedical communication.
He obtained the degree of electronics engineeringat De La Salle Bajio University. Currently, he is studying a master’s in computerand electronic systems at the same university. Also, He works at the TechnologicalUniversity of Leon as a professor in the department ofelectromechanical engineering. At the same time, he is working in the ScienceDepartment at the University of Guanajuato as a developer partner. He is interestedin the development of biomedical measurement devices and the implementationof robotics in medicine.
He obtained the degree of doctor in science at the University of Guanajuato. Currently, he is a professor at the Department of Engineering Physics, Division of Science and Engineering, Universidad de Guanajuatocampus León. His interests include medical physics and biomedical communication.
He obtained the master’s degree in engineering atthe De La Salle Bajio University. He currently works in the Faculty of ComputerEngineering and Electronics, De La Salle Bajio University campus Campestre.His main interest includes embedded systems, DSP’s, SCADA systems,programming for mobile devices and programming in C and G languages.
He obtained the degree of doctor of science at the University of Guanajuato. He currently works in the Department of Engineering Physics, Division of Science and Engineering, Universidad de Guanajuato, campusLeón. His interests include medical physics and biomedical communication.