Wavelet transforms are widely used for texture feature extraction. For dyadic transform, frequency splitting is coarse and the orientation selection is even poorer. Laws’ mask is a traditional technique for extraction of texture feature whose main approach is towards filtering of images with five types of masks, namely level, edge, spot, ripple, and wave. With each combination of these masks, it gives discriminative information. A new approach for texture classification based on the combination of dyadic wavelet transform with different wavelet basis functions and Laws’ masks named as Multi-resolution Laws’ Masks (MRLM) is proposed in this paper to further improve the performance of Laws’ mask descriptor. A k-Nearest Neighbor (k-NN) classifier is employed to classify each texture into appropriate class. Two challenging databases Brodatz and VisTex are used for the evaluation of the proposed method. Extensive experiments show that the Multi-resolution Laws’ Masks can achieve better classification accuracy than existing dyadic wavelet transform and Laws’ masks methods.
Texture is a repetition of intensity patterns present in an image. It is one of the significant visual characteristic and a rich source of information for any image analysis. Hence, it is a vital element in many areas of applications, such as object recognition, content-based image retrieval, remote sensing, image segmentation, medical image analysis, automated inspection, document processing and so on. An important step in the classification of texture is the extraction of feature. The different types of feature extraction techniques for texture identification are structural (Haralick & Shapiro, 1992), statistical (Haralick, 1979), geometrical (Pikaz & Averbuch, 1997), model-based (Mao & Jain, 1992) and signal processing (Laine & Fan, 1993). Gaussian Markov random fields (GMRF) and Gibbs random fields are also proposed to characterize textures (Cross & Jain, 1983; Kashyap & Khotanzed, 1986). In addition, local linear transformations are utilized to compute texture (Laws, 1980a; Unser, 1986). The traditional statistical approaches for texture analysis have limitations to spatial interactions over small neighbourhoods on a single scale only.
In the field of multi-resolution analysis, wavelet analysis has become a powerful tool during the past decades. The wavelet transformation provides a precise and unifying framework for the analysis and characterization of signals at different scales. The discrete wavelet transform of an image simultaneously reserves the time and frequency domain information of the signal and efficiently extracts the key features of the image. Several multi-resolution and multi-channel transform algorithms have been used for texture classification such as dyadic wavelet transform (Arivazhagan & Ganesan, 2003; Mallat, 1989a, 1989b), wavelet frame transform (Unser, 1995), Gabor filters (Jain & Farrokhnia, 1991; Manjunath & Ma, 1996), steerable pyramids (Simoncelli & Freeman, 1995) and fusion of multi-resolution methods (Li & Shawe-Taylor, 2005). The signal processing techniques rely mainly on texture filtering to analyze the frequency content either in spatial domain (Laws, 1980b; Unser, 1986) or in frequency domain (Bajcsy & Lieberman, 1976). Among the multi-resolution techniques, discrete wavelet transform is not translation-invariant (Xiong, Zhang, & Moon, 2000).
Although the aforementioned methods proved to deliver good classification accuracy, recently some authors have introduced hybrid models jointly by combining the traditional techniques with multi-resolution techniques for an additional improvement of texture classification. Few examples of hybrid models proposed are Multi-scale grey level co-occurrence matrices for texture description, Multi-resolution LBP (Ojala, Pietikainen, & Maenpaa, 2002), Gaussian image pyramid-based texture features and Multi-scale Co-occurrence Local Binary Pattern. (Siqueira, Schwartz, & Pedrini, 2013; Yadav, Anand, Dewal, & Gupta, 2015a, 2015b; Qi, Shen, Zhao, Li, & Pietikainen, 2015).
The Laws’ masks awareness also known as energy filters as conveyed by K.I. Laws, where he has suggested towards the filtering of images with specific masks created from the combination of one-dimensional kernel vector in order to assess the texture properties (Laws, 1979, 1980a). In the medical image analysis, Laws’ masks have received wide acceptance (Elnemr, 2013; Rachidi et al., 2008) but for texture classification, Laws’ masks have resulted very poor classification accuracy. Pietikainen has found that the performance of texture energy measures depends on the general forms of the masks rather than on their specific values (Pietikainen, Rosenfled, & Davis, 1983). To find the local rank order correlations of images with appropriate image and mask sizes, Laws’ masks could achieve better result than achieved by the basic convolutions as reported by Harwood (Harwood, Subbarao, & Davis, 1985). Ade has considered different methodologies associated with Laws’ measures while characterizing textures by using Eigenfilters (Ade, 1983). Comparative studies carried out by Buf and Ng have reported that Laws, Haralick and Unser methods provide better results for texture features (Buf, Kardan, & Spann 1990; Ng, Tan, & Kittler, 1992). In 1995, Harwood et al. have suggested a new method of texture analysis based on a local centre-symmetric covariance analysis, using Kullback (log-likelihood) discrimination of sample and prototype distribution (Harwood, Ojala, Pietikainen, Kelman, & Davis, 1995). This method can be viewed as a generalization of Laws’ approach and the results are compared with that of Laws’ measures. The experiments are carried out with 24 different Laws’ (5×5) masks, and the classification error rates of 25.9% (image size of 64×64) and 39.2% (image size of 32×32) are achieved on Brodatz database. Sharma and Singh have shown maximum classification accuracy of 83.30% by using Laws’ mask method for MeasTex database with k-NN as classifier (Sharma & Singh, 2001). The same authors Singh and Sharma have done another experiment with MeasTex and VisTex benchmarks with different texture descriptors. They have stated that by utilizing Laws’ mask descriptor, the classification accuracies for MeasTex database are 82.80% with linear classifier, 75.10% with k-NN as classifier on original data and 69.30% with k-NN as classifier on PCA data. The classification accuracies for VisTex database are 68.80% with linear classifier, 56.10% with k-NN as classifier on original data and 53.20% with k-NN as classifier on PCA data (Singh & Sharma, 2001). Ertugrul has described adaptive texture energy measure. By employing adaptive texture energy measure best classification accuracy of 68.43% is obtained on Brodatz database (Ertugrul, 2014).
As we have examined our proposed method with Brodatz and VisTex database, a brief review on recently developed methods that classify these two databases are discussed. Qiao et al. have proposed a new method for extraction of texture features with a combination of the phase difference and the magnitude variation information of the complex wavelet coefficients, and then modelled the measure with the real generalized Gaussian distribution (GGD). They have verified the proposed method with two different datasets created from Brodatz database with different sizes of images and the third dataset is created from VisTex database with k-NN as classifier. The best classification accuracies achieved are 92.1% on the first dataset of Brodatz and 83.1% on the second dataset of Brodatz. Classification accuracy of 84.6% is obtained on VisTex database (Qiao, Zhao, & Song, 2009). Dong and Ma have suggested a new method for feature extraction through contourlet subband clustering for texture classification. They have evaluated the proposed method with two different datasets created from Brodatz database and two different datasets created from VisTex database, and obtained different classification results from each created databases using k-NN as classifier. They have achieved classification accuracy of 99.92% on the first dataset and 96.81±0.44% on the second dataset of Brodatz database. The best classification accuracy of 99.25±0.38% is obtained on the first dataset and 85.95±1.50% on the second dataset of VisTex database (Dong & Ma, 2013). Susan and Hanmandlu have proposed a new method of probabilistic non-extensive entropy feature for texture characterization and achieved highest classification accuracy of 97.78% on Brodatz database using SVM as classifier (Susan & Hanmandlu, 2013). Yuan has recommended a rotation and scale invariant local binary pattern by collectively considering high order directional derivatives, circular shift sub-uniform, and scale space. The proposed method delivered highest classification accuracy of 75.2% on Brodatz database (Yuan, 2014). Murala and Wu have proposed a combination of Gabor transform with robust local binary (RLBP) operator and the maximum classification accuracy is found to be 84.92% on Brodatz database and 93.25% on VisTex database (Murala & Wu, 2014). Zhang et al. have recommended a technique by combining spiking neural network and Fast wavelet transform (SNN-FWT), and obtained best classification rate of 98.93% on Brodatz database with k-NN as classifier (Zhang, Wu, Zhuo, Wang, & Huang, 2015). Florindo et al. have recommended combinations of traditional texture descriptors with non-additive entropy. They have achieved best classification accuracy of 92.51% on Brodatz database and 93.52% on VisTex database with a combination of grey level co-occurrence matrix (GLCM) with non-additive entropy using Linear Discriminant Analysis (LDA) as classifier (Florindo, Assirati, & Bruno 2015). Tang et al. have suggested a new texture extraction method combining non-overlap window local binary pattern and grey level co-occurrence for green tea leaves classification, where they have also verified the proposed method on Brodatz database. They have achieved maximum classification accuracy of 94.8% on Brodatz database with back propagation neural network as classifier (Tang et al., 2015).
A thorough literature review in texture classification concludes that Law's mask descriptor provides poor classification accuracy for texture classification (Ojala, Pietikainen, & Harwood, 1996; Ojala, Pietikainen, & Nisula, 1996; Vidya, Ramón, & Praveen, 2000). In addition, the study reveals that there has not been any further research for the improvement of texture classification by using Laws’ mask method.
This paper presents a new approach for extending Laws’ mask to multi-resolution representation. Two existing texture descriptors, dyadic wavelet transform (DWT) and Laws’ mask are integrated for the extension and that is named as Multi-resolution Laws’ Masks (MRLM) method. The proposal is assessed by comparing the performance of the classical approaches with MRLM approach. Two benchmark texture datasets: Brodatz and VisTex are considered to verify the effectiveness of the proposed method. Simple k-nearest neighbor (k-NN) classifier is employed for texture classification. The experiments carried out in this paper are as follows:
- a.
The first experiment deals with the performance evaluation of the traditional DWT method. DWT with different wavelet basis functions (db1, db4, db8, coif1, coif4, sym2) are applied on two sets of texture databases. Then, statistical features such as mean and standard deviation are extracted from the decomposed images for different levels.
- b.
The second experiment deals with the performance evaluation of the traditional Laws’ mask method. The Laws’ mask descriptors having 15 numbers of masks and 25 numbers of masks are directly applied to the texture images of two datasets. The output results are then passed through three different types of energy measurement filters. Then after normalization, statistical features like absolute mean, mean square and entropy are extracted from different energy measurement filters.
- c.
The third experiment evaluates the effectiveness of the proposed MRLM method. DWT with different wavelet basis functions (db1, db4, db8, coif1, coif4, sym2) are applied on two sets of texture databases. Then, Laws’ masks descriptors are applied on the decomposed images obtained at different levels with different wavelet functions. The output results are then passed through three different types of energy measurement filters. After normalization, statistical features like absolute mean, mean square and entropy are extracted from different energy measurement filters.
The results show that the MRLM approach is capable of providing higher classification accuracy than the traditional DWT and Laws’ masks methods for both the databases. The major steps involved to accomplish the process are texture feature extraction, feature normalization and classification.
The organization of this paper is as follows: Section 2 takes a brief review of 2D-DWT and Laws’ masks. Section 3 describes the proposed method. Section 4 presents details of experimental results. Conclusions are drawn in section 5.
2Review of dyadic wavelet transform and Laws’ Masks method2.1Dyadic wavelet transformThe 2D-DWT is a multi-resolution analysis and decomposes images into wavelet coefficients and scaling functions. Dyadic wavelet decomposition is achieved using 2 channel filter banks composed of a low-pass (G) and high-pass (H) filter and each filter bank is then sampled at a half rate of the previous frequency. DWT transforms the original image into four subimages namely low-low (LL), low-high (LH), high-low (HL) and high-high (HH) through low pass filters and high pass filters. An example of DWT with two levels of decomposition is shown in Figure 1. Every subimage contains information of a specific scale and orientation. The original image is thus represented by a set of subimages at several scales for which they are called the multi-scale representation. Because the images are dilated by a factor of two, this is also known as dyadic wavelet transform. The features obtained from these DWT transformed images are useful for texture analysis. A number of basis functions are used as the mother wavelet for wavelet transformation. The mother wavelet determines the characteristics of the resulting wavelet transformation. Some of the wavelet functions that are used for wavelet transformation are Haar, Daubechies, Symlet, Coiflets, Bior, Meyer, Morlet, etc. The oldest and the simplest wavelet is the Haar wavelet. The Daubechies wavelets are the most popular wavelets. The Haar, Daubechies, Symlet and Coiflets are compactly supported orthogonal wavelets. The wavelets are selected on the basis of their shape and ability to analyze the signal in particular application.
2.2Laws’ masksLaws observed that certain gradient operator such as Laplacian and Sobel operators accentuate the underlying microstructure of texture within an image. This is the foundation for a feature extraction scheme where a series of pixel impulse response arrays are obtained from combinations of 1-D vectors. Laws’ properties, which he called “texture energy measures”, are extracted from three simple vectors of length 3, L3(1, 2, 1), E3(−1, 0, 1), and S3(−1, 2, −1), which represent the one-dimensional operations of centre-weighted local averaging, symmetric first differencing (edge detection), and second differencing (spot detection) respectively. If we convolve these vectors with themselves or each other, we obtain five vectors of length 5:
L5(1,4,6,4,1)=L3*L3, S5(−1,0,2,0,−1)=−E3*E3=L3*S3, R5(1,−4,6,−4,1)=S3*S3, E5(−1,−2,0,2,1)=L3*E3 and W5(−1,2,0,−2,1)=−E3*S3. Sets of more number of vectors can be defined by repeating this convolution process. Therefore, there are five types of masks namely Edge (E), Level (L), Spot (S), Ripple (R) and Wave (W). From these set of masks 25 different masks are produced. These masks are subsequently convolved with a texture image to accentuate their microstructure giving an image from which the energy of the microstructure arrays is measured together with other statistics.
3Proposed Multi-resolution Laws’ Masks (MRLM) methodThe prime objective of this investigation is to assess the performance of the proposed MRLM technique for extraction of texture features by integrating DWT and Laws’ mask, the two existing texture descriptors. The texture features are classified by k-NN classifier. MRLM method is introduced for further enhancement of classification accuracy than the traditional dyadic wavelet transform and Laws’ masks methods. The procedural steps of the proposed method are given in Figure 2.
In the first step called the pre-processing step, database is generated by splitting of the original image into subimages. In the second step, texture images are decomposed through DWT up to three levels by incorporating different wavelets like Daubechies (db1, db4, db8), Coif (coif1, coif4) and Symlet (sym2). The decomposition process divides the grey scale image into four identical subbands, viz., approximation (LL), horizontal (LH), vertical (HL) and diagonal (HH) components of equal size at the first level of decomposition. Most of the image energy is concentrated in the low frequency subband LL. On the other hand, the high frequency subbands LH, HL and HH contain edges and texture of the images. Then, LL component is further decomposed into four equal sizes of subimages (LL1, LH1, HL1, HH1) at the second level of decomposition. This procedure of the subdividing is repeated until the third level of decomposition is reached. We select all the subbands from each decomposition level and the resulted transformed images of all the subbands are used for further analysis by employing Laws’ masks method. In the third step, the transformed images obtained from the four subbands are convolved with Laws’ masks. There are five types of masks, as mentioned earlier: Level (L), Edge (E), Spot (S), Ripple (R) and Wave (W). Thereafter the convolved outputs are passed through texture energy measurement filters. The convolved outputs are passed through three types of energy measurement filters (Elnemr, 2013), which are described as follows:
where μ presents the mean filter, μabs presents the absolute mean filter, σ presents the standard deviation filter, Np presents the neighbouring pixels and N presents the window size. The texture feature vectors acquired from each energy measurement filters resulting different ranges of values, which are normalized by min–max normalization method, thus contributing it in the form that is applicable as an input to the classifier. For each normalized feature vector, we evaluated three most important statistical features that are represented as textural parameters: absolute mean (ABSM), mean square or energy (MS) and entropy. Three statistical features are calculated for individual energy measurement filter.4Experimental results, comparison and discussionThe prime motivation of this section is to investigate the proposed MRLM method along with the conventional DWT and Laws’ masks methods to extract texture features for texture classification. To illustrate the efficiency of the proposed method the results are compared with the existing Laws’ masks method. The performance of conventional dyadic wavelet transform, Laws’ masks and proposed MRLM methods are examined by using Brodatz and VisTex databases (Brodatz, 1966; VisTex, 1995).
The Brodatz album is a widely used database and often treated as a benchmark for texture classification. There are substantial variations within some textures and some of them are so alike to each other that is why this Brodatz dataset is very challenging. The first database consists of 24 texture images each of size 640×640 pixels from the Brodatz database. Figure 3 represents the sample images of Brodatz database. In the experiment, each image is divided into 25 nonoverlapping samples of size 128×128 pixels. Therefore, there are 600 subimages derived from selected 24 images. Out of 25 subimages of each texture image, we have taken 12 subimages for training and the remaining 13 subimages for testing. The Vision Texture (VisTex) dataset is prepared by the Massachusetts Institute of Technology (MIT). VisTex database contains colour texture images that represent the real world conditions. Our second database includes 25 texture images of size 512×512 pixels from VisTex database and split into 16 nonoverlapping samples of size 128×128 pixels. Thus there are total 400 samples available out of which 200 samples are used for training and 200 samples for testing. The images are converted to grayscale before feature extraction. Figure 4 depicts the sample images of VisTex database. The achievement of classification success rate is verified using k-NN classifier.
In our first experiment, we use the traditional DWT where the training and testing images are decomposed to three levels by using db1, db4, db8, coif1, coif4 and sym2 as basis functions. The transformed images obtained from first and second level of decompositions are shown in Figure 5. When the original image is decomposed to first level of decomposition by applying any one of the wavelets, four subbands LL, LH, HL and HH are obtained. We select all the subbands from each decomposition level. Then statistical texture features like mean and standard deviation are extracted from the detail regions of DWT decomposed images, at different scale. Hence, in total eight numbers of statistical features are derived from the first level decomposition of one image. Accordingly, for three levels of decomposition, total 24 features are extracted from each image. In the similar way, all the features are derived by applying different wavelets individually to both the databases. A k-NN classifier is used to classify each texture feature to an appropriate class. The classification results of the conventional dyadic wavelet transform for all the basis functions are tabulated in Table 1 and shown in Figure 6. From Table 1, it is observed that DWT with db1 as basis achieves the highest accuracy of 90.71% on Brodatz database. DWT with sym2 as basis achieves the best classification accuracy of 50.50% on VisTex database.
Classification results for traditional dyadic wavelet transform.
| Different wavelets | Number of features | Classification accuracy (%) for Brodatz dataset | Classification accuracy (%) for VisTex dataset |
|---|---|---|---|
| DWT (db1, L=3) | 24 | 90.71 | 48.50 |
| DWT (db4, L=3) | 24 | 90.38 | 49.50 |
| DWT (db8, L=3) | 24 | 90.38 | 44.50 |
| DWT (coif1, L=3) | 24 | 90.38 | 49.50 |
| DWT (coif4, L=3) | 24 | 88.14 | 44.00 |
| DWT (sym2, L=3) | 24 | 89.10 | 50.50 |
In the second experiment, we use the conventional Laws’ masks method in two ways. Initially only four masks Level (L), Edge (E), Spot (S) and Ripple (R) are used. Fifteen different masks are produced by using these four masks. Secondly, we use all the five masks Level (L), Edge (E), Spot (S), Ripple (R) and Wave (W), and twenty five different masks are produced by utilizing these five masks. Both training and testing images are convolved with these fifteen and twenty five numbers of masks corresponding to our two methods. The convolved outputs are passed through three energy measurement filters of size 15×15, which are normalized by min-max normalization method and then the statistical features Absolute mean, Mean square or energy and entropy are calculated, and these are used as texture features. For fifteen numbers of masks 45 numbers and for twenty five numbers of masks 75 numbers of features are extracted for each image. The classification results for both the databases are presented in Table 2. The performance results for both the datasets are shown in Figures 7 and 8. From Table 2, it is observed that Laws’ masks of 25 numbers for the mean filter have produced the highest classification accuracy of 95.83% on Brodatz dataset and accuracy of 59.00% on VisTex dataset. Laws’ masks with 15 numbers for the mean filter have produced highest classification accuracy of 93.27% on Brodatz dataset and accuracy of 57.00% on VisTex dataset.
Classification results for conventional Laws’ masks (5×5).
| Different size of masks | No. of features | Classification accuracy | ||
|---|---|---|---|---|
| Mean | Absolute mean | Standard deviation | ||
| Brodatz dataset | ||||
| 15 number of masks (without wave) | 45 | 93.27 | 86.22 | 89.42 |
| 25 number of masks | 75 | 95.83 | 91.35 | 91.67 |
| VisTex dataset | ||||
| 15 number of masks (without wave) | 45 | 57.00 | 48.00 | 53.00 |
| 25 number of masks | 75 | 59.00 | 52.50 | 55.00 |
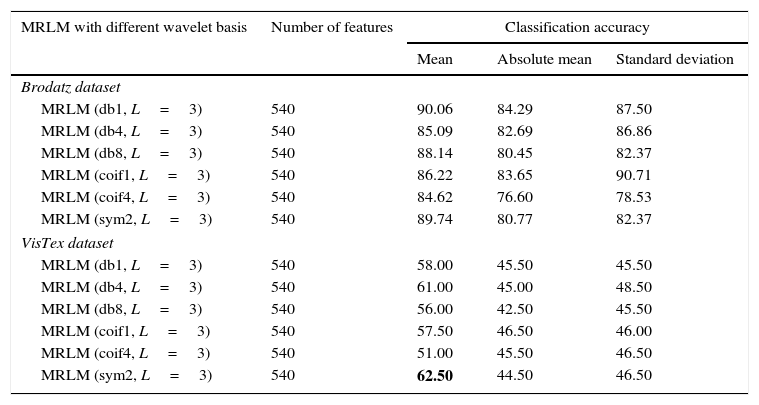
The third experiment is our proposed MRLM method. By applying DWT on texture images for three levels of decomposition with different wavelets the transformed images are obtained for all the four sub bands LL, LH, HL and HH. These transformed images are further applied to Laws’ masks descriptor for feature extraction and classification. As described in the second experiment that 15 numbers of Laws’ masks will produce 45 features for each image. Hence, after convolving with the first level of decomposed images it will produce 180 features for each image. Similarly, 360 features for the second level decomposition and 540 features for the third level decomposition are obtained for 15 numbers of Laws’ masks. In the same way 300, 600 and 900 features are derived from each image for first, second and third level of decompositions respectively for 25 numbers of Laws’ masks. Classification accuracies are verified for both 15 and 25 numbers of different masks.
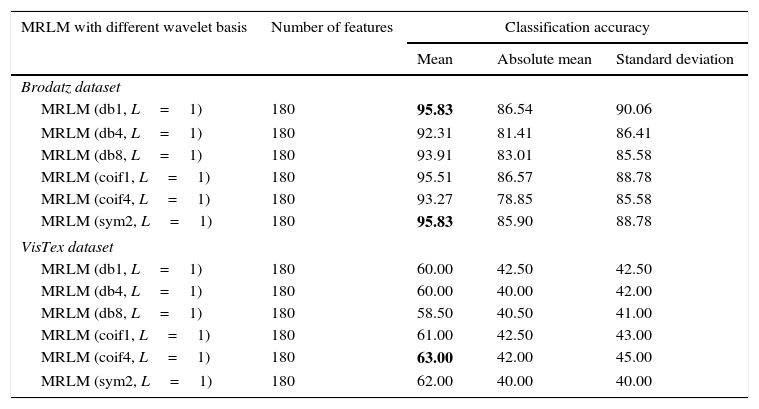
From Table 3, we can observe that for the Brodatz database, MRLM method for mean filter with db1 and sym2 as basis have been able to achieve highest classification accuracy of 95.83% at the first level of decomposition. The second best classification accuracy of 95.51% is obtained from the same mean filter having coif1 as wavelet basis. Also for db8 classification accuracy of 93.91% is obtained which is higher than the traditional Laws’ mask descriptor. For coif4 accuracy of 93.27% is achieved which is same as traditional Laws’ mask method. Furthermore, for absolute mean and standard deviation filter it has detected that classification accuracies of 86.54% and 90.06% for db1 wavelet, which shows better accuracy than traditional Laws’ masks method. The lowest classification accuracy of 92.31% is obtained for the mean filter with db4 as basis. The classification results for the higher levels of decomposition are listed in Tables 4 and 5 respectively, which show that the classification accuracies are reduced for the mean and absolute mean filters. However, it is noticed that the standard deviation filter has yielded an accuracy of 90.71% at second and third level of decomposition with coif1as basis. Figure 9 shows the performance results of Brodatz database for the proposed MRLM method with 15 numbers of masks.
Classification results for one level Multi-resolution Laws’ Masks (MRLM) for 15 number of different masks.
| MRLM with different wavelet basis | Number of features | Classification accuracy | ||
|---|---|---|---|---|
| Mean | Absolute mean | Standard deviation | ||
| Brodatz dataset | ||||
| MRLM (db1, L=1) | 180 | 95.83 | 86.54 | 90.06 |
| MRLM (db4, L=1) | 180 | 92.31 | 81.41 | 86.41 |
| MRLM (db8, L=1) | 180 | 93.91 | 83.01 | 85.58 |
| MRLM (coif1, L=1) | 180 | 95.51 | 86.57 | 88.78 |
| MRLM (coif4, L=1) | 180 | 93.27 | 78.85 | 85.58 |
| MRLM (sym2, L=1) | 180 | 95.83 | 85.90 | 88.78 |
| VisTex dataset | ||||
| MRLM (db1, L=1) | 180 | 60.00 | 42.50 | 42.50 |
| MRLM (db4, L=1) | 180 | 60.00 | 40.00 | 42.00 |
| MRLM (db8, L=1) | 180 | 58.50 | 40.50 | 41.00 |
| MRLM (coif1, L=1) | 180 | 61.00 | 42.50 | 43.00 |
| MRLM (coif4, L=1) | 180 | 63.00 | 42.00 | 45.00 |
| MRLM (sym2, L=1) | 180 | 62.00 | 40.00 | 40.00 |
Better results are made bold.
Classification results for two level Multi-resolution Laws’ Masks (MRLM) for 15 number of different masks.
| MRLM with different wavelet basis | Number of features | Classification accuracy | ||
|---|---|---|---|---|
| Mean | Absolute mean | Standard deviation | ||
| Brodatz dataset | ||||
| MRLM (db1, L=2) | 360 | 89.10 | 86.54 | 88.14 |
| MRLM (db4, L=2) | 360 | 88.14 | 85.90 | 86.86 |
| MRLM (db8, L=2) | 360 | 92.95 | 84.29 | 86.22 |
| MRLM (coif1, L=2) | 360 | 92.63 | 88.14 | 90.71 |
| MRLM (coif4, L=2) | 360 | 91.99 | 83.01 | 88.14 |
| MRLM (sym2, L=2) | 360 | 90.06 | 84.94 | 86.22 |
| VisTex dataset | ||||
| MRLM (db1, L=2) | 360 | 61.00 | 44.50 | 45.50 |
| MRLM (db4, L=2) | 360 | 64.50 | 43.00 | 44.00 |
| MRLM (db8, L=2) | 360 | 66.00 | 40.50 | 45.50 |
| MRLM (coif1, L=2) | 360 | 60.50 | 46.50 | 42.00 |
| MRLM (coif4, L=2) | 360 | 64.50 | 43.00 | 45.50 |
| MRLM (sym2, L=2) | 360 | 61.50 | 43.50 | 43.00 |
Better results are made bold.
Classification results for three level Multi-resolution Laws’ Masks (MRLM) for 15 number of different masks.
| MRLM with different wavelet basis | Number of features | Classification accuracy | ||
|---|---|---|---|---|
| Mean | Absolute mean | Standard deviation | ||
| Brodatz dataset | ||||
| MRLM (db1, L=3) | 540 | 90.06 | 84.29 | 87.50 |
| MRLM (db4, L=3) | 540 | 85.09 | 82.69 | 86.86 |
| MRLM (db8, L=3) | 540 | 88.14 | 80.45 | 82.37 |
| MRLM (coif1, L=3) | 540 | 86.22 | 83.65 | 90.71 |
| MRLM (coif4, L=3) | 540 | 84.62 | 76.60 | 78.53 |
| MRLM (sym2, L=3) | 540 | 89.74 | 80.77 | 82.37 |
| VisTex dataset | ||||
| MRLM (db1, L=3) | 540 | 58.00 | 45.50 | 45.50 |
| MRLM (db4, L=3) | 540 | 61.00 | 45.00 | 48.50 |
| MRLM (db8, L=3) | 540 | 56.00 | 42.50 | 45.50 |
| MRLM (coif1, L=3) | 540 | 57.50 | 46.50 | 46.00 |
| MRLM (coif4, L=3) | 540 | 51.00 | 45.50 | 46.50 |
| MRLM (sym2, L=3) | 540 | 62.50 | 44.50 | 46.50 |
Better results are made bold.
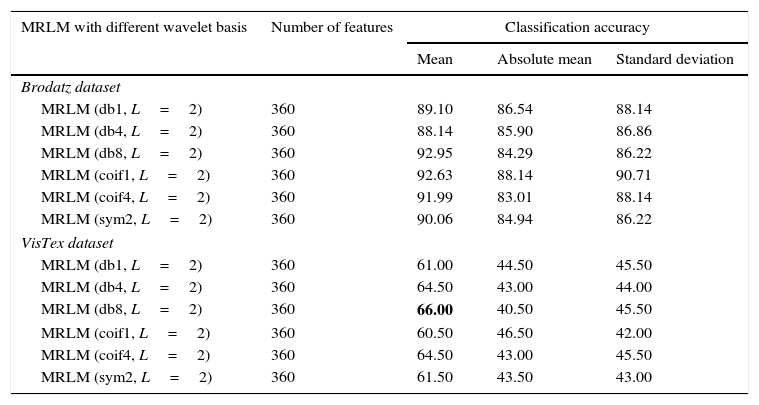
The results obtained for VisTex database for the first level of decomposition are also given in the same Table 3. It can be seen that the proposed method gives the best accuracy of 63% with coif4 as basis. The second and third best accuracy of 62% and 61% are achieved from sym2 and coif1 as wavelets basis respectively. The wavelets db1 and db4 provide an accuracy of 60%. The lowest accuracy of 58.50% is obtained with db8 as basis, but still it is higher than the existing descriptors. From Table 4 it is observed that the highest classification accuracy of 66% is obtained at the second level of decomposition with db8 as basis, which is 9% more than the existing Laws’ masks descriptor. In addition, we have achieved better accuracy for other wavelet basis functions such as, 64.50% for db4 and coif4, 61.50% for sym2, 61% for db1 and 60.50% for coif1 as listed in Table 4. At the third level of decomposition, the classification accuracy starts decreasing for some wavelet basis functions as reported in Table 5. The best classification accuracy of 62.50% is obtained with sym2 as basis at the third level of decomposition. Accuracy of 61% for db4, 58% for db1 and 57.50% for coif1 and the lowest accuracy of 56% for db8 and 51% for coif4 are obtained at the third level of decomposition. The above mentioned results are achieved only for the mean energy filter. There is no improvement in classification accuracy for the absolute mean and standard deviation energy filters. Figures 11–13 show the performance results of VisTex database for the proposed MRLM method with 15 numbers of masks.
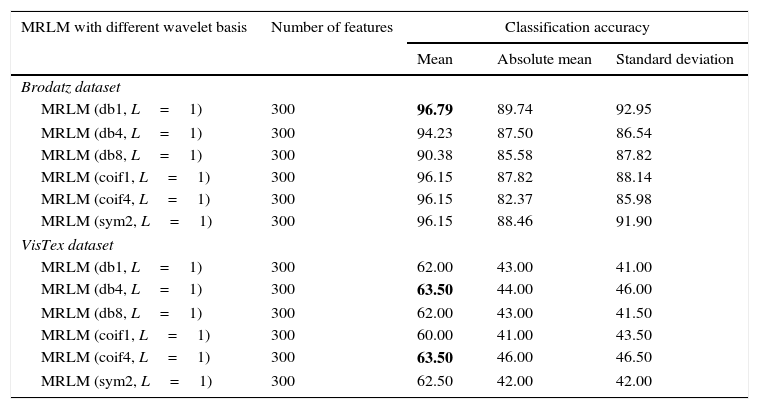
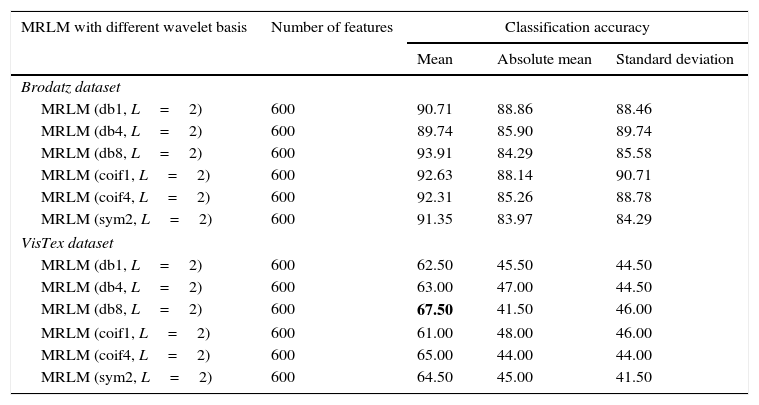
Table 6 exhibits the classification success rates of Brodatz database for the proposed method MRLM with 25 numbers of masks at the first level of decomposition. The results show that the highest classification accuracy 96.79% is achieved with db1 as basis for the mean filter. For absolute mean and standard deviation filters, classification accuracies of 89.74% and 92.95% are obtained respectively for the same wavelet basis. The second highest accuracy 96.15% is obtained from coif1, coif4 and sym2 as basis for the mean filter. The classification accuracy is reduced to 94.23% for db4 and 90.38% for db8 respectively for the mean filter. There is no further improvement of classification accuracy for the absolute mean and standard deviation filters, by using rest of all the wavelets for the first level of decomposition. Tables 7 and 8 display that at the higher levels of decomposition classification accuracies are reduced for the all the three energy measurement filters on Brodatz database. Figure 10 shows the performance results of Brodatz database for the proposed MRLM method with 25 numbers of masks.
Classification results for one level Multi-resolution Laws’ Masks (MRLM) for 25 number of different masks.
| MRLM with different wavelet basis | Number of features | Classification accuracy | ||
|---|---|---|---|---|
| Mean | Absolute mean | Standard deviation | ||
| Brodatz dataset | ||||
| MRLM (db1, L=1) | 300 | 96.79 | 89.74 | 92.95 |
| MRLM (db4, L=1) | 300 | 94.23 | 87.50 | 86.54 |
| MRLM (db8, L=1) | 300 | 90.38 | 85.58 | 87.82 |
| MRLM (coif1, L=1) | 300 | 96.15 | 87.82 | 88.14 |
| MRLM (coif4, L=1) | 300 | 96.15 | 82.37 | 85.98 |
| MRLM (sym2, L=1) | 300 | 96.15 | 88.46 | 91.90 |
| VisTex dataset | ||||
| MRLM (db1, L=1) | 300 | 62.00 | 43.00 | 41.00 |
| MRLM (db4, L=1) | 300 | 63.50 | 44.00 | 46.00 |
| MRLM (db8, L=1) | 300 | 62.00 | 43.00 | 41.50 |
| MRLM (coif1, L=1) | 300 | 60.00 | 41.00 | 43.50 |
| MRLM (coif4, L=1) | 300 | 63.50 | 46.00 | 46.50 |
| MRLM (sym2, L=1) | 300 | 62.50 | 42.00 | 42.00 |
Better results are made bold.
Classification results for two level Multi-resolution Laws’ Masks (MRLM) for 25 number of different masks.
| MRLM with different wavelet basis | Number of features | Classification accuracy | ||
|---|---|---|---|---|
| Mean | Absolute mean | Standard deviation | ||
| Brodatz dataset | ||||
| MRLM (db1, L=2) | 600 | 90.71 | 88.86 | 88.46 |
| MRLM (db4, L=2) | 600 | 89.74 | 85.90 | 89.74 |
| MRLM (db8, L=2) | 600 | 93.91 | 84.29 | 85.58 |
| MRLM (coif1, L=2) | 600 | 92.63 | 88.14 | 90.71 |
| MRLM (coif4, L=2) | 600 | 92.31 | 85.26 | 88.78 |
| MRLM (sym2, L=2) | 600 | 91.35 | 83.97 | 84.29 |
| VisTex dataset | ||||
| MRLM (db1, L=2) | 600 | 62.50 | 45.50 | 44.50 |
| MRLM (db4, L=2) | 600 | 63.00 | 47.00 | 44.50 |
| MRLM (db8, L=2) | 600 | 67.50 | 41.50 | 46.00 |
| MRLM (coif1, L=2) | 600 | 61.00 | 48.00 | 46.00 |
| MRLM (coif4, L=2) | 600 | 65.00 | 44.00 | 44.00 |
| MRLM (sym2, L=2) | 600 | 64.50 | 45.00 | 41.50 |
Better results are made bold.
Classification results for three level Multi-resolution Laws’ Masks (MRLM) for 25 number of different masks.
| MRLM with different wavelet basis | Number of features | Classification accuracy | ||
|---|---|---|---|---|
| Mean | Absolute mean | Standard deviation | ||
| Brodatz dataset | ||||
| MRLM (db1, L=3) | 900 | 90.38 | 84.62 | 86.22 |
| MRLM (db4, L=3) | 900 | 87.50 | 82.69 | 87.82 |
| MRLM (db8, L=3) | 900 | 89.42 | 79.49 | 81.41 |
| MRLM (coif1, L=3) | 900 | 88.46 | 83.33 | 86.86 |
| MRLM (coif4, L=3) | 900 | 83.04 | 74.04 | 74.24 |
| MRLM (sym2, L=3) | 900 | 90.06 | 81.41 | 81.41 |
| VisTex dataset | ||||
| MRLM (db1, L=3) | 900 | 58.00 | 46.50 | 43.00 |
| MRLM (db4, L=3) | 900 | 61.00 | 48.00 | 44.00 |
| MRLM (db8, L=3) | 900 | 61.00 | 46.00 | 47.00 |
| MRLM (coif1, L=3) | 900 | 60.00 | 52.00 | 47.50 |
| MRLM (coif4, L=3) | 900 | 57.00 | 47.50 | 46.00 |
| MRLM (sym2, L=3) | 900 | 65.00 | 44.50 | 43.50 |
Better results are made bold.
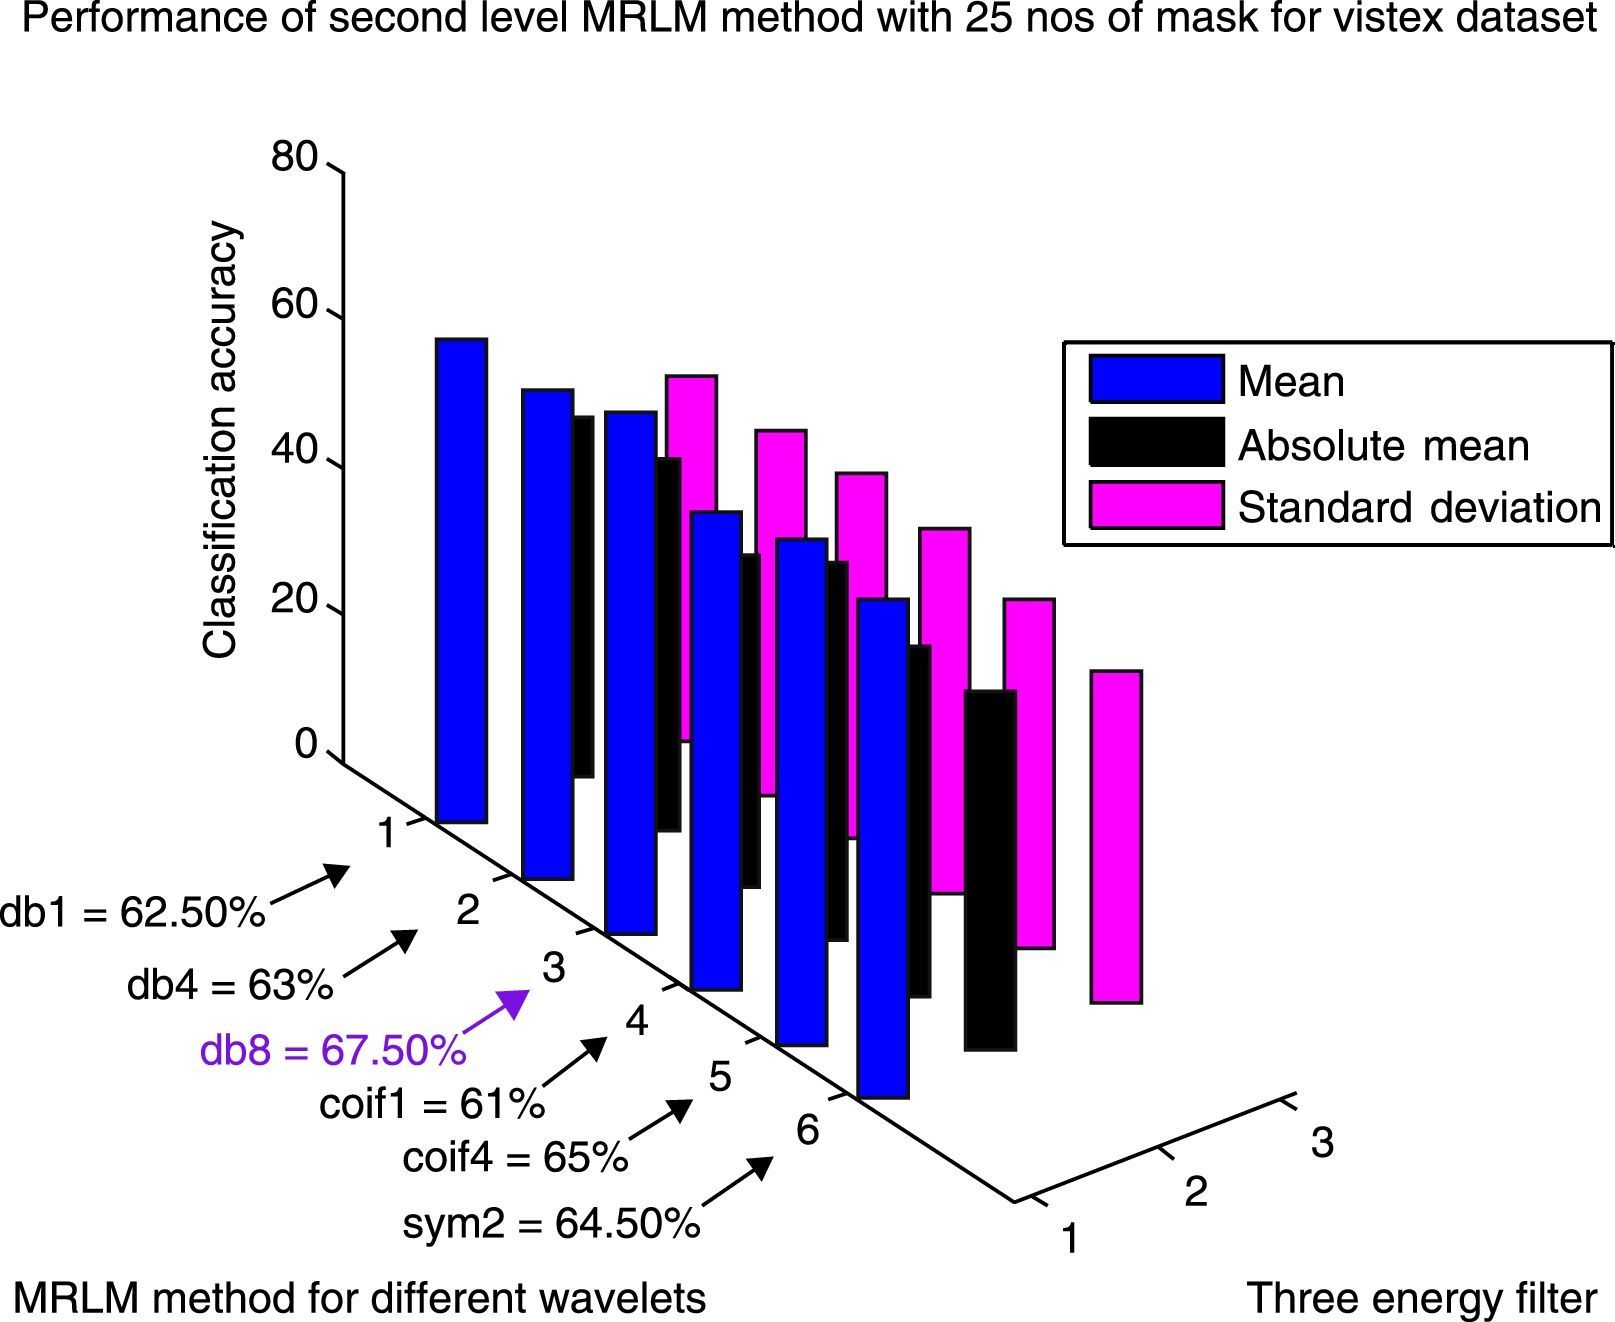
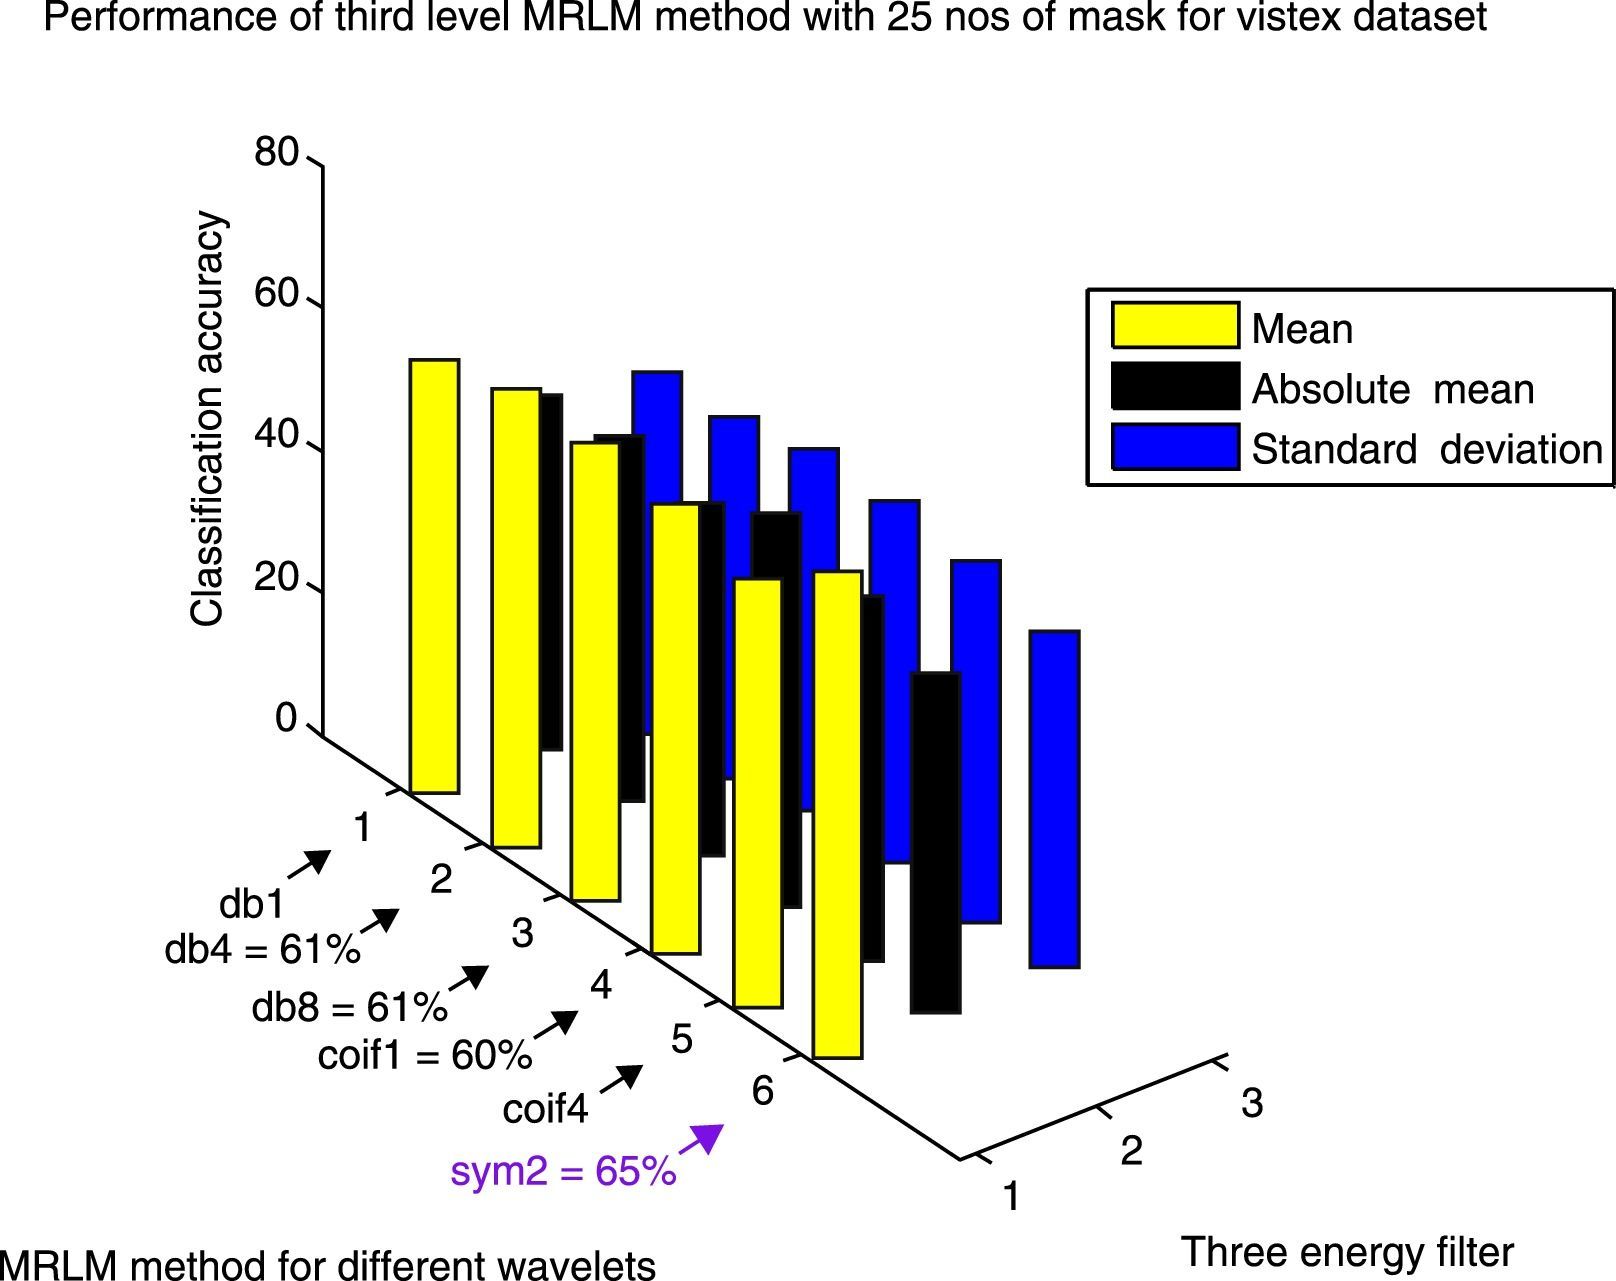
The same Table 6 also shows the classification success rates for the proposed method MRLM with 25 numbers of masks at the first level of decomposition on VisTex database. At the first level of decomposition, the first best accuracy of 63.50% is obtained from db4 and coif4 wavelets. The second best accuracy of 62.50% is achieved from sym2 wavelet. Other wavelets also provide better accuracy results like, 62% with db1 and db8 as basis, 60% with coif4 as basis. From Table 7 it can be seen that the highest classification accuracy of 67.50% is attained with db8 as basis at the second level of decomposition. Improvement in results are also noticed with other wavelets at the second level of decomposition such as, 65% for coif4, 64.50% for sym2, 63% for db4, 62.50% for db1 and 61% for coif1. The classification accuracies start decreasing at the third level of decomposition for some wavelets as reported in Table 8. The first best accuracy of 65% with sym2 as basis is obtained at the third level of decomposition. The second best accuracy of 61% is achieved from db4 and db8 wavelets. The third highest accuracy of 60% is achieved with coif4 as basis. The lowest classification accuracies of 58% from db1 and 57% from coif4 are obtained at the third level of decomposition. Figures 14–16 show the performance results of VisTex database for the proposed MRLM method with 25 numbers of masks.
The experimental results show that the proposed MRLM method (for both 15 numbers and 25 numbers of masks) provides highest classification accuracy at the first level of decomposition on Brodatz database. On the other hand, for VisTex database rise in classification accuracies are observed up to the second level of decomposition. Afterwards, the classification accuracies are reduced for some wavelets at the third level of decomposition. It has been observed that for both the databases there is a reduction in classification accuracy at the higher levels of image decomposition. The reason is that DWT create low-resolution images that do not preserve qualitative visual information.
5ConclusionThe main feature of dyadic wavelet transform is multi-resolution representation of images. By using the wavelets, the given images can be analyzed at various levels of resolution in both spatial and frequency domain. Wavelets seem to be effective for the analysis of textures recorded with different resolutions. Laws’ masks method is a filtering method in spatial domain to extract texture features. In this paper, taking into account the aforementioned advantages of both the methods, we investigated the texture classification problem with combination of dyadic wavelet transform and Laws’ masks. The proposed method performs better than the individual traditional methods. However, the results do not show any improvement at the higher levels of decomposition. The reason is that at higher level DWT produces low-resolution images that do not preserve qualitative visual information.
Conflict of interestThe authors have no conflicts of interest to declare.
Peer Review under the responsibility of Universidad Nacional Autónoma de México.


