
Malnutrition and inflammation commonly occur concomitantly among hemodialysis patients. Malnutrition inflammation score (MIS) is a tool that helps clinical and nutritional evaluation of patients regardless of age. This study aimed to determine the best approach by comparing different tools/indices to evaluate the malnutrition and inflammation status of patients having hemodialysis treatment regarding their age and to examine the clinical benefits and consistency of MIS with other malnutrition tools.
MethodsThe study was conducted with a sample of 140 hemodialysis patients (70 adults and 70 elderly patients). The biochemical data of the patients were retrospectively obtained, and the research dietitian conducted the anthropometric measures. In addition to MIS, 7 point-SGA (7p-SGA), Nutrition Risk Index (NRI) for adults, and Mini Nutritional Assessment (MNA), Geriatric Nutritional Risk Index (GNRI) for elderly patients were used. The model's discriminatory power was examined by receiver operating characteristics curve analysis.
ResultsPatients who were “at-risk” according to MIS had significantly lower scores of 7p-SGA and NRI than those who had “no risk” (p<0.001). Moreover, those who are “at-risk” have significantly lower MNA scores than those who are not (p=0.002). Among adult patients, MIS displayed lower sensitivity but higher specificity with NRI than 7p-SGA. However, for elderly patients, MIS showed fair sensitivity and specificity with MNA but the highest sensitivity with GNRI.
ConclusionAlthough different screening tools are available to screen malnutrition among dialysis patients regarding their age, MIS might be more clincally useful as it is more susceptible to assess both malnutrition and inflammation that occur concomitantly.
La desnutrición y la inflamación comúnmente ocurren concomitantemente entre los pacientes de hemodiálisis. El Malnutrition Inflammation Score (MIS) es una herramienta que ayuda a la evaluación clínica y nutricional de los pacientes sin importar la edad. Por lo tanto, este estudio tuvo como objetivo determinar el mejor enfoque comparando diferentes herramientas/índices para evaluar el estado de desnutrición e inflamación de los pacientes en tratamiento de hemodiálisis con respecto a su edad y examinar la consistencia de MIS con otras herramientas de desnutrición.
Material y métodosEl estudio se realizó con 140 pacientes (70 adultos y 70 ancianos) en hemodiálisis. Los datos bioquímicos de los pacientes se obtuvieron retrospectivamente de los registros más recientes y la dietista investigadora realizó las medidas antropométricas. Además de MIS, se utilizaron siete puntos SGA (7p-SGA), Nutrition Risk Index (NRI) para adultos y Mini Nutritional Assessment (MNA), Geriatric Nutritional Risk Index (GNRI) para ancianos. El poder discriminatorio del modelo se examinó mediante el análisis de la curva de características operativas del receptor.
ResultadosLos pacientes que fueron diagnosticados como «en riesgo» por MIS tenían puntuaciones significativamente más bajas de 7p-SGA y NRI que aquellos que tenían «ningún riesgo» (p<0,001). De acuerdo con la clasificación MIS, aquellos que están «en riesgo» tienen puntajes MNA significativamente más bajos que aquellos que no lo están (p=0.002). Entre los pacientes adultos, MIS mostró menor sensibilidad, pero mayor especificidad con NRI que con 7p-SGA. Sin embargo, para los ancianos, MIS mostró sensibilidad y especificidad aceptables con MNA, pero la sensibilidad más alta con GNRI.
ConclusiónSi bien existen diferentes herramientas de detección disponibles para evaluar la desnutrición entre los pacientes de diálisis con respecto a su edad, el MIS puede ser más práctico, ya que es más susceptible de evaluar tanto a la desnutrición como a la inflamación que ocurren de manera concomitante.
Chronic kidney disease (CKD), which is manifested by irreversible outcomes of kidneys, is a common disease with high morbidity and mortality, lowering the quality of life and costing a high economic burden. As a temporary treatment method, dialysis based on regulating the fluid and solute exchange may replace an average of 10% of kidney functions.1 However, the treatment itself is the primary contributing factor that increases inflammation and malnutrition, highly prevalent among patients treating hemodialysis (HD).2,3 Half of the studies included in a recent global meta-analysis reported a prevalence of malnutrition of approximately 43% or higher, as determined by the subjective global assessment (SGA) or the malnutrition inflammation score (MIS) among patients with hemodialysis.4
In patients with CKD, low-grade chronic inflammation due to decreased renal clearance (leading to more cytokine uptake) and uremia leads to endothelial dysfunction, osteoporosis, metabolic imbalance, deterioration of the immune system, and nutritional disorders exacerbate the CKD progress and protein-energy wasting. In addition to the catabolic effects of dialysis and many uremia-related symptoms, loss of appetite, nausea, and drugs that impair nutrient absorption, comorbidities are the main factors causing inadequate food and protein intake resulting in malnutrition.5 Besides these, other physiological effects, including decreased prealbumin, transferrin levels, and other visceral proteins in the serum, accompany inflammation.3,6
Uncontrolled and persistent inflammation is harmful and is associated with poorer outcomes such as lower quality of life, higher risk of cardiovascular disease, and all-cause mortality.2 Besides, protein-energy malnutrition and inflammation commonly occur concomitantly7 and form a malnutrition-inflammation complex (MIC) condition. Thus, it is imperative to evaluate patients’ nutritional and inflammation status with CKD for the effectiveness of treatment; however, there is no single diagnostic gold standard tool or method.8 Therefore, the screening tools for malnutrition should include multiple parameters by asking the anthropometric measurements, serum levels of specific metabolites, functional capacity, and appetite status of the patients, and are recommended to be selected by considering the specificities related to the CKD.2 Furthermore, since malnutrition is a multifactorial outcome depending on the type and prognosis of the disease, evaluating it from a single perspective would not be sufficient.
In addition to other malnutrition screening tools, including 7point- SGA (7p-SGA),9 Nutritional Risk Index (NRI),10 Mini Nutritional Assessment (MNA),6 and Geriatric Nutritional Risk Index (GNRI)3; MIS is a kind of a tool that helps clinical and nutritional evaluation of patients receiving dialysis treatment regardless of age.11,12 However, in most studies with dialysis patients, the SGA and MIS displayed a higher association with malnutrition and mortality rates.13 Thus, the European Society for Clinical Nutrition and Metabolism (ESPEN) guidelines, the French National Nutrition Santé Program, and Kidney Disease Outcome Quality Initiative (KDOQI) recommend using condition-specific screening tools to assess malnutrition and inflammation among patients with CKD.11
Therefore, this study aimed to determine the best approach by comparing different tools/indices to evaluate the malnutrition and inflammation status of patients having hemodialysis treatment regarding their age and to examine the consistency of MIS with other malnutrition tools.
Material and methodsStudy design and participantsThis observational cross-sectional study was conducted with 140 elderly HD patients (70 of them elderly patients) treated in the dialysis center of a private hospital in Istanbul between March and June 2021. The elderly patients group was considered as patients with age ≥65 years old, and adults to <65. After the ethical approval from the observational research ethical board of the institute, and the informed consent, only volunteered patients who were able to answer the questions and did not have cancer or any other fatal condition were enrolled in the study.
MeasuresAll data was collected via face-to-face interview methods by the researcher, using a questionnaire consisting of 2 main parts: anthropometric measurements & biochemical data and malnutrition screening.
Anthropometric measurements & biochemical dataFirstly, the data collection process took place between October 2020 and March 2021 and the biochemical data of the patients were reported up to 1 month before the interview. Next, this study took age-related cutoff points for serum albumin and serum creatinine. Following that, all demographic data were collected, and participants were grouped regarding their ages.
Secondly, after HD treatment in both adult and elderly patients groups, specific anthropometric measurements were taken into account for CKD patients’ hydration status (fluid-electrolyte balance may be variable).11 Finally, dry weight was used as body weight. According to the criteria of the International Society of Renal Nutrition and Metabolism (ISRNM), a body mass index (BMI)<23kg/m2 is considered underweight for this study.14 Furthermore, the conicity index calculated by using the formula: −0.109−1×waist circumference (m)×(weight [kg]/height [m])−1/2. Therefore, all anthropometric measures (height, weight, waist and hip circumferences, lean body mass) were conducted by the research dietitian.
In this study, an equation (Estimated LBM (kg)=0.34*Serum creatinine (mg/dl)+5.58*sex (1 if women; 0 if men)+0.30*weight (kg)+0.67*height (inch)−0.23*URR (URR, urea reduction ratio)−5.75) was used to determine the lean body mass (LBM) of HD patients without using dual energy X-ray absorptiometry.15
Malnutrition screening toolsMalnutrition inflammation score (MIS), which was developed by Kalantar-Zadeh et al. (2001) by revising the SGA, was used to assess all patients’ malnutrition and inflammation status study.16 It was created as a comprehensive scoring system with significant associations with inflammation, malnutrition, anemia, and possible hospitalization and mortality in HD patients. The increase in the score indicates the severity of malnutrition. The MIS cut-off value was determined as >6.5, which was determined as a high risk of mortality in the results of a previous study, indicating a higher risk of malnutrition.17 Additionally, the 7p-SGA, which was developed by expanding the conventional SGA by Churchill et al.,18 was used for the adult group in this study. The mean scores between 1 and 2 were classified as severe malnutrition, 3–5 as mild–moderate malnutrition, and 6–7 as well-nourished.19 Furthermore, the NRI was calculated for adult patients, and the risk was classified accordingly: 100 no malnutrition, 97.5–100 mild malnutrition, 83.5–97.5 moderate malnutrition, <83.5 severe malnutrition.20
The MNA form was used to assess the malnutrition status of elderly patients and were evaluated as follows: 24–30 normal nutritional status, 17–23.5 at risk of malnutrition, ≤17 malnourished.21 Additionally, the GNRI was calculated for elderly patients with the reference values of; <82 severe risk, ≥82 to <92 moderate risk, ≥92 to <98 low risk, ≥98 no risk.22
Statistical analysisAll statistical tests were conducted via the Statistical Package for the Social Sciences (SPSS) software package program. Continuous variables were indicated as mean±standard deviation (SD), and nominal variables were shown as frequency (%). The results were considered statistically significant for the 95% confidence interval and p<0.05 in all analyses. Parametric tests were used for further analysis since it was determined that the quantitative data conformed to the normal distribution with the Kolmogorov–Smirnov test. The model's discriminatory power in predicting malnutrition of screening tools and the sensitivity and specificity of MIS compared to other tools was examined by receiver operating characteristics (ROC) curve analysis. Values with a margin of error below 5% of the area under the curve (AUC) were interpreted as statistically significant for the diagnostic value of the test. The confidence interval for all analyze was 95%, and the results were considered statistically significant for p<0.05.
ResultsAll data were interpreted in two groups: adults (n=70) and elderly patients (n=70), however sex differences were presented in the supplementary materials (Table A) regarding MIS and other malnutrition screening tools. Moreover, the discriminatory capacity of the model also was presented in the supplementary materials (Table B).
The mean age of the adults was 56.1±6.9, while it was 73.6±6.5 for the elderly patients (data not presented). 41.4% of the adult patients were women, 82.9% were married, while the rates were 62.9% and 78.6% for elderly patients and adult patients, respectively. The mean dialysis duration of all patients was 9.3±8.5 years (data not presented).
All anthropometric and biochemical parameters of adults and elderly patients were displayed in Table 1. The mean BMI, MUAC, and hip circumference of adults were as follows 26.9±5.2kg/m2, 28.8±3.5cm, 104.2±9.2, respectively.
Anthropometric measurements and biochemical parameters of patients of two age groups regarding MIS.
| Overall | Malnutrition inflammation score | |||
|---|---|---|---|---|
| At risk (>6.5) | No risk (≤6.5) | Sig. | ||
| Mean±SD (range) | Mean±SD (range) | Mean±SD (range) | p | |
| Adults | ||||
| Body mass index (kg/m2) | 26.9±5.2 (18.4–41.8) | 25.7±5.4 (18.4–41.8) | 28.4±4.6 (21.6–37.5) | 0.021 |
| Mid-upper arm cir. (cm) | 28.8±3.5 (20–36) | 28.1±3 (20–33) | 29.7±3.8 (20–36) | 0.088 |
| Waist cir. (cm) | 99.4±15.3 (50–129) | 97±14.7 (60–120) | 102.6±15.7 (50–129) | 0.100 |
| Hip cir. (cm) | 104.2±9.2 (81–126) | 102.4±8.7 (87–125) | 106.7±9.5 (81–126) | 0.051 |
| Waist-to-hip ratio | 0.9±0.1 (0.4–1.1) | 0.9±0.1 (0.6–1.1) | 0.9±0.1 (0.4–1) | 0.222 |
| Conicity index | 1.3±0.1 (0.7–1.7) | 1.3±0.13 (1–1.7) | 1.3±0.2 (0.7–1.6) | 1.000 |
| Lean body mass (kg) | 46.6±6.1 (35–63.3) | 44.7±5.6 (35–57) | 49.2±5.8 (41.1–63.3) | 0.006 |
| Serum albumin (g/dL) | 3.5±0.3 (2.2–4.1) | 3.4±0.4 (2.2–4) | 3.7±0.3 (2.9–4.1) | 0.000 |
| Serum creatinine-pre (mg/dL) | 9.0±2.3 (4.6–14.3) | 8.9±2.1 (5.1–14.3) | 9.4±2.6 (4.6–13.7) | 0.377 |
| Serum creatinine-post (mg/dL) | 3.0±1.0 (1.3–5.7) | 2.8±0.9 (1.3–4.9) | 3.4±1.2 (1.6–5.7) | 0.011 |
| URR | 73.3±5.5 (62–8) | 74.7±5.5 (63.5–86) | 71.5±5.3 (62–80) | 0.019 |
| TIBC | 183.8±43.8 (61–320) | 164.4±39.5 (61–262) | 209.7±35.5 (140–320) | 0.000 |
| Elderly patients | ||||
| Body mass index (kg/m2) | 25.9±5.1 (16.3–40.6) | 25.7±5.4 (16.3–40.6) | 26.3±4.7 (19.8–37.7) | 0.617 |
| Mid-upper arm cir. (cm) | 28.3±4.5 (17–40) | 27.8±4.9 (17–40) | 29.4±3.5 (23–36) | 0.162 |
| Waist cir. (cm) | 103.4±14.6 (57–140) | 102.9±16.1 (57–140) | 104.3±11.2 (84–126) | 0.595 |
| Hip cir. (cm) | 103.4±14.2 (56–139) | 101.7±15 (56–131) | 106.6±1 (86–139) | 0.290 |
| Waist-to-hip ratio | 1±0.1 (0.7–1.5) | 1.0±0.1 (0.7–1.5) | 0.9±0.1 (0.8–1.1) | 0.240 |
| Conicity index | 1.4±0.1 (0.9–1.8) | 1.4±0.13 (0.9–1.8) | 1.4±0.1 (1.3–1.7) | 0.156 |
| Lean body mass (kg) | 44.4±5.8 (32.3–57.4) | 44±6 (34.7–54.4) | 45.3±5.3 (34.7–54.4) | 0.345 |
| Serum albumin (g/dL) | 3.4±0.3 (2.4–4.1) | 3.4±0.4 (2.4–4) | 3.6±0.3 (3–4.1) | 0.005 |
| Serum creatinine-pre (mg/dL) | 7.6±2.0 (3.3–12.8) | 7.5±1.8 (4.2–12) | 7.8±2.6 (3.3–12.8) | 0.575 |
| Serum creatinine-post (mg/dL) | 2.3±0.7 (1.2–4.8) | 2.3±0.6 (1.2–3.9) | 2.5±0.9 (1.3–4.8) | 0.330 |
| URR | 75.6±4.9 (64–89) | 75.9±4.5 (64.5–89) | 75.2±5.7 (64–85) | 0.551 |
| TIBC | 181.3±36.9 (69–285) | 176±38.6 (69–285) | 192.3±31.4 (110–247) | 0.085 |
SD: standard deviation; kg: kilogram; m: meter; cm: centimeter; g: gram; dL: deciliter; mg: milligram; URR: urea reduction ratio; TIBC; total iron binding capacity.
According to the MIS classification, adults who are “at risk” of malnutrition had significantly lower BMI and lean body mass than those without risk (p<0.05). Apart from these, no significant difference was found between the groups in other anthropometric measurements (p>0.05). Similarly, no significant difference was observed in the anthropometric measurements of elderly patients who were “at risk” and had “no risk” (p>0.05).
All biochemical parameters except URR were observed to be slightly higher among the adult group than in the elderly patients group (Table 1). In addition, those adults “at risk” of malnutrition have significantly lower serum albumin, post-dialysis serum creatinine, and TIBC than those had “no risk” (p<0.05). However, although other parameters were slightly lower in the elderly patients group of those “at risk” of malnutrition, only serum albumin was significantly lower compared to those “no risk” (p<0.05).
The malnutrition scores of the participants are shown in Table 2. Accordingly, MIS scores of both adults (7.2±3.3) and elderly patients (8.6±4.2) were higher than the considered cutoff point (6.5). However, elderly patients had higher scores by MIS than adults indicating a higher risk of malnutrition. Furthermore, adults’ overall mean 7p-SGA score was 6.3±0.5 with a range of 5.1–7, and the mean NRI score was 102.1±11.5 (78.9–124). Those who were identified as “at risk” regarding MIS had significantly lower scores of 7p-SGA and NRI than those who had “no risk” (p<0.001). It was observed that the mean MNA score is 22.1±3.7 with a range of 10.5–28.5 in elderly patients, and those who are “at risk” according to MIS classification have significantly lower scores than those who are not (p<0.001). Although the elderly patients who were determined to be “at risk” according to MIS had the lowest mean GNRI score compared to those who were not at risk and the mean of the whole group, this difference was not significant (p>0.05). Moreover, malnutrition risk classification estimated via different tools were compared regarding MIS classification, shown in Table 3. Accordingly, none of the adult patients were diagnosed with “severe malnutrition” according to the 7p-SGA results, and 75.7% of them reported “well-nourished.” Furthermore, 94.1% of those diagnosed with “mild or moderate malnutrition” on the 7p-SGA were identified as “at-risk” of malnutrition by MIS (p<0.05), indicating high sensitivity. Besides, the NRI classified 44.3% of the adult patients as having different levels of malnutrition, and 80.6% of them were reported as “at risk” by MIS (p<0.05). Thus, MIS displayed lower sensitivity with NRI than 7p-SGA, but the specificity was higher.
Malnutrition scores of patients of two age groups regarding MIS.
| Overall | Malnutrition inflammation score | |||
|---|---|---|---|---|
| At risk (>6.5) | No risk (≤6.5) | Sig. | ||
| Mean±SD (range) | Mean±SD (range) | Mean±SD (range) | p | |
| Adults | ||||
| MIS | 7.2±3.3 (1–15) | – | – | – |
| 7p-SGA | 6.3±0.5 (5.1–7) | 6.1±0.5 (5.1–7) | 6.7±0.3 (5.8–7) | <0.001 |
| NRI | 102.1±11.5 (78.9–124) | 98±11 (78.9–122.8) | 107.5±10 (83.3–124) | 0.001 |
| Elderly patients | ||||
| MIS | 8.6±4.2 (3–27) | – | – | – |
| MNA | 22.1±3.7 (10.5–28.5) | 21.2±3.3 (11.5–26) | 24±3.8 (10.5–28.5) | 0.002 |
| GNRI | 100.5±11.3 (71–127.6) | 99±12.5 (71–127.6) | 103.7±7.6 (92.7–122) | 0.101 |
SD: standard deviation; MIS: malnutrition inflammation score; 7p-SGA: 7 points subjective global assessment; NRI: nutritional risk index; MNA: mini nutritional assessment; GNRI: geriatric nutritional risk index.
Malnutrition risk classification of patients of two age groups regarding MIS.
| Overall | Malnutrition inflammation score | ||||||
|---|---|---|---|---|---|---|---|
| At risk (>6.5) | No risk (≤6.5) | p | |||||
| n | % | n | % | n | % | ||
| Adult | |||||||
| 7-p SGA | |||||||
| Well-nourished | 53 | 75.7 | 24 | 45.3 | 29 | 54.7 | <0.001 |
| Mild or moderate or severe malnutrition | 17 | 24.3 | 16 | 94.1 | 1 | 5.9 | |
| NRI | |||||||
| No malnutrition | 39 | 55.7 | 15 | 38.5 | 24 | 61.5 | 0.002 |
| Mild or moderate or severe malnutrition | 31 | 44.3 | 25 | 80.6 | 6 | 19.4 | |
| Elderly patients | |||||||
| MNA | |||||||
| Normal | 20 | 28.5 | 8 | 40 | 12 | 60 | 0.009 |
| Risk for malnutrition or malnutrition | 50 | 71.5 | 39 | 78 | 11 | 22 | |
| GNRI | |||||||
| No risk | 43 | 61.4 | 26 | 60.5 | 17 | 39.5 | 0.121 |
| Low or moderate or severe malnutrition risk | 27 | 38.5 | 21 | 77.8 | 6 | 22.2 | |
7p-SGA: 7 points subjective global assessment; NRI: nutritional risk index; MNA: mini nutritional assessment; GNRI: geriatric nutritional risk index.
According to the MNA, only 28.5% of elderly patients are classified as “normal,” and the rest are diagnosed as at risk or malnourished. MIS, which classified 78% of elderly patients as “at-risk” who was identified at “risk for malnutrition” or “malnutrition” by MNA, showed fair sensitivity and specificity with MNA (p<0.05). Moreover, only 38.5% of elderly patients were identified as having different levels of malnutrition by GNRI (p>0.05). While the sensitivity was good, the MIS showed low specificity with GNRI.
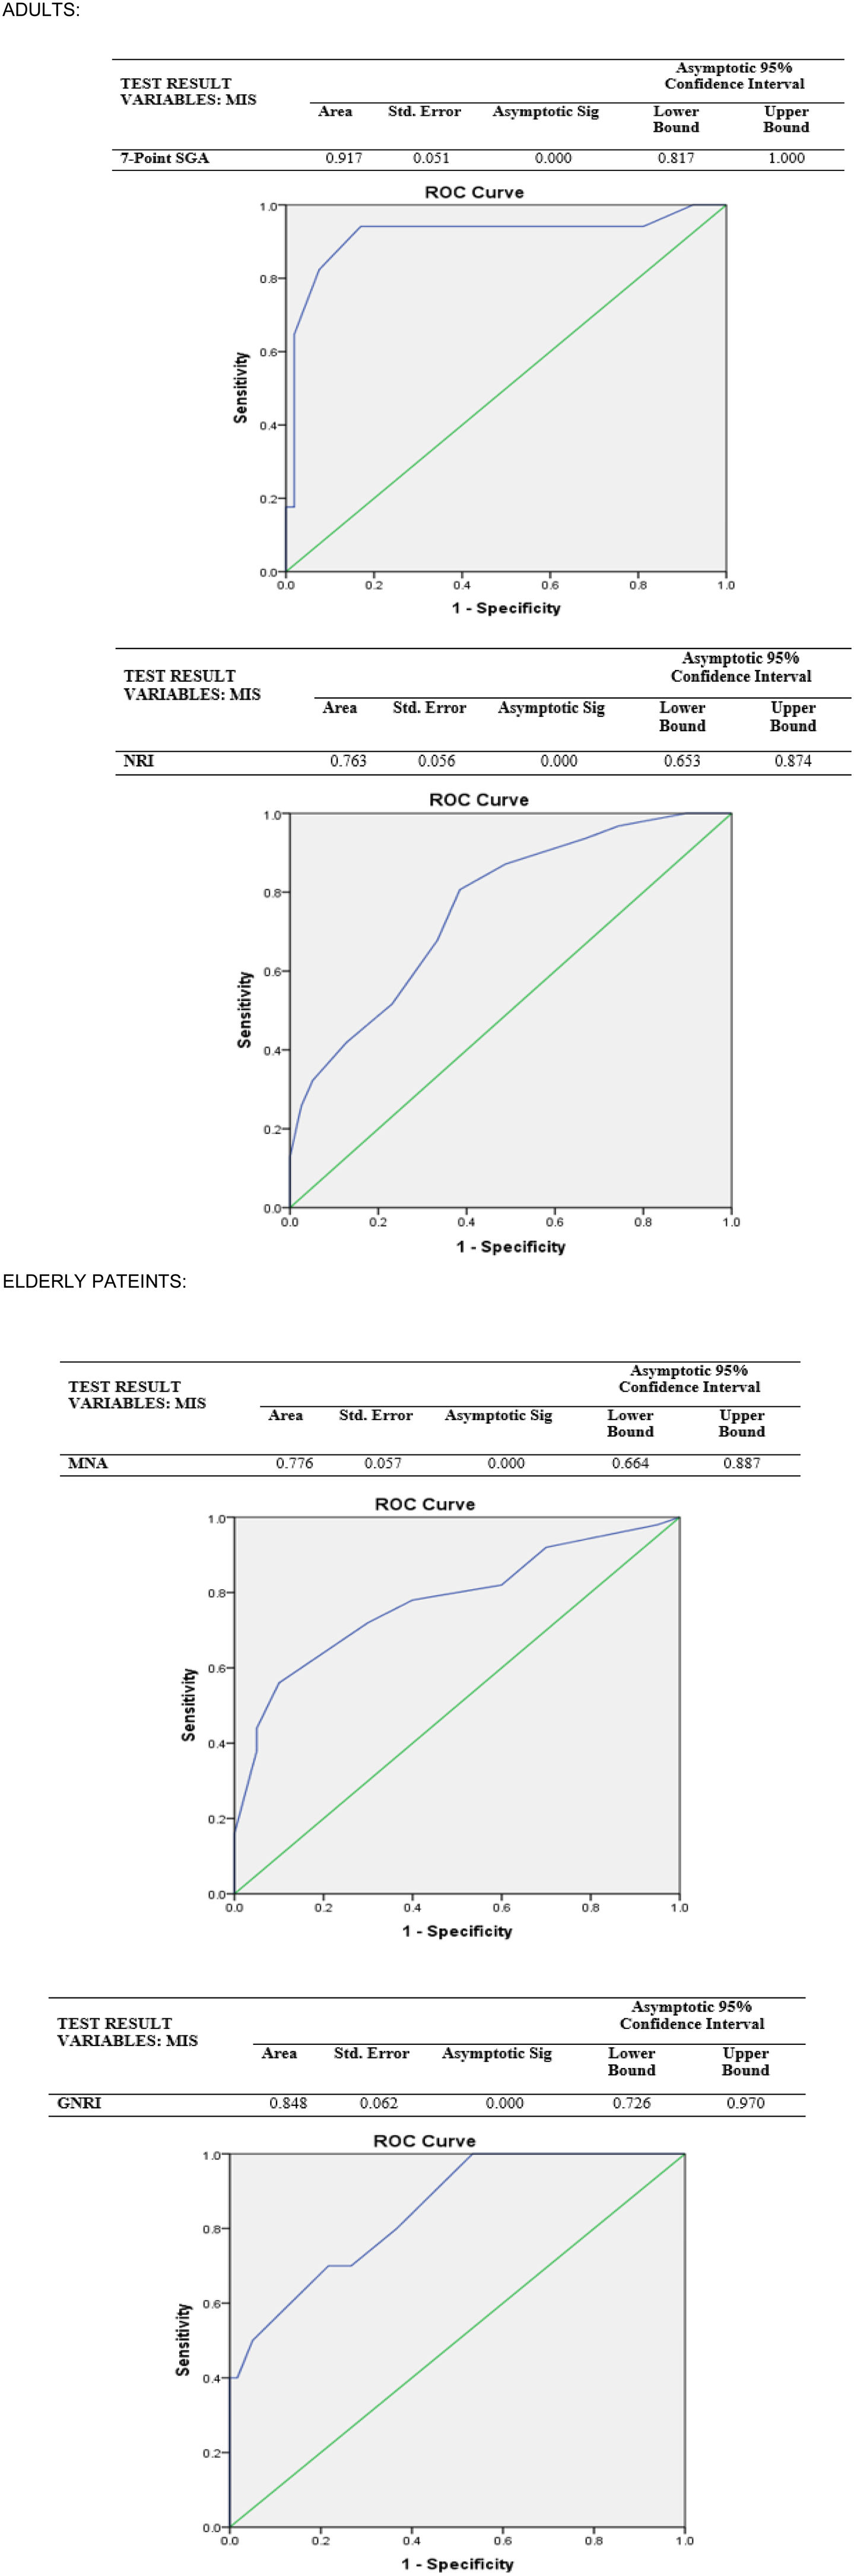
Therefore, the current study assessed MIS's consistency, specificity, and sensitivity compared to the 7p-SGA, NRI, MNA, and GNRI in CKD patients. Accordingly, the 7p-SGA test showed strong discriminating power among adult patients, while the NRI has an acceptable discriminatory power (AUC=0.917, AUC=0.763, p<0.001, respectively). On the other hand, in predicting malnutrition status regarding AUC values by ROC analysis based on the MIS result in elderly patients; the GNRI has strong discriminatory power, and the MNA has an acceptable discriminating power (AUC=0.848, AUC=0.776, p<0.001, respectively) (Fig. 1).
Discussion
The study was conducted to compare and assess the consistency of MIS with other malnutrition screening tools, and anthropometry was used explicitly in 70 adults and 70 elderly patients receiving HD treatment.
In this study, body weight and BMI are considered the early signs of malnutrition.23 As expected, all measures were observed to be slightly higher among those with no malnutrition risk. The KDOQI noted that using BMI in CKD patients would be better for mortality by making age-related comparisons, although the evidence is still limited.24 In line with the literature,25 most participants in both adult and elderly patients groups were not underweight in this study. Studies have shown a significant negative relationship between MIS and BMI, showing generally similar results to our research; however, this was not valid for the elderly patients group in our study.9,21
Contrary to this, a negative statistically significant result was found between MIS, MUAC, and LBM in a large-scale cohort study.26 Furthermore, the overall mean MUAC of the patients was in the ideal percentile, similar to the literature.23,27 Another study reported that mean MUAC measurements were lower in HD patients than in the healthy population, and they highlighted that the risk of mortality increases as the MUAC decreases.28 Abdominal fat, measured as waist circumference or WHR, independently of overall adiposity, is a more important predictor of CKD and cardiovascular risk in adults than BMI.29 In this study, the abdominal adiposity of the patients was also assessed via the conicity index. Similar to our findings, Cordeiro et al. reported the mean conicity index value was 1.42±0.12 among HD patients.30 Another study using the same estimation formula as ours found the mean eLBM value of HD patients to be higher than our findings.28 It should be noted that regardless of age, the type of HD treatment, insufficient food consumption, inactivity, and absorption disorders may cause a decrease in muscle mass, resulting in an increased risk of malnutrition among patients having HD.
In the present study, different malnutrition screening tools were used to assess the risk of malnutrition among patients with CKD, have HD treatment, and interpret the MIS classification findings. Accordingly, although elderly patients were found to be at higher risk of malnutrition than adult patients regarding MIS, over half of the adult patients were at risk, which is considerably higher. The different cutoff values of MIS present differences in the malnutrition risk rates. A study in which the MIS cutoff point was accepted (≥7) higher than ours reported higher malnutrition prevalence with 85.7%, as expected.31 The 7p-SGA was used for adult patients in this study because it has been reported to reflect more time-sensitive responses to dietary changes compared to conventional SGA.19 A slightly higher mean 7p-SGA score among adults was observed in this present study compared to other studies across different population groups.2,9,13 However, this study reported consistent results with studies reporting a malnutrition prevalence ranging from 14.5 to 26.7 in the literature.22,23 A study conducted in Turkey with HD patients reported lower NRI scores than our findings.27 Moreover, in another study, 71.6% of the COVID patients were diagnosed with malnutrition,10 higher than the prevalence determined by NRI. Besides all these findings, according to ROC analysis, 7p-SGA and NRI had diagnostic power, but 7p-SGA was quite high for adult patients. Thus, MIS showed higher sensitivity with 7p-SGA than with NRI, as expected since MIS and 7p-SGA were adapted from the original SGA to identify malnourished patients in CKD.2
This current study reported similar scores and prevalences to other studies in which malnutrition was diagnosed using MNA in patients with end-stage renal disease8 and COVID disease.10,32 Contrary to this, another study reported a lower prevalence than our findings.6 Furthermore, various studies conducted by different population groups reported a malnutrition prevalence by GNRI between 5.6% and 52.7%,6,8,10,32 consistent with our findings. Moreover, Yamada et al. reported that the GNRI had the largest area for the bottom of the curve compared to the MNA, similar to our findings.33 Studies indicate that many health risks are triggered by the decrease of GNRI in patients with HD.3,12,13,22 In addition to these, GNRI was found to be more consistent with MIS, which displayed higher sensitivity with GNRI than MNA among elderly patients, in line with the literature.33
ConclusionIn conclusion, using MIS as a screening tool to diagnose malnutrition would be practical and accurate as it showed higher sensitivity and had the highest consistency with 7p-SGA for adults and GNRI for the elderly patients. Furthermore, since dialysis patients have difficulties providing anthropometric measurement conditions after disease-specific treatment, those indices can be facilitated by developing different formulas or various screening tools to diagnose malnutrition. Besides, considering the ease of use, low cost, and good ability to predict mortality and morbidity-related outcomes, nutritional screening tools may contribute to preventing worsening disease and improving the progress of treatment by early diagnosis of patients with nutritional risks. Although different screening tools are available to screen malnutrition among dialysis patients regarding their age, MIS may be more practical as it is more susceptible to both malnutrition and inflammation that occur concomitantly. However, there is still no standard cutoff point for MIS to classify malnutrition levels, different cut-off values should furtherly be evaluated regarding the specificity and sensitivity of the tool. Therefore, further studies of various nutritional screening tools specific to different age groups would be beneficial to measure the effectiveness of the scales.
Authors’ contributionsBoth authors contributed equally to the conception and design of the study and writing the manuscript. The first author gathered the data, contributed to interpreting the results, and wrote and revised the manuscript. The second author performed the statistical analysis and contributed to interpreting the results, and revised the manuscript. All authors accept full responsibility for all aspects of the research. The manuscript is not under review elsewhere, and we can provide all original data.
FundingThis research did not receive any specific grant from funding agencies in the public, commercial, or not-for-profit sectors.
Competing interestThe authors declared no potential conflict of interest. All authors affirm the honesty, transparency, and accuracy of this manuscript.
The following are the supplementary data to this article: