


With the objective of providing insights and strategic recommendations to enhance the competitiveness of tourism destinations, this study endeavors to examine the nuanced impact of digital technology utilization on the travel intentions of consumers. A comprehensive theoretical framework is developed, incorporating five key mechanisms to elucidate how digital device usage influences consumers’ propensity to travel. Empirical findings indicate that the expansion of information channels and the broadening of social networks constitute the most significant mechanisms through which smartphone usage affects travel intentions. These effects are followed by the enhancement of mutual trust and life convenience, while the augmentation of income levels exerts the weakest influence. Furthermore, this study extends its analysis to the heterogeneous effects of smartphone and digital device adoption across different consumer demographics. The data suggest that the influence of digital technology on travel intentions is particularly pronounced among the middle-aged and elderly, males, extroverts, those with a more pessimistic worldview, and lower-income groups. Drawing upon these findings, this study proposes targeted policy and managerial implications aimed at optimizing the impact of digital technology on travel intentions. These recommendations emphasize innovations in tourism marketing communication channels, the enhancement of tourism service offerings, and the advancement of digital infrastructure, with a focus on aligning digital adoption strategies with the distinctive characteristics of diverse consumer segments.
The pervasive integration of digital intelligent technologies in the 21st century has profoundly impacted various facets of human life, work, and learning. Particularly, the ubiquitous use of smartphones has irrevocably transformed human lifestyles and behaviors (Fritsch et al., 2024; Yu et al., 2023). As co-founder of Apple Inc., Steve Jobs famously remarked, "The phone has become an indispensable part of our lives; we cannot imagine a day without it." According to data from the Global System for Mobile communications Association (GSMA), one of the three major international organizations in the mobile communications sector, the global number of smartphone users had surpassed the 4.3 billion mark by the end of 2021. This statistic implies that over 55% of the global population owns smartphones, with the usage rate continuously ascending over recent years. The widespread utilization of digital smart devices, particularly smartphones, has significantly enriched people's sources of information, providing immense convenience in their daily lives, including travel activities. However, the impact of digital device applications on consumer travel intentions and preferences has not received substantial attention from academia despite the pivotal role of tourism in global economic development today.
Against the backdrop of smartphones and other digital devices becoming indispensable "organs" of human life, significant changes have occurred in people's lifestyles and consumption patterns. What are the underlying reasons behind these changes? Scholars have begun to address these questions, with existing research indicating that smartphones and other digital devices have altered people's habits, including their social interactions (e.g., socializing, conversing), daily activities (e.g., outdoor pursuits, physical exercise, sleep), and mobility patterns (e.g., time spent at different locations, duration, mode of travel) (Harari et al., 2016). On one hand, the use of smartphones and other digital devices has expanded people's social circles and improved information transparency, facilitated interaction and communication (Chen et al., 2024), and provided greater convenience for political participation (Park &Karan, 2014). Additionally, studies have highlighted that the use of smartphones and other digital devices enhances consumers' convenience in consumption, greatly facilitating shopping behaviors and increasing consumer satisfaction (Poushneh, 2021). Simultaneously, it strengthens communication and collaboration in the workplace, thereby enhancing work efficiency (Li et al., 2018). However, the promotion of digital sustainable development through smartphone applications has changed the original business model, resulting in a negative impact. Research indicates that excessive smartphone use can lead to device dependency, increase social anxiety and feelings of loneliness, and adversely affect users' physical and mental health (Geng et al., 2021;Buck et al., 2023). Furthermore, previous studies have demonstrated that digitization negatively affects the socialization and internalization processes of individuals, e.g., excessive use of smartphones and other smart devices can lead individuals to become more engrossed in online activities, thereby affecting offline social interactions, physical exercise, household chores, and participation in religious rituals. This impact is particularly pronounced among adolescent groups (Chen et al., 2024).
Although current research primarily focuses on the influence of smartphones on human behavior and lifestyle habits, some scholars have initiated preliminary discussions on the relationship between smartphone and digital device usage and consumer tourism (Zhou et al., 2022; Stankov & Gretzelet, 2021). Studies indicate that digital smart devices play a crucial role in tourists' travels; the acceptance of artificial intelligence (AI) devices by tourists depends upon social factors, hedonic motives, anthropomorphism, performance and effort expectations, and emotional reactions to such devices (Chi et al., 2022). Moreover, the use of smartphones, computers, tablets, and other digital devices directly impacts tourists' travel experiences, consumption, perceptions, and feelings towards tourist destinations (Tussyadiah & Wang, 2016).
Therefore, the widespread use of digital devices, represented by smartphones, has already exerted a significant impact on consumer tourism activities, and some scholars have initiated preliminary discussions on the aforementioned issues. However, there has been a lack of research on the impact of smartphone and other digital technology applications from the perspective of consumer travel intentions. Hence, our study focuses on the influence of digital devices, represented by smartphones, on consumer travel intentions and attempts to address the following questions: First, what is the impact of digital technology, particularly smartphone usage, on consumer travel intentions? Second, what are the mechanisms through which the use of digital technology, especially smartphones, influences consumer travel intentions? Third, does the impact of digital technology usage on consumer travel intentions vary among different types of consumer groups? If so, where do the differences lie?
Utilizing data from the 2018 China Family Panel Studies (CFPS), our manuscript employs probit models, the KHB method, propensity score matching (PSM), and other analytical techniques to investigate the impact of smartphone and other digital technology usage on consumer travel intentions, with the objective of providing ideas and references for tourism destinations to enhance their competitiveness. In comparison to previous studies, our manuscript contributes marginally in three main aspects: Firstly, we construct a theoretical framework to analyze the impact of digital technology, particularly smartphone usage, on consumer travel intentions, and employ various methods for empirical testing, effectively enriching existing research on the relationship between digital devices and consumer tourism. A literature review revealed the lack of systematic discourse on the influence of digital smart devices on consumer travel intentions. Our research will focus on the changes in consumer travel intentions in the digital economy era, supplementing the deficiencies of existing research and expanding the scope of research on digital devices and consumer tourism. Secondly, we discuss the mechanisms through which smartphone and other digital technology usage influences consumer travel intentions from the perspectives of information channel expansion, social network broadening, The effects of strengthened mutual trust, enhanced life convenience and income level improvements present a clearer demonstration of the relationship and underlying logical impact between the two, thus providing novel insights for future research. Thirdly, considering the differing behavioral preferences of consumers, the use of smartphones may have varying effects on travel intentions among different consumer groups. To address this, our manuscript categorizes consumers into different groups based on age, gender, personality traits, life attitudes and income level, conducting separate analyses and discussions. This approach ensures that our research conclusions are more authentic, credible, and relevant to real-world situations, thus enhancing persuasiveness.
Real background and theoretical frameworkOverview of the real-world context in mobile development and applicationPropelled by the rapid advancements in network technology in the 21st century, smartphones have emerged as the quintessential smart device, embodying traits of convenience, user-friendliness, and efficiency. The onset of the novel coronavirus pandemic in 2019 further catalyzed the proliferation of the "cloud lifestyle model," marked by remote work, digital entertainment, and e-commerce, thereby propelling the pervasive adoption of smartphones. Gradually, individuals transitioned into a symbiotic relationship with their smartphones.
Figs. 1 and 2 portray the evolving landscape of global smartphone usage and its proportional integration into human existence. A discernible trend emerges, illustrating an upward trajectory in the global adoption of smartphones, indicative of its escalating influence across the domains of life, work, and learning. By 2022, a significant milestone was reached, with 60% of the global populace using smartphones. Projections from Strategy Analytics paint a compelling narrative, envisaging a future where smartphone users will surpass the 6 billion mark by 2030, transcending geographical and demographic barriers to encompass over 75% of the world's populace.
.")
.")
Figs. 3 and 4 demonstrate the temporal trajectory of smartphone adoption in China and its consequential global ramifications. Noteworthy as one of the world's premier economies and a vanguard in digital innovation, China has witnessed a significant rise in smartphone adoption, crossing the 1 billion threshold by 2022. Simultaneously, the proportion of Chinese smartphone users within the global population has shown a consistent annual increase, demonstrating China's preeminent stature as a trailblazer in smartphone ubiquity and the pervasive integration of digital technologies.
.")
.")
Examining the evolving trends in global utilization of smartphones reveals their pervasive integration into the daily lives of individuals, rendering them indispensable commodities. Notably, China is not only the world's largest consumer market for smartphones but also hosts the highest number of smartphone users. Concurrently, as one of the world's leading tourist destinations with a burgeoning tourism market, China's smartphone usage has exerted a profound impact on the travel behavior of Chinese tourists. Hence, it is both rational and representative to scrutinize the impact of smartphone applications on consumer travel intentions, using China as a focal point.
The impact of smartphone applications on consumer travel intentions: a theoretical analytical frameworkWe have delineated the contemporary trends in the global development of smartphones and society's increasing dependence on them, recognizing their transformative effects on human behavior. Moreover, the growing indispensability of smartphones in daily life, work, and study may significantly influence individuals' travel intentions. Hence, we will proceed to construct a theoretical framework for discussion, emphasizing five key mechanisms: the information channel expansion effect, social network broadening effect, income level enhancement effect, trust enhancement effect, and life convenience improvement effect.
First, considering the information channel expansion perspective, research indicates that tourists are most interested in information regarding the scenery, cuisine, and culture of prospective destinations, as a comprehensive understanding of such information enhances their attraction and willingness to travel (Torres et al., 2024; Li et al., 2024). The dissemination of information on tourist destinations is crucial, as it encapsulates their ambience and essence, encompassing physical, social, symbolic, and natural dimensions, constituting the primary attraction for tourists. Simultaneously, some studies reveal that the depth of digitalization also demonstrates the values of openness, inclusiveness and enterprise of companies. With the breakthrough of traditional closed and simple performance doctrine, richer tourism projects and construction can fully integrate regional characteristics, thereby attracting tourists (Leal-Rodriguez et al., 2023). The widespread use of smartphones and other digital devices enables the comprehensive online dissemination of information about tourist destinations. This facilitates consumers to acquire travel information rapidly and accurately. Presently, travel and entertainment apps, such as Yelp, Tripadvisor, Guides, and NTO, have garnered widespread consumer utilization, greatly facilitating the collection and access of destination information, thus augmenting consumers' willingness to travel. Additionally, transportation and accommodation are crucial concerns for tourists. Earlier, the lack of digital technology presented challenges regarding transportation and accommodation decisions for consumers. However, the utilization of smartphones and other digital devices effectively addresses this issue (Coenders et al., 2016). A plethora of transportation and accommodation apps, including Airbnb, Booking, Lastminute, Agoda, Hotel Tonight, Trainline EU, Trainline, and Rail Planner, cater to consumers' needs for travel information; they also facilitate the rapid and convenient online travel and accommodation reservations, satisfying consumers' travel requirements and enhancing their willingness to travel.
Second, considering the perspective of social network broadening, internet access promotes enterprise innovation. Tourism enterprises transform from traditional modes to various innovative forms, such as group and cooperative tourism (Liu et al., 2023). Group travel enables tourists to meet like-minded individuals during their travels and enhance their enjoyment. The rapid development of the internet, particularly the widespread application of smartphones and portable digital devices, facilitates like-minded tourists to connect online and further accelerates the dissemination of information, thus significantly increasing consumers' willingness to travel (Strazzullo et al., 2024). Through smartphones and other digital devices, tourists can plan trips and organize travel routes for combined travel. This mode enables tourists to immerse in local customs and traditions, spend more time understanding the unique features of the locale, engage with local people and events, affording them flexibility and freedom beyond conventional tourism forms (Zhang et al., 2020). Thus, smartphone applications transcend geographical constraints, connecting tourists with shared interests and languages across different regions, thereby significantly expanding their social networks, enhancing the willingness to travel, and accelerating the development of new tourism modes, such as group travel and collaborative tourism.
Third, from the perspective of income level enhancement, research indicates a close relationship between consumers' income levels and their travel intentions (Wei et al., 2019). On the one hand, high-income individuals possess greater disposable income for travel expenditure, thereby being more likely to opt for high-quality, high-priced travel products and services. Conversely, low-income individuals may opt for more affordable travel products or even abstain from traveling altogether. At the same time, income inequality will further exacerbate the digital divide and lead to different travel choices for people with different consumption levels. Thus, high-income individuals exhibit stronger travel intentions, whereas those with lower incomes may exhibit weaker or nonexistent travel intentions. On the other hand, the rapid application of smartphones and other digital devices not only effectively expands individuals' employment channels, but also significantly enhances their work efficiency. This may lead to multiple employment, thereby contributing to income level enhancement (Chen et al., 2023; Sumbal et al., 2024). On one hand, technological advancements facilitate the flow of information, enabling job seekers to swiftly acquire necessary employment information and achieve more accurate job matching through online job searches, thereby increasing their employment opportunities. On the other hand, the rapid development of new formats, such as internet-based platforms for ride-hailing, live streaming, food delivery, e-commerce, among others, provides laborers with a more diverse array of employment options, thereby enhancing their incomes. Thus, the application of smartphones and other digital devices effectively enhances consumers' income levels, thereby elevating their willingness to travel.
Fourth, from the perspective of enhanced mutual trust, smartphones and other digital technologies connect consumers to the online space, influencing digitalization of tourism activities. This is achieved by strengthening the transparency, reliability, and real experience of tourism information and services, which promotes consumer recognition of tourist destinations and trust in tourism consumption activities. First, digital devices link consumers to online virtual communities, breaking down barriers of time, space, and culture. The construction of a state-led digital platform can provide support for enterprises and individuals with poor information resources. For instance, combined with the development of the digital economy in Bangladesh, digital technology has effectively broken the barriers between culture and communication, and effectively promoted economic development (Uddin, 2024). This digital representation of tourism not only allows tourism companies to intuitively display the scenic features of tourist destinations, but also provides detailed public information on service guarantees and infrastructure construction. Consequently, consumers can integrate and understand the real and specific conditions of tourist destinations from businesses and other consumers, thereby enhancing their familiarity and recognition of tourism activities and building mutual trust with service providers. Second, trust is built on reducing risks and eliminating behavioral uncertainties (Akhmedova et al., 2020). Through internet data that leave immediate traces, consumers can identify higher-quality tourism platforms, matching their needs with destinations that offer reliable and convenient services (Rijswijk et al., 2023). During the tourism experience, instant reviews and feedback also strengthen the brand image of tourist destinations, further increasing their visibility and establishing a stable mutual trust mechanism with consumers. Finally, some scholars suggest that in a computer-mediated environment, easier exchange of information between companies and consumers and two-way interactions help increase consumer trust in brands, effectively boosting purchase intention (Farías et al., 2023). Smart devices provide conditions for responsive services and online experiences, allowing tourism service companies to respond to consumer queries directly, enhancing the likelihood of potential travel, and creating higher perceived trust in destinations.
Fifth, from the perspective of improved convenience, on one hand, travelers have a strong demand for convenience and are willing to pay for it. This is particularly evident in the process of choosing travel options. A survey of tourists at Japan's international hub airports revealed that they always pre-arrange their travel to control time, waiting, and delay costs (Keumi et al., 2012). In the selection of business class seats for domestic flights in the UK, convenience became the core demand for consumers (Rouncivell et al., 2018). Smart devices can quickly provide real-time information, helping consumers determine appropriate travel timings and effectively coordinate travel schedules with budget constraints. On one hand, smart devices effectively meet the demand for convenience. First, smart communication devices themselves have convenient characteristics, simplifying the information search process for consumers and significantly reducing their time costs. Second, their use is widespread, and the basic information infrastructure provides continuous and stable travel services to consumers. Real-time platform reservations, payments, and other digital services also effectively support tourism. Finally, electronic hardware can also serve as a channel for linking information services, effectively meeting the differentiated preferences of more tourists, improving the quality of consumers’ travel experiences, and ensuring their sustained and positive travel intentions (Park et al., 2018; Zhou et al., 2024).
It is important to note that variations in consumers' behavioral preferences—such as age, gender, personality, life attitudes, and income levels—can significantly influence their travel intentions, subsequently impacting the effectiveness of smartphone applications in the context of tourism. Prior research has demonstrated that these factors play a pivotal role in shaping individuals' travel intentions (Ramkissoon et al., 2023; Xiao et al., 2024). On one hand, differences in these demographic and personal characteristics lead to diverse travel preferences, psychological attitudes towards tourism, preferred types of travel, anticipated outcomes from travel, and specific demands for tourism services. On the other hand, these factors also create considerable heterogeneity in travel motivations (Yang et al., 2023), resulting in the classification of tourists into distinct categories. Tourists with varying travel motivations can generally be grouped into six primary types: sightseeing tourists, business travelers, leisure and recreational tourists, cultural and knowledge-seeking tourists, health and wellness tourists, and shopping tourists. Each type exhibits unique travel needs, purposes, preferences, and consumption behaviors. Consequently, the impact of digital devices, such as smartphones, on enhancing travel intentions may vary across different consumer groups, underscoring the necessity of tailoring digital solutions to align with the specific characteristics and preferences of distinct tourist segments.
Therefore, based on our analysis, we posit the following hypotheses:
Hypothesis 1: The application of smartphones and other digital devices significantly enhances consumers' travel intentions.
Hypothesis 2: The information channel expansion, social network broadening, income level enhancement, mutual trust enhancement, and improved life convenience effects are five crucial mechanisms through which smartphones and other digital devices elevate consumers' travel intentions.
Hypothesis 3: Due to individual differences in age, gender, personality, lifestyle attitudes and income level, the impact of smart phones and other digital devices on the travel intentions of different consumer groups may vary.
This study utilized data from the 2018 China Family Panel Studies (CFPS), released by the China Social Science Survey Center at Peking University. The CFPS dataset encompasses a wide range of micro-level survey data on various aspects of Chinese society, including economics, demographics, education, and health. It covers 25 provinces/municipalities/ autonomous regions in China and includes 16,000 households, making it a comprehensive and reliable source. To ensure the accuracy of our findings, we conducted data preprocessing, including removing missing, invalid, and duplicate values. We extracted relevant variables from the database, resulting in a sample of 5408 cases. Additionally, we matched data on the number of post and telecommunications bureaus in each province of China from the 1985 "China Urban Statistical Yearbook" based on the standard codes of Chinese provinces. There are two main reasons for selecting data from 2018 for this analysis. First, the outbreak of the COVID-19 pandemic in 2020 and the subsequent implementation of quarantine and lockdown policies in China severely restricted travel, leading to significant fluctuations in tourism data. This could introduce considerable interference into our research. Second, the CFPS data for 2018, compared to other years, contain more detailed information regarding travel-related surveys, thereby offering a more comprehensive reflection of consumers' travel intentions. This makes it the most suitable dataset for our study.
Regression modelOur study is based on the 2018 CFPS data, consisting of questionnaire survey data. Given that many variables in our manuscript are binary, we employed the binary choice model probit method to examine the impact of digital technology use on consumer travel intentions and constructed the regression model shown in Eq. (1).

In the provided discourse, the subscripts (i) and (c) are employed to respectively denote individual respondents and their corresponding urban locales. The term "Travel intention" signifies the dependent variable under scrutiny, describing the inclination of interviewees towards travel. Herein, a binary representation is adopted, where a unitary value signals the presence of travel intent, while a null value denotes its absence. Concomitantly, the appellation "Smartphone" encapsulates the realm of digital device utilization, specifically spotlighting the prevalence of smartphones within this context. Evidently, a binary coding scheme is likewise adopted, wherein an affirmative designation denotes smartphone engagement, while a negatory assignment signifies its absence.
Furthermore, drawing from seminal studies (Yuan & Peluso, 2024; Liang et al., 2024), several factors relevant to consumer travel intention were established. These factors encompass but are not confined to occupational nature, educational attainment, labor duration, socio-economic standing, familial harmony, and physiological well-being. Notably, the inclusion of regional fixed effects (μc) served to mitigate the confounding influence of geographical disparities on our analytical conclusions.
Subsequently, in order to interrogate the posited effects of information channel expansion, social network broadening, and income level enhancement, we referred to the methodological underpinnings of the Karlson-Holm-Breen (KHB) approach, as articulated by Karlson (2010, 2012) and Kohler (2011). This methodological apparatus, characterized by its aptitude for mediating effect identification within nonlinear probability models, effectively obviates concerns pertaining to sample selectivity and endogeneity, which are liable to arise due to variable omission and reverse causality. Moreover, its applicability extends seamlessly to probit model frameworks, as delineated by Eq. (2):

Wherein (M) represents the mediator variable, encompassing the information channel expansion, social network broadening, and income level enhancement effects. Each is subjected to meticulous metric evaluation, as explained in subsequent sections. Analogously, all other variables are specified in consonance with Eq. (1). Regressional scrutiny of Eq. (2) furnishes the critical appraisal necessary for discerning the existence of the aforementioned tripartite mechanisms.
Variable measurementDependent variableTravel intention. This construct is operationalized through the utilization of the "travel expenditure" metric derived from the 2018 China Family Panel Studies (CFPS) dataset. Manifestly, a binary classification scheme is adopted, whereby respondents with documented travel expenditure were assigned a unitary value to denote travel intent, while those devoid of such expenditure were assigned a null value.
Explanatory variableSmartphone. Given the widespread use of smartphones as the typical digital interface, the "phone usage" metric from the dataset is harnessed to operationalize this construct. Moreover, to bolster the analytical rigor of subsequent robustness assessments, ancillary metrics, such as "mobile internet usage," "computer internet usage," and "computer usage," substituted for existing measures of smartphone usage.
Control variablesTo enhance research precision and mitigate false correlations, an array of control variables is used. These include occupational nature, educational attainment, labor duration, socio-economic standing, familial harmony, and physiological well-being, each measured meticulously through prescribed item rubrics.
Mediator variablesTo determine the hypothesized mechanisms, we employed designated mediator variables for empirical scrutiny. These included the information channel expansion effect, operationalized through the "importance of the internet as an information channel" metric; the social network broadening effect, gauged via the "importance of socializing online" metric; and the income level enhancement effect, quantified by the "monthly after-tax income" (ten thousand yuan/month); the mutual trust enhancement effect, measured using the "trust in strangers" item; and the improved life convenience effect, assessed using the "satisfaction with one's life" item.
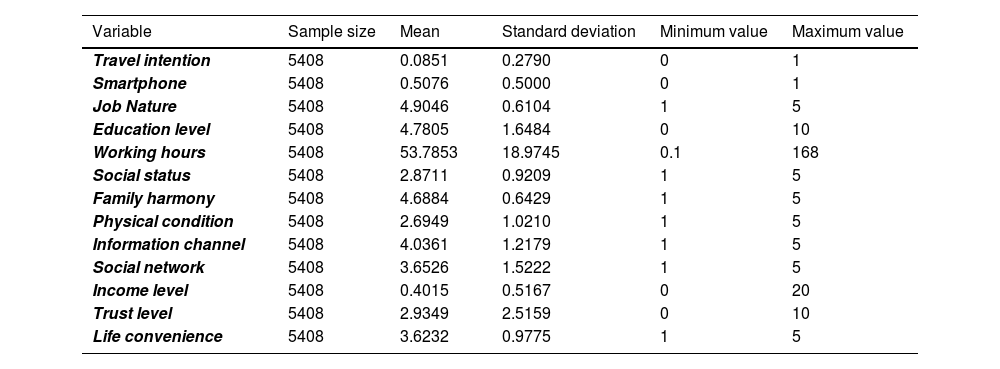
Table 1 conveys the statistical desiderata of all variables marshaled in our analytical endeavors.
Descriptive statistics of variables.
| Variable | Sample size | Mean | Standard deviation | Minimum value | Maximum value |
|---|---|---|---|---|---|
| Travel intention | 5408 | 0.0851 | 0.2790 | 0 | 1 |
| Smartphone | 5408 | 0.5076 | 0.5000 | 0 | 1 |
| Job Nature | 5408 | 4.9046 | 0.6104 | 1 | 5 |
| Education level | 5408 | 4.7805 | 1.6484 | 0 | 10 |
| Working hours | 5408 | 53.7853 | 18.9745 | 0.1 | 168 |
| Social status | 5408 | 2.8711 | 0.9209 | 1 | 5 |
| Family harmony | 5408 | 4.6884 | 0.6429 | 1 | 5 |
| Physical condition | 5408 | 2.6949 | 1.0210 | 1 | 5 |
| Information channel | 5408 | 4.0361 | 1.2179 | 1 | 5 |
| Social network | 5408 | 3.6526 | 1.5222 | 1 | 5 |
| Income level | 5408 | 0.4015 | 0.5167 | 0 | 20 |
| Trust level | 5408 | 2.9349 | 2.5159 | 0 | 10 |
| Life convenience | 5408 | 3.6232 | 0.9775 | 1 | 5 |
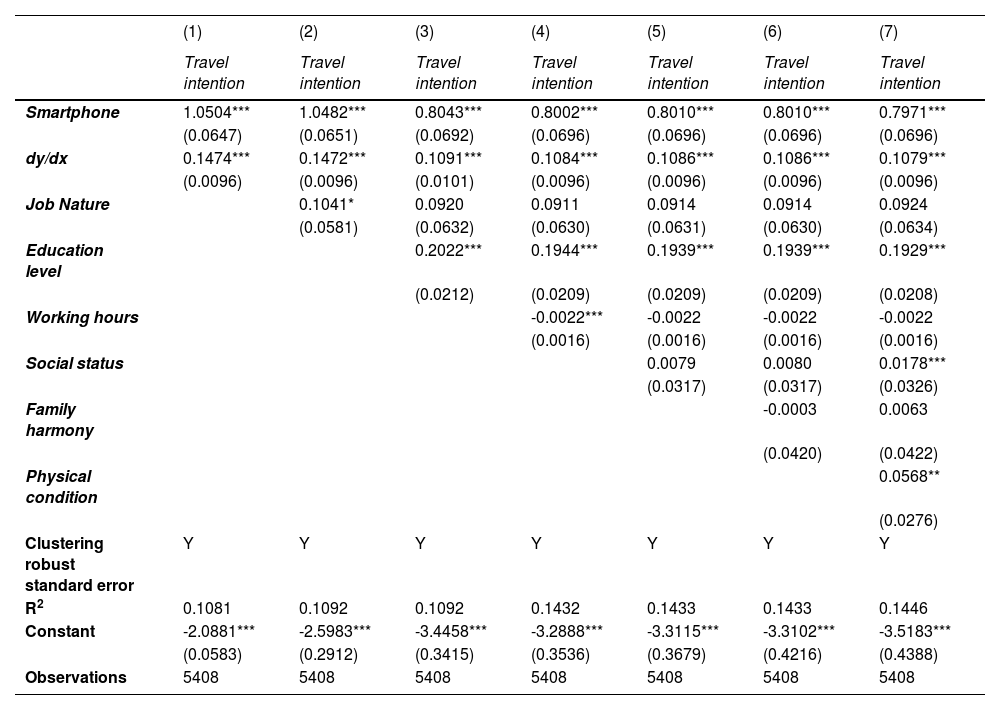
Drawing from the dataset outlined above, we executed regressions utilizing Eq. (1) to scrutinize the impact of smartphone use on consumer travel inclinations. The outcomes are delineated in Table 2. Regression (1) encapsulates the outcomes bereft of control variables. Within this framework, we discerned a notably positive regression coefficient for the explanatory variable "Smartphone," implying a marked enhancement in consumer travel inclinations consequent to digital technology engagement. However, it is imperative to underscore that this conclusion may be subject to the influence of variables, such as consumer health status, familial milieu, and occupational circumstances. Ergo, in regressions (2) through (7), we incrementally integrated the factors that potentially affect consumer travel intentions, encompassing work nature, educational attainment, labor duration, societal standing, familial harmony, and physical well-being. Across all regression iterations, the regression coefficient pertaining to "Smartphone" remains conspicuously positive. This persistence underscores that, even after offsetting consumer and exogenous influences, the utilization of smartphones profoundly augments consumers’ willingness to travel, fostering a buoyant disposition conducive to tourism economic advancement. Thus, this substantiates Hypothesis 1 posited within the manuscript.
Benchmark regression table.
| (1) | (2) | (3) | (4) | (5) | (6) | (7) | |
|---|---|---|---|---|---|---|---|
| Travel intention | Travel intention | Travel intention | Travel intention | Travel intention | Travel intention | Travel intention | |
| Smartphone | 1.0504*** | 1.0482*** | 0.8043*** | 0.8002*** | 0.8010*** | 0.8010*** | 0.7971*** |
| (0.0647) | (0.0651) | (0.0692) | (0.0696) | (0.0696) | (0.0696) | (0.0696) | |
| dy/dx | 0.1474*** | 0.1472*** | 0.1091*** | 0.1084*** | 0.1086*** | 0.1086*** | 0.1079*** |
| (0.0096) | (0.0096) | (0.0101) | (0.0096) | (0.0096) | (0.0096) | (0.0096) | |
| Job Nature | 0.1041* | 0.0920 | 0.0911 | 0.0914 | 0.0914 | 0.0924 | |
| (0.0581) | (0.0632) | (0.0630) | (0.0631) | (0.0630) | (0.0634) | ||
| Education level | 0.2022*** | 0.1944*** | 0.1939*** | 0.1939*** | 0.1929*** | ||
| (0.0212) | (0.0209) | (0.0209) | (0.0209) | (0.0208) | |||
| Working hours | -0.0022*** | -0.0022 | -0.0022 | -0.0022 | |||
| (0.0016) | (0.0016) | (0.0016) | (0.0016) | ||||
| Social status | 0.0079 | 0.0080 | 0.0178*** | ||||
| (0.0317) | (0.0317) | (0.0326) | |||||
| Family harmony | -0.0003 | 0.0063 | |||||
| (0.0420) | (0.0422) | ||||||
| Physical condition | 0.0568** | ||||||
| (0.0276) | |||||||
| Clustering robust standard error | Y | Y | Y | Y | Y | Y | Y |
| R2 | 0.1081 | 0.1092 | 0.1092 | 0.1432 | 0.1433 | 0.1433 | 0.1446 |
| Constant | -2.0881*** | -2.5983*** | -3.4458*** | -3.2888*** | -3.3115*** | -3.3102*** | -3.5183*** |
| (0.0583) | (0.2912) | (0.3415) | (0.3536) | (0.3679) | (0.4216) | (0.4388) | |
| Observations | 5408 | 5408 | 5408 | 5408 | 5408 | 5408 | 5408 |
Note: *, **, and***indicate significanceat the 10%, 5%, and 1% levels. Robust standard errors are in brackets.
To ensure the reliability and robustness of our research findings, we conducted a comprehensive series of analyses, examining the stability of results through various methodological approaches. Employing a spectrum of techniques including variable substitution, alternate estimation methodologies, propensity score matching, instrumental variable analysis, and sensitivity analysis, we sought to scrutinize the consistency and resilience of our conclusions. The outcomes of these robustness checks are meticulously documented and elucidated in Table 3 through 8.
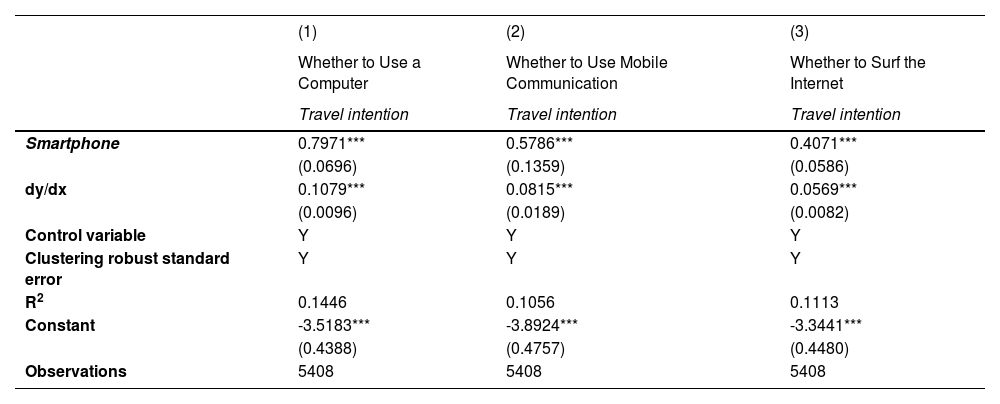
Robustness test - replacement of explanatory variables.
| (1) | (2) | (3) | |
|---|---|---|---|
| Whether to Use a Computer | Whether to Use Mobile Communication | Whether to Surf the Internet | |
| Travel intention | Travel intention | Travel intention | |
| Smartphone | 0.7971*** | 0.5786*** | 0.4071*** |
| (0.0696) | (0.1359) | (0.0586) | |
| dy/dx | 0.1079*** | 0.0815*** | 0.0569*** |
| (0.0096) | (0.0189) | (0.0082) | |
| Control variable | Y | Y | Y |
| Clustering robust standard error | Y | Y | Y |
| R2 | 0.1446 | 0.1056 | 0.1113 |
| Constant | -3.5183*** | -3.8924*** | -3.3441*** |
| (0.4388) | (0.4757) | (0.4480) | |
| Observations | 5408 | 5408 | 5408 |
Note: *, **, and***indicate significanceat the 10%, 5%, and 1% levels. Robust standard errors are in brackets.
In our initial robustness examination, we undertook a meticulous exploration of the implications stemming from substituting the core explanatory variable. Herein, we systematically replaced the metric of digital technology utilization with distinct proxies, namely computer usage, mobile communication engagement, and internet browsing patterns. These substitutes were discerned from responses to items meticulously gathered in the 2018 China Family Panel Studies (CFPS) dataset, capturing nuances of technological engagement, such as "Mobile Internet Usage," "Computer Usage," and "Internet Browsing Usage." The ensuing probit regression results, as presented in Table 3, unveil a compelling narrative.
Table 3 confirms that the coefficients of the focal explanatory variables are statistically significant across all model specifications, steadfastly affirming the catalytic role of digital technology in enhancing consumer travel intentions. Such consistent findings align with the primary narrative elucidated in our preceding analyses, underscoring the significant influence of digital technology on shaping and bolstering consumer travel preferences.
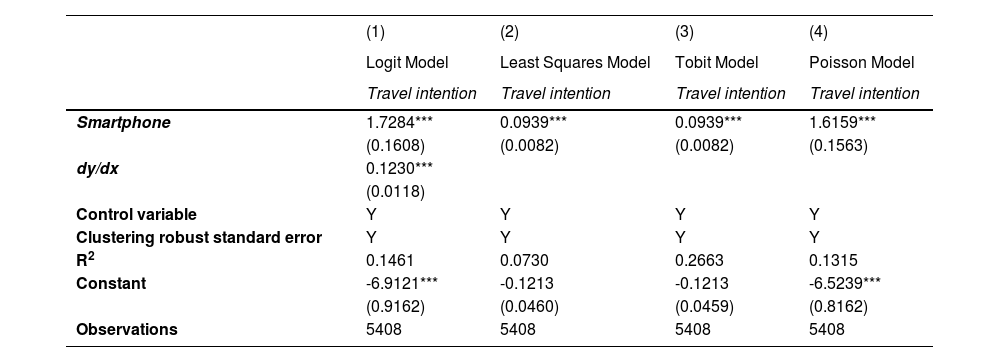
Robustness test II—changing estimation methodsWe further explored the robustness of our findings by employing alternative estimation methods. Specifically, we utilized the Logit, Least Squares, Tobit, and Poisson models to conduct regression tests. The detailed results are presented in Table 4. It is evident that, even after employing alternative estimation methods, the coefficient of the explanatory variable "Smartphone" remains significantly positive across all regression models. This consistency with the baseline regression underscores the robustness of our research findings, suggesting a high degree of reliability in our conclusions.
Robustness test - changing estimation method.
| (1) | (2) | (3) | (4) | |
|---|---|---|---|---|
| Logit Model | Least Squares Model | Tobit Model | Poisson Model | |
| Travel intention | Travel intention | Travel intention | Travel intention | |
| Smartphone | 1.7284*** | 0.0939*** | 0.0939*** | 1.6159*** |
| (0.1608) | (0.0082) | (0.0082) | (0.1563) | |
| dy/dx | 0.1230*** | |||
| (0.0118) | ||||
| Control variable | Y | Y | Y | Y |
| Clustering robust standard error | Y | Y | Y | Y |
| R2 | 0.1461 | 0.0730 | 0.2663 | 0.1315 |
| Constant | -6.9121*** | -0.1213 | -0.1213 | -6.5239*** |
| (0.9162) | (0.0460) | (0.0459) | (0.8162) | |
| Observations | 5408 | 5408 | 5408 | 5408 |
Note: *, **, and***indicate significanceat the 10%, 5%, and 1% levels. Robust standard errors are in brackets.
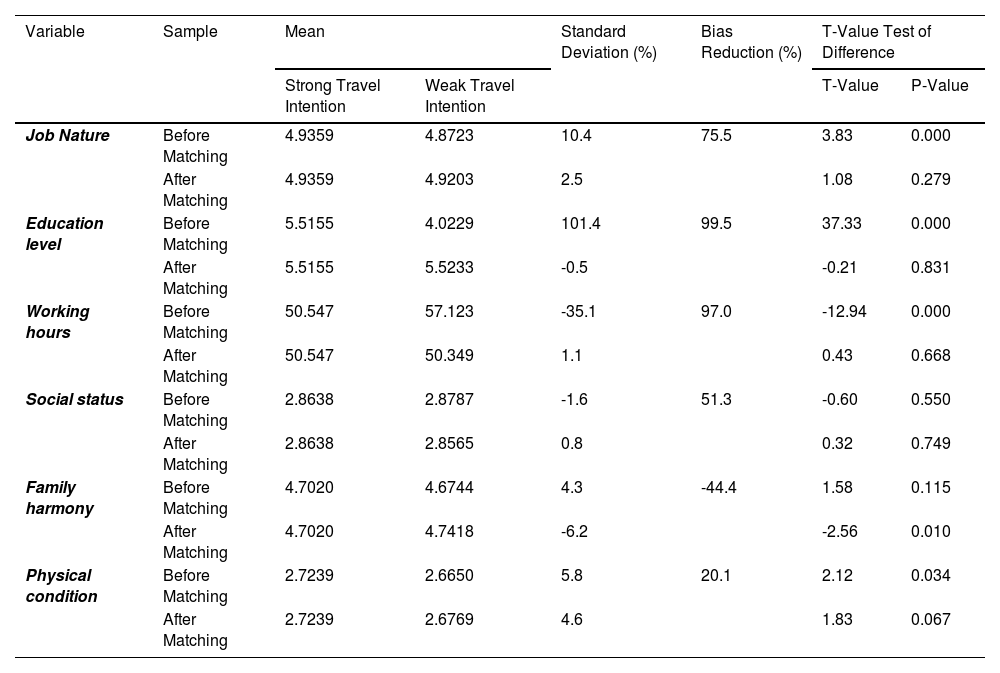
To more accurately assess the net effect of digital technology application on consumer travel intentions, we conducted the propensity score matching method, following the approach outlined by Abadie and Imbens (2016) and others. Specifically, we divided the sample into treatment and control groups, based on the strength of consumer travel intentions. Table 5 presents the results of balance tests. It is observed that before matching, the standard deviations of most control variables are relatively large, indicating significant differences between the treatment and control groups. However, after matching, the absolute values of standard deviations decrease substantially, indicating the elimination of sample selection bias. Hence, the sample, post-propensity score matching, passes the balance test.
Balance test.
| Variable | Sample | Mean | Standard Deviation (%) | Bias Reduction (%) | T-Value Test of Difference | ||
|---|---|---|---|---|---|---|---|
| Strong Travel Intention | Weak Travel Intention | T-Value | P-Value | ||||
| Job Nature | Before Matching | 4.9359 | 4.8723 | 10.4 | 75.5 | 3.83 | 0.000 |
| After Matching | 4.9359 | 4.9203 | 2.5 | 1.08 | 0.279 | ||
| Education level | Before Matching | 5.5155 | 4.0229 | 101.4 | 99.5 | 37.33 | 0.000 |
| After Matching | 5.5155 | 5.5233 | -0.5 | -0.21 | 0.831 | ||
| Working hours | Before Matching | 50.547 | 57.123 | -35.1 | 97.0 | -12.94 | 0.000 |
| After Matching | 50.547 | 50.349 | 1.1 | 0.43 | 0.668 | ||
| Social status | Before Matching | 2.8638 | 2.8787 | -1.6 | 51.3 | -0.60 | 0.550 |
| After Matching | 2.8638 | 2.8565 | 0.8 | 0.32 | 0.749 | ||
| Family harmony | Before Matching | 4.7020 | 4.6744 | 4.3 | -44.4 | 1.58 | 0.115 |
| After Matching | 4.7020 | 4.7418 | -6.2 | -2.56 | 0.010 | ||
| Physical condition | Before Matching | 2.7239 | 2.6650 | 5.8 | 20.1 | 2.12 | 0.034 |
| After Matching | 2.7239 | 2.6769 | 4.6 | 1.83 | 0.067 | ||
For a more intuitive presentation of the alterations in each variable pre- and post-matching, we have graphically illustrated the shifts in standardized biases for each variable in Fig. 5. Through this visual aid, it becomes apparent that after matching, there is a discernible reduction in the standardized biases of all control variables. Furthermore, prior to matching, the dispersion of standardized biases across variables is notable, while post-matching, they predominantly converge around zero, thus reinforcing the methodological soundness and validity of our utilization of propensity score matching techniques.

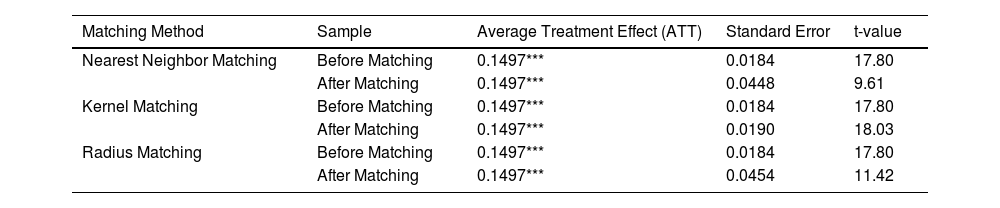
Table 6 presents the outcomes after propensity score matching through three distinct methodologies: caliper nearest neighbor matching, kernel matching, and radius matching. The average treatment effect on the treated (ATT) yields positive results across all methodologies, with statistical significance observed at the 1% level. These findings underscore the substantial positive impact of digital technology utilization on consumer travel intentions, aligning seamlessly with prior research conclusions, thereby reaffirming the accuracy of our research findings.
Test of average treatment effect.
| Matching Method | Sample | Average Treatment Effect (ATT) | Standard Error | t-value |
|---|---|---|---|---|
| Nearest Neighbor Matching | Before Matching | 0.1497*** | 0.0184 | 17.80 |
| After Matching | 0.1497*** | 0.0448 | 9.61 | |
| Kernel Matching | Before Matching | 0.1497*** | 0.0184 | 17.80 |
| After Matching | 0.1497*** | 0.0190 | 18.03 | |
| Radius Matching | Before Matching | 0.1497*** | 0.0184 | 17.80 |
| After Matching | 0.1497*** | 0.0454 | 11.42 |
Note: *, **, and***indicate significanceat the 10%, 5%, and 1% levels. Robust standard errors are in brackets.
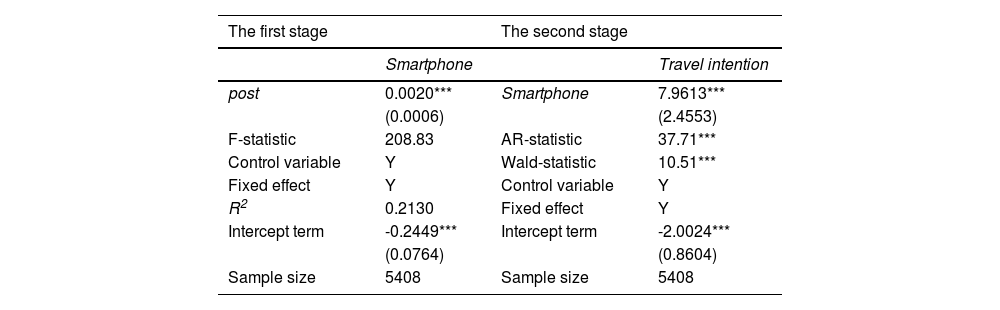
Potential bidirectional causality in our study, i.e., the use of digital technology influencing consumer travel intentions, and vice versa, needs consideration. Therefore, to eliminate potential bidirectional causality issues and simultaneously control for the influence of omitted variables on the study, we employed an instrumental variable (IV) method for examination. Specifically, we referred to relevant studies and adopted the 1984 quantity of Chinese post offices as an instrumental variable for testing (Zhao et al., 2024). After a series of tests, the instrumental variable passed the weak instrument test, correlation test, and the test for instrument relevance, statistically confirming the accuracy of our study. Following the use of instrumental variable analysis, we found that the regression coefficient of the explanatory variable "Smartphone" remained significantly positive, as shown in Table 7. This suggests that the conclusions drawn in our manuscript are not affected by issues, such as bidirectional causality or omitted variables, thus indicating a high level of reliability in our research findings.
Instrumental variable test.
| The first stage | The second stage | ||
|---|---|---|---|
| Smartphone | Travel intention | ||
| post | 0.0020*** | Smartphone | 7.9613*** |
| (0.0006) | (2.4553) | ||
| F-statistic | 208.83 | AR-statistic | 37.71*** |
| Control variable | Y | Wald-statistic | 10.51*** |
| Fixed effect | Y | Control variable | Y |
| R2 | 0.2130 | Fixed effect | Y |
| Intercept term | -0.2449*** | Intercept term | -2.0024*** |
| (0.0764) | (0.8604) | ||
| Sample size | 5408 | Sample size | 5408 |
Note: *, **, and***indicate significanceat the 10%, 5%, and 1% levels. Robust standard errors are in brackets.
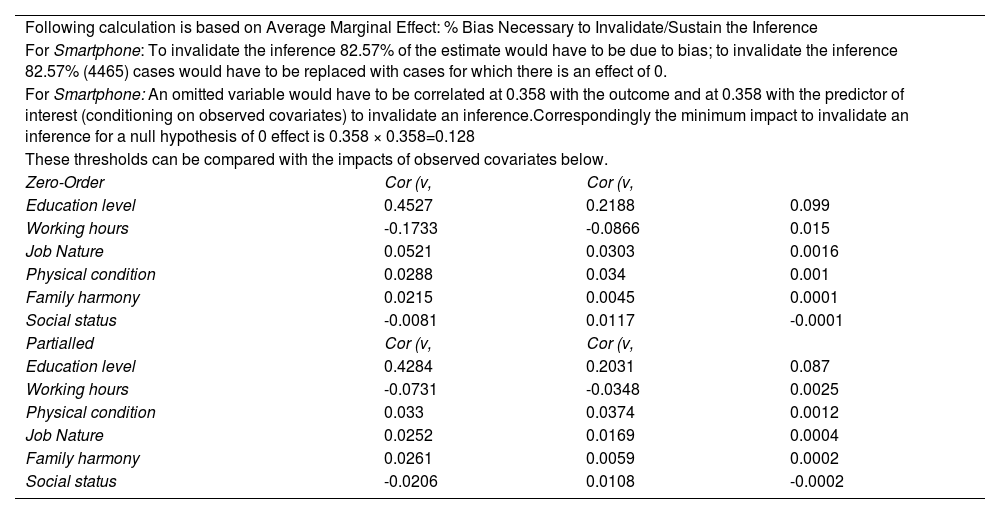
In adherence to the methodological framework elucidated by Frank (2000), we undertook a sensitivity analysis to meticulously scrutinize the potential ramifications of omitted variables on the outcomes of our estimations. The results are delineated in Table 8. Within this tabular exposition, one encounters the deviation percentage pertaining to the robustness of causal inference vis-à-vis omitted variables, or the efficacy in adjudging the validity of causal inference. This percentage, quantified as 82.57%, denotes the discernible proportion of samples that, when supplanted by the null hypothesis, render our research findings null and void. Such a revelation implicitly suggests that 82.57% of samples necessitate replacement by those evincing an effect of 0 to vitiate our research findings.
Sensitivity analysis.
| Following calculation is based on Average Marginal Effect: % Bias Necessary to Invalidate/Sustain the Inference | |||
| For Smartphone: To invalidate the inference 82.57% of the estimate would have to be due to bias; to invalidate the inference 82.57% (4465) cases would have to be replaced with cases for which there is an effect of 0. | |||
| For Smartphone: An omitted variable would have to be correlated at 0.358 with the outcome and at 0.358 with the predictor of interest (conditioning on observed covariates) to invalidate an inference.Correspondingly the minimum impact to invalidate an inference for a null hypothesis of 0 effect is 0.358 × 0.358=0.128 | |||
| These thresholds can be compared with the impacts of observed covariates below. | |||
| Zero-Order | Cor (v, | Cor (v, | |
| Education level | 0.4527 | 0.2188 | 0.099 |
| Working hours | -0.1733 | -0.0866 | 0.015 |
| Job Nature | 0.0521 | 0.0303 | 0.0016 |
| Physical condition | 0.0288 | 0.034 | 0.001 |
| Family harmony | 0.0215 | 0.0045 | 0.0001 |
| Social status | -0.0081 | 0.0117 | -0.0001 |
| Partialled | Cor (v, | Cor (v, | |
| Education level | 0.4284 | 0.2031 | 0.087 |
| Working hours | -0.0731 | -0.0348 | 0.0025 |
| Physical condition | 0.033 | 0.0374 | 0.0012 |
| Job Nature | 0.0252 | 0.0169 | 0.0004 |
| Family harmony | 0.0261 | 0.0059 | 0.0002 |
| Social status | -0.0206 | 0.0108 | -0.0002 |
Note: X represents Smartphone, Y represents Travel intention, v represents each covariate.
These findings, in essence, underscore the robustness of our study. Furthermore, aligning with the elucidations proffered by Frank (2000), we endeavored to ascertain the magnitude by which confounding variables impact the causal inference. This magnitude, as delineated in our study, is defined as the product of the correlation coefficient between the omitted variable and e-commerce (0.358) and its corollary with the dependent variable. This methodologically rigorous computation yields a composite impact of the omitted variable amounting to 0.128. Such a quantitative portrayal intimates that the cumulative effect of the omitted variable on our study is inconsequential, thereby fortifying the veracity and precision of our research findings.
The first and second tables are based, respectively, on unconditional and partial correlations.
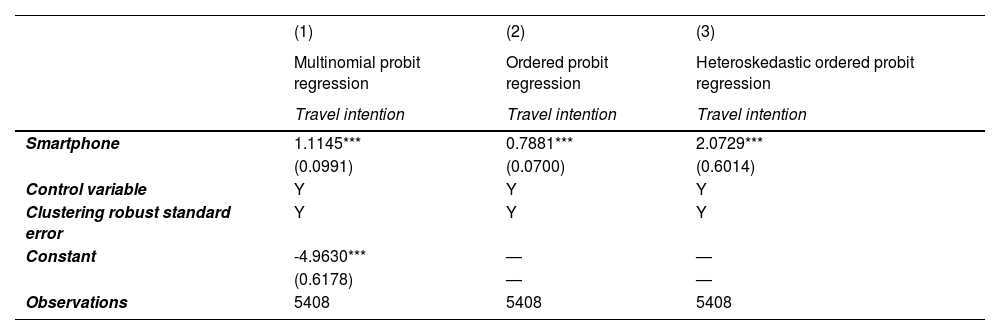
Enhancing model credibilityThe manuscript employs a binary regression model (probit model) for regression estimation. We applied alternative models, including the multinomial probit, the ordered probit, and the heteroscedastic ordered probit models for additional robustness checks. The results are presented in Table 9. Upon examination, it is evident that in all regression specifications, the coefficient for Smartphone remains positive and passes the 1% significance level test, thereby reaffirming the robustness and accuracy of our research findings.
Model credibility enhancement.
| (1) | (2) | (3) | |
|---|---|---|---|
| Multinomial probit regression | Ordered probit regression | Heteroskedastic ordered probit regression | |
| Travel intention | Travel intention | Travel intention | |
| Smartphone | 1.1145*** | 0.7881*** | 2.0729*** |
| (0.0991) | (0.0700) | (0.6014) | |
| Control variable | Y | Y | Y |
| Clustering robust standard error | Y | Y | Y |
| Constant | -4.9630*** | — | — |
| (0.6178) | — | — | |
| Observations | 5408 | 5408 | 5408 |
Note: *, **, and***indicate significanceat the 10%, 5%, and 1% levels. Robust standard errors are in brackets.
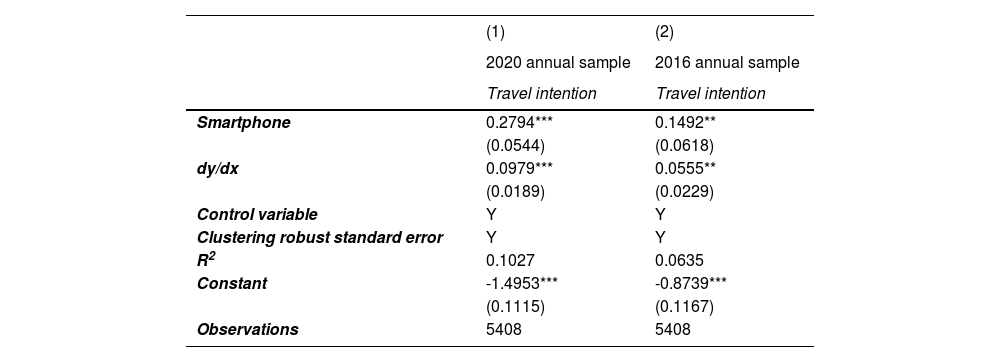
Finally, considering that our study sample consists of cross-sectional data, using data from only one year (2018) for analysis may undermine the credibility of the findings. To address this concern, we collected additional data and conducted regression analyses using CFPS data from both 2016 and 2018. The results are presented in Table 10. Upon substituting the sample, we observe that the regression coefficient for Smartphone remains positive in both regression models and is statistically significant at the 1% level. This further supports the conclusion that the use of smartphones significantly enhances consumers' travel intentions, thereby confirming the robustness of this finding.
Adjusting sample.
| (1) | (2) | |
|---|---|---|
| 2020 annual sample | 2016 annual sample | |
| Travel intention | Travel intention | |
| Smartphone | 0.2794*** | 0.1492** |
| (0.0544) | (0.0618) | |
| dy/dx | 0.0979*** | 0.0555** |
| (0.0189) | (0.0229) | |
| Control variable | Y | Y |
| Clustering robust standard error | Y | Y |
| R2 | 0.1027 | 0.0635 |
| Constant | -1.4953*** | -0.8739*** |
| (0.1115) | (0.1167) | |
| Observations | 5408 | 5408 |
Note: *, **, and***indicate significanceat the 10%, 5%, and 1% levels. Robust standard errors are in brackets.
A solely micro-level analysis of the relationship between smart device usage—particularly that of smartphones—and travel intentions may be insufficient to capture the full complexity of this phenomenon. To provide a more comprehensive and robust examination, this study integrated macroeconomic data and employed the Difference-in-Differences (DID) model, a quasi-experimental econometric technique, to establish a causal link between digital technology adoption and tourism development. The DID model is well-suited for assessing the impact of policy or technological interventions, as it mitigates confounding biases by comparing pre- and post-intervention variations between treatment and control groups. By controlling for time trends and unobserved heterogeneity, the DID approach enhances the validity and reliability of causal inferences.
This study utilized panel data from 285 prefecture-level cities in China spanning 2003–2020, with regional tourism economic development levels as the dependent variable, operationalized through urban tourism revenue. The primary independent variable was the "Broadband China" strategy, a landmark national initiative introduced by the Chinese government to accelerate digital infrastructure development and technological diffusion. This policy not only facilitated the expansion of broadband networks and the enhancement of digital infrastructure, but also promoted the widespread adoption of emerging technologies, such as artificial intelligence (AI), the Internet of Things (IoT), cloud computing, and big data analytics, across urban regions. The systematic and structured rollout of this policy offers an optimal quasi-experimental setting for investigating the causal impact of digital technology adoption on the tourism sector.
The "Broadband China" strategy provides a stable and continuous policy framework, strengthening the applicability and robustness of the DID model in evaluating the economic effects of digital transformation on the tourism industry. To operationalize the DID estimation, we defined a treatment variable (treat), assigning a value of 1 to cities that were incorporated into the "Broadband China" strategy and 0 to those that were not. Additionally, we introduced a time variable (time), where the year in which a city was included in the policy and all subsequent years were coded as 1, while the years prior to its inclusion were coded as 0. The interaction term between treat and time represents the DID estimator, capturing the differential impact of digital technology adoption on tourism economic performance. This methodological approach ensures a rigorous empirical evaluation of how digital infrastructure advancements influence tourism development across diverse regions.
Table 11 reports the results of our regression analysis using the DiD model. The findings reveal that the regression coefficients for the explanatory variable are positive and statistically significant at the 1% level. Moreover, our model accounts for individual city-specific differences and temporal trends, thereby controlling for potential confounding influences. These macro-level regression results substantiate the validity of our conclusions. Specifically, they indicate that the application of digital devices, such as smartphones, and the widespread adoption of digital technologies significantly enhance consumer willingness to travel, thereby playing a crucial role in the recovery and growth of the tourism economy.
Regional macro level testing.
| Travel | |
|---|---|
| Dig | 0.3398*** |
| (0.1073) | |
| Clustering robust standard error | Y |
| R2 | 0.0255 |
| Constant | 0.0505 |
| (0.0871) | |
| individual fixed effect | Y |
| Time fixed effect | Y |
| Observations | 5130 |
Note: *, **, and***indicate significanceat the 10%, 5%, and 1% levels. Robust standard errors are in brackets.
The application of the Difference-in-Differences (DiD) model necessitates the assumption that, prior to the policy intervention, there are no significant divergences in the trends between the treatment and control groups. To verify the validity of this assumption, we conducted a parallel trends test, using the year of the policy implementation as the baseline period. The results of this test are illustrated in Fig. 6, which reveal that prior to the "Broadband China" strategy, the regression coefficients for the explanatory variable were not statistically significant, indicating no discernible trend divergence between the treatment and control groups with respect to tourism economic development. However, beginning in the second year following the implementation of the policy, the coefficients became statistically significant, suggesting a marked and positive effect of the strategy on the development of the tourism economy. This finding further suggests that the policy's influence on tourism growth exhibits a temporal lag before its full impact is realized.

Therefore, the results of the parallel trends test substantiate the notion that the implementation of digital policies, such as the "Broadband China" strategy, significantly enhances tourism consumption and catalyzes the growth of the tourism economy. This further validates and strengthens the conclusions drawn from our study.
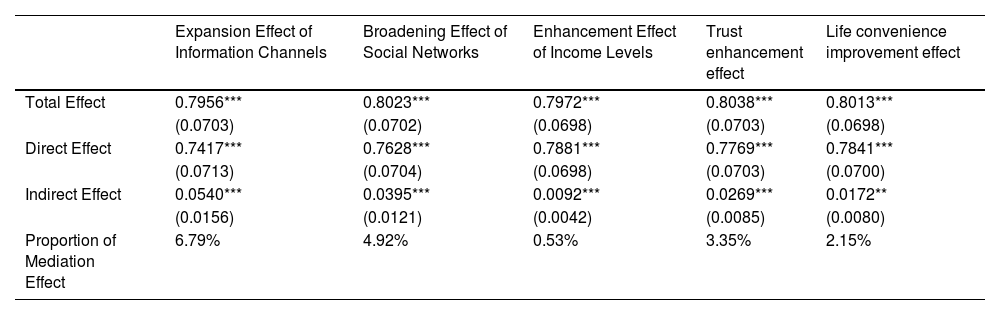
Further analysisMechanism Examination and Analysis: To examine the five mechanisms proposed in the theoretical section of the manuscript—namely, the information channel expansion, social network broadening, income level enhancement, mutual trust enhancement, and improved life convenience effects—we applied the KHB method for regression testing. The regression results for these five mechanisms are presented in Table 12. From the results, it is evident that the indirect effect regression coefficients for all five mechanisms are significantly positive, indicating that the use of smartphones enhances consumers' travel intentions by expanding their information channels, broadening their social networks, improving their income levels, increasing their trust in others, and enhancing their life convenience. This finding is consistent with Hypothesis 2 of our manuscript.
Analysis of mediating mechanisms.
| Expansion Effect of Information Channels | Broadening Effect of Social Networks | Enhancement Effect of Income Levels | Trust enhancement effect | Life convenience improvement effect | |
|---|---|---|---|---|---|
| Total Effect | 0.7956*** | 0.8023*** | 0.7972*** | 0.8038*** | 0.8013*** |
| (0.0703) | (0.0702) | (0.0698) | (0.0703) | (0.0698) | |
| Direct Effect | 0.7417*** | 0.7628*** | 0.7881*** | 0.7769*** | 0.7841*** |
| (0.0713) | (0.0704) | (0.0698) | (0.0703) | (0.0700) | |
| Indirect Effect | 0.0540*** | 0.0395*** | 0.0092*** | 0.0269*** | 0.0172** |
| (0.0156) | (0.0121) | (0.0042) | (0.0085) | (0.0080) | |
| Proportion of Mediation Effect | 6.79% | 4.92% | 0.53% | 3.35% | 2.15% |
Note: *, **, and***indicate significanceat the 10%, 5%, and 1% levels. Robust standard errors are in brackets.
Furthermore, a comparison of the regression coefficients across the different mechanisms reveals that the information channel expansion effect holds the largest proportion, i.e., 6.79%, among the mediating mechanisms. The social network broadening effect follows, with a proportion of 4.92%. The mutual trust enhancement effect ranks third, with a proportion of 3.35%, followed by the improved life convenience effect at 2.15%, and the income level enhancement effect, which contributes the least, with only 0.53%. These results suggest that, among the five mechanisms, the information channel expansion and social network broadening effects are the most significant in influencing consumers' travel intentions through smartphone use. The mutual trust enhancement and improved life convenience effects follow, while the income level enhancement effect has the weakest impact.
To further assess the robustness of the five mechanisms outlined in this manuscript and ensure their accuracy and reliability, we conducted additional testing and verification.
On the one hand, in exploring the impact of smart device usage—primarily smartphones—on travel intentions, we accounted for multiple variables that mediate or interfere with this relationship. To ensure the accuracy and reliability of our findings, we incorporated a set of control variables, including occupation type, educational attainment, work duration, socioeconomic status, family cohesion, and physical health. Furthermore, following Aparisi et al. (2024), we introduced additional control variables, such as income level, employment status, and household registration differences to mitigate potential confounding effects.
Information channel expansion effectWithin the information channel expansion mechanism, multiple factors may introduce interference. First, occupation type may impact access to travel information through non-digital channels. For instance, manufacturing workers, despite their low smartphone usage, may still obtain travel information via industry networks. Second, differences in educational attainment may create a substitution effect between traditional media (e.g., travel agency consultations) and smartphone-based channels. Third, income disparities may enable high-income individuals to access offline information sources (e.g., paid travel advisors), thereby weakening the monopoly of digital devices over travel information. Controlling for these variables isolates the true role of smart devices in information access.
Social network broadening effectRegarding the social network broadening mechanism, certain offline factors may act as substitutes for smartphone-mediated network expansion. First, socioeconomic status may shape offline social capital, as higher-status individuals often rely on existing social networks for travel recommendations, independent of smartphone usage. Second, family cohesion may foster travel decision-making through direct interpersonal communication, creating a parallel pathway to smartphone-based social interaction. Third, household registration differences may lead to region-specific collective travel norms (e.g., clan-based tourism traditions), reducing the reliance on smartphone-driven cross-regional networking. Introducing these control variables prevents traditional social structures from distorting the mediation effect of smart devices.
Trust enhancement mechanismWithin the trust enhancement mechanism, pre-existing individual characteristics may obscure the role of digital technology. First, educational background may serve as a foundation for trust formation, as past service experiences may influence perceptions of reliability, confounding the actual effect of smartphone-driven trust mechanisms. Second, economic status may induce brand loyalty effects, where individuals transfer trust from established technology brands, rather than develop trust in digital services per se. Third, health status may contribute to a generalized trust effect, where prior experiences with medical devices lead to higher acceptance of technological solutions. Controlling for these factors eliminates the bias introduced by pre-existing trust structures.
Perceived convenience in daily lifeWithin the perceived convenience mechanism, external factors may distort the perceived role of smartphones. First, occupation type may determine access to corporate travel management systems, which offer similar functionalities to personal devices, thereby reducing the necessity of smartphone use. Second, variations in work duration may introduce physical fatigue effects, potentially causing distorted convenience evaluations. Third, income levels may allow higher-income individuals to delegate travel planning to personal assistants, creating a class-based substitution effect that diminishes the perceived necessity of smartphones. Controlling for these variables ensures that perceived convenience stems directly from smart device usage, rather than occupational or economic privileges.
Income level enhancement effectWithin the income level enhancement mechanism, institutional factors may interact with digital technology in influencing travel decisions. First, employment stability, particularly through paid leave policies, may directly ensure the feasibility of travel, independent of smartphone usage. Second, household registration differences may alter the cost structure of tourism through localized public service benefits (e.g., discounts for local residents at tourist sites). Third, social security coverage may function as a risk-buffering mechanism, indirectly enhancing travel consumption capacity. Controlling for these variables removes the implicit institutional interventions that could otherwise distort the relationship between income and travel intentions.
By incorporating these extensive control variables, we effectively mitigated the influence of potential confounders, ensuring that our findings accurately capture the impact of smart device usage on travel intentions, rather than being driven by alternative socioeconomic, institutional, or behavioral factors.
The regression results presented in Table 13 demonstrate that, while the coefficients for the different mechanisms exhibit some variations, the significance levels remain consistent. Moreover, the relative weightings of the various mechanisms align with the previous analysis, reinforcing the credibility and robustness of our findings. This suggests that the conclusions drawn regarding the mechanisms are highly reliable.
Robustness test of mediating mechanisms 1.
| Expansion Effect of Information Channels | Broadening Effect of Social Networks | Enhancement Effect of Income Levels | Trust enhancement effect | Life convenience improvement effect | |
|---|---|---|---|---|---|
| Total Effect | 0.7922*** | 0.7928*** | 0.7932*** | 0.7993*** | 0.7967*** |
| (0.0706) | (0.0704) | (0.0701) | (0.0706) | (0.0701) | |
| Direct Effect | 0.73918*** | 0.7419*** | 0.7845*** | 0.7728*** | 0.7788*** |
| (0.0715) | (0.0714) | (0.0701) | (0.0706) | (0.0702) | |
| Indirect Effect | 0.0530*** | 0.0509*** | 0.0087*** | 0.0265*** | 0.0179** |
| (0.0147) | (0.0143) | (0.0032) | (0.0066) | (0.0077) | |
| Proportion of Mediation Effect | 6.69% | 6.42% | 1.09% | 3.32% | 2.25% |
Note: *, **, and***indicate significanceat the 10%, 5%, and 1% levels. Robust standard errors are in brackets.
On the other hand, to further validate the robustness of the mechanism analysis, we applied a random sampling approach, performing 100 iterations of random sampling for the analysis. The results are presented in Table 14. Upon examination, it is evident that while the coefficient values for the various mechanisms exhibit some degree of variation, the significance levels and their respective weights remain consistent with the original findings. This consistency reinforces the credibility and robustness of the conclusions drawn from our mechanism analysis, providing further assurance of their reliability.
Robustness test of mediating mechanisms 2.
| Expansion Effect of Information Channels | Broadening Effect of Social Networks | Enhancement Effect of Income Levels | Trust enhancement effect | Life convenience improvement effect | |
|---|---|---|---|---|---|
| Total Effect | 0.7964*** | 0.7973*** | 0.7982*** | 0.8043*** | 0.8018*** |
| (0.0704) | (0.0702) | (0.0699) | (0.0704) | (0.0699) | |
| Direct Effect | 0.7427*** | 0.7460*** | 0.7894*** | 0.7775*** | 0.7846*** |
| (0.0714) | (0.0712) | (0.0699) | (0.0704) | (0.0700) | |
| Indirect Effect | 0.0538*** | 0.0513*** | 0.0088*** | 0.0267*** | 0.0172** |
| (0.0147) | (0.0144) | (0.0032) | (0.0066) | (0.0075) | |
| Proportion of Mediation Effect | 7.04% | 6.48% | 1.10% | 3.32% | 2.15% |
Note: *, **, and***indicate significanceat the 10%, 5%, and 1% levels. Robust standard errors are in brackets.
Given the nuanced behavioral preferences among consumers, it is imperative to explore how smartphone utilization affects travel intentions across different consumer segments. Factors, such as age, gender, personality traits, lifestyle attitudes, and income levels significantly influence travel preferences, thereby impacting the effectiveness of smartphone applications (Sinha et al., 2024; Ramkissoon et al., 2023). Consequently, we have segmented our analysis based on these factors to meticulously investigate and juxtapose the varying impacts of smartphone usage on travel intentions.
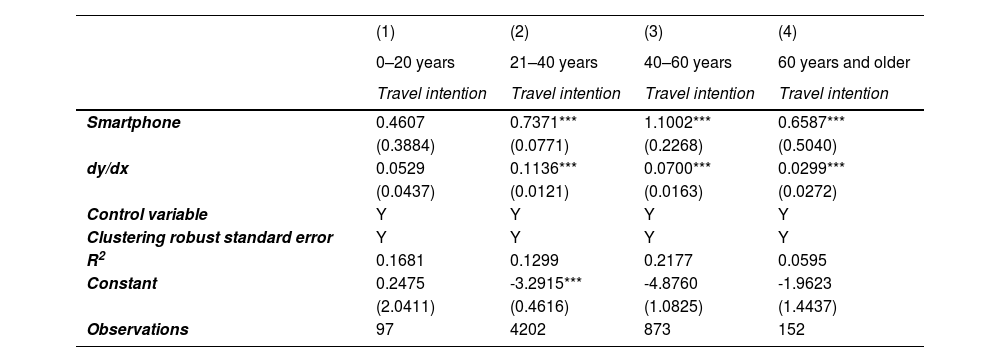
Initially, we stratified our sample into four distinct consumer cohorts based on age: 0–20 years, 21–40 years, 40–60 years, and over 60 years. The classification into four periods is based on the notable differences in the interests and needs of tourists at various age levels, differences that have been extensively studied and confirmed by numerous scholars (McEwen, 1999; Coste et al., 2012; Leung et al., 2024). Upon scrutiny, we observed a noteworthy disparity in the significance level of the explanatory variable regression coefficients across these cohorts, as seen in Table 10. Specifically, the regression coefficients pertaining to the explanatory variables exhibited insignificance within the 0–20 years cohort. Conversely, in the remaining three cohorts, these coefficients manifested significance and a positive trend. This intriguing observation intimates that while smartphone and digital technology utilization exerts a statistically negligible influence on travel intentions of adolescents aged 0–20 years, it substantially amplifies those of other demographic segments. This dichotomy could be attributed to the prevailing circumstances wherein a significant proportion of individuals within the 0–20 years bracket are still students and lack the financial autonomy to embark on independent travel endeavors, thereby reducing the discernible impact of smartphone utilization on their travel intentions. Conversely, the financial independence characteristic of the other demographic cohorts empowers them to travel autonomously, thereby enhancing their travel intentions through smartphone and digital technology adoption.
Furthermore, upon delving deeper into the absolute values of the regression coefficients of the explanatory variables within each cohort in Table 15, a fascinating trend emerged. Notably, the 21–40 years cohort showcased the highest absolute value of the regression coefficient, denoting a pronounced enhancement effect of smartphone usage on travel intentions within this demographic cohort. This phenomenon can be elucidated by the fact that individuals within the 21–40 years age bracket are typically entrenched in a phase of robust physical and career development, rendering them the cornerstone of travel consumption. Consequently, the integration of smartphones and digital technologies augments their travel intentions manifold by furnishing unparalleled convenience and facilitating seamless travel experiences. Conversely, the over-60-years cohort evinced the lowest absolute value of the regression coefficient, signaling a subdued impact of smartphone utilization on travel intentions within this demographic segment. This attenuation may be attributable to multifarious factors encompassing health concerns and familial obligations, which collectively curtail the travel proclivity and capability of individuals aged over 60 years, thereby diminishing the overarching influence of smartphone usage on their travel intentions.
Age heterogeneity.
| (1) | (2) | (3) | (4) | |
|---|---|---|---|---|
| 0–20 years | 21–40 years | 40–60 years | 60 years and older | |
| Travel intention | Travel intention | Travel intention | Travel intention | |
| Smartphone | 0.4607 | 0.7371*** | 1.1002*** | 0.6587*** |
| (0.3884) | (0.0771) | (0.2268) | (0.5040) | |
| dy/dx | 0.0529 | 0.1136*** | 0.0700*** | 0.0299*** |
| (0.0437) | (0.0121) | (0.0163) | (0.0272) | |
| Control variable | Y | Y | Y | Y |
| Clustering robust standard error | Y | Y | Y | Y |
| R2 | 0.1681 | 0.1299 | 0.2177 | 0.0595 |
| Constant | 0.2475 | -3.2915*** | -4.8760 | -1.9623 |
| (2.0411) | (0.4616) | (1.0825) | (1.4437) | |
| Observations | 97 | 4202 | 873 | 152 |
Note: *, **, and***indicate significanceat the 10%, 5%, and 1% levels. Robust standard errors are in brackets.
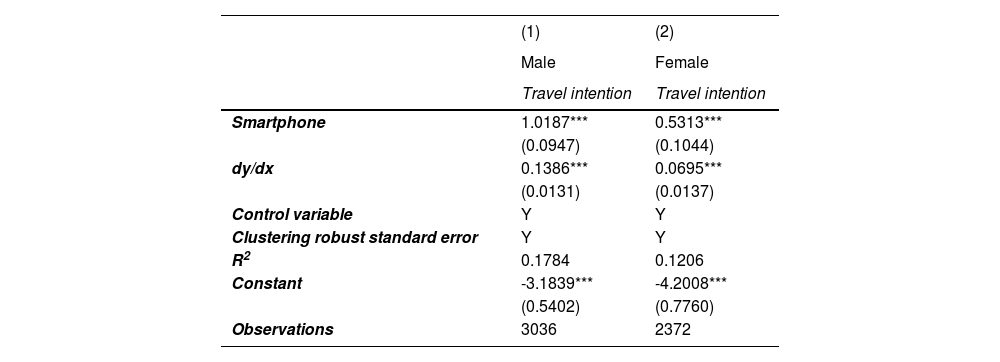
Subsequently, we delineated our analysis based on gender. The sample was bifurcated into male and female consumer cohorts, as shown in Table 16. Upon juxtaposing the regression coefficients of the explanatory variables across these cohorts, a noteworthy observation emerged. Specifically, the regression coefficients for both male and female consumer cohorts exhibited statistical significance at the 1% level, indicating a pronounced propensity for smartphone and digital technology usage to significantly bolster travel intentions across both genders. However, upon closer examination of the absolute values of these coefficients, it became apparent that the male consumer cohort exhibited higher absolute values compared to their female counterparts. This phenomenon can be attributed to the traditional roles played by males in the travel domain, wherein they often undertake the responsibilities of itinerary planning, accommodation arrangements, and sightseeing, etc. (Nguyen et al., 2022). Leveraging the considerable information provided by smartphones, male consumers can navigate through their travel endeavors with heightened ease and convenience, thereby enhancing travel intentions.
Gender heterogeneity.
| (1) | (2) | |
|---|---|---|
| Male | Female | |
| Travel intention | Travel intention | |
| Smartphone | 1.0187*** | 0.5313*** |
| (0.0947) | (0.1044) | |
| dy/dx | 0.1386*** | 0.0695*** |
| (0.0131) | (0.0137) | |
| Control variable | Y | Y |
| Clustering robust standard error | Y | Y |
| R2 | 0.1784 | 0.1206 |
| Constant | -3.1839*** | -4.2008*** |
| (0.5402) | (0.7760) | |
| Observations | 3036 | 2372 |
Note: *, **, and***indicate significanceat the 10%, 5%, and 1% levels. Robust standard errors are in brackets.
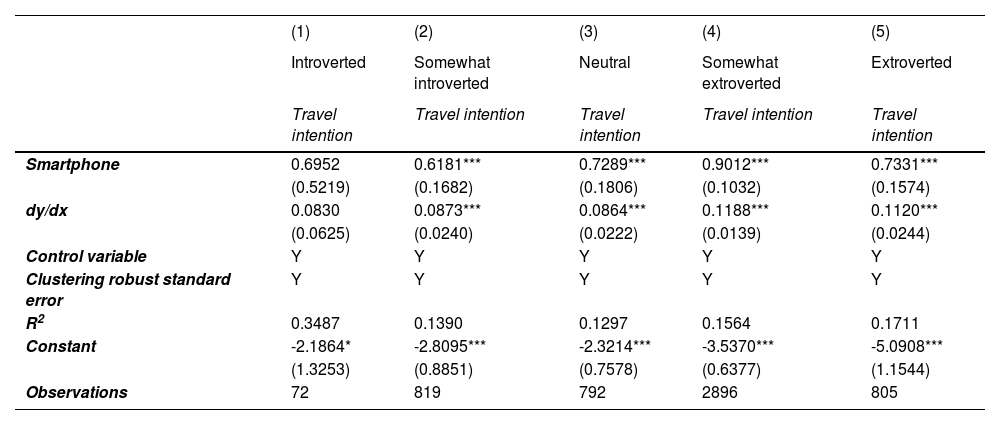
Once again, we proceeded to stratify our analysis based on consumer personality traits. The entire sample was categorized into five distinct consumer cohorts: introverted, somewhat introverted, neutral, somewhat extroverted, and extroverted. Upon contrasting the regression coefficients of the explanatory variables across these cohorts, a notable pattern emerged, as seen from Table 17. Specifically, the regression coefficient for the explanatory variable was statistically insignificant within the introverted consumer cohort, whereas it demonstrated statistical significance at a positive level for the remaining four cohorts. These findings suggest that smartphone and digital technology utilization significantly augments travel intentions among all personality types, except introverted consumers. The underlying rationale for this phenomenon may stem from the inclination of introverted individuals to avoid external interactions, preferring solitary pursuits and eschewing participation in large-scale events or interactions in crowded venues (DeMeo et al., 2023). Consequently, introverted individuals may be less inclined to travel, thereby rendering smartphone and digital technology utilization less impactful on their travel intentions. Further scrutiny of the absolute values of regression coefficients across the remaining four cohorts reveals that the coefficients for the "somewhat extroverted" and "extroverted" consumer cohorts are markedly higher than those for the "somewhat introverted" and "introverted" ones. This observation underscores that smartphone and digital technology utilization exert the strongest enhancing effect on travel intentions among personality types characterized by greater extroversion.
Personality heterogeneity.
| (1) | (2) | (3) | (4) | (5) | |
|---|---|---|---|---|---|
| Introverted | Somewhat introverted | Neutral | Somewhat extroverted | Extroverted | |
| Travel intention | Travel intention | Travel intention | Travel intention | Travel intention | |
| Smartphone | 0.6952 | 0.6181*** | 0.7289*** | 0.9012*** | 0.7331*** |
| (0.5219) | (0.1682) | (0.1806) | (0.1032) | (0.1574) | |
| dy/dx | 0.0830 | 0.0873*** | 0.0864*** | 0.1188*** | 0.1120*** |
| (0.0625) | (0.0240) | (0.0222) | (0.0139) | (0.0244) | |
| Control variable | Y | Y | Y | Y | Y |
| Clustering robust standard error | Y | Y | Y | Y | Y |
| R2 | 0.3487 | 0.1390 | 0.1297 | 0.1564 | 0.1711 |
| Constant | -2.1864* | -2.8095*** | -2.3214*** | -3.5370*** | -5.0908*** |
| (1.3253) | (0.8851) | (0.7578) | (0.6377) | (1.1544) | |
| Observations | 72 | 819 | 792 | 2896 | 805 |
Note: *, **, and***indicate significanceat the 10%, 5%, and 1% levels. Robust standard errors are in brackets.
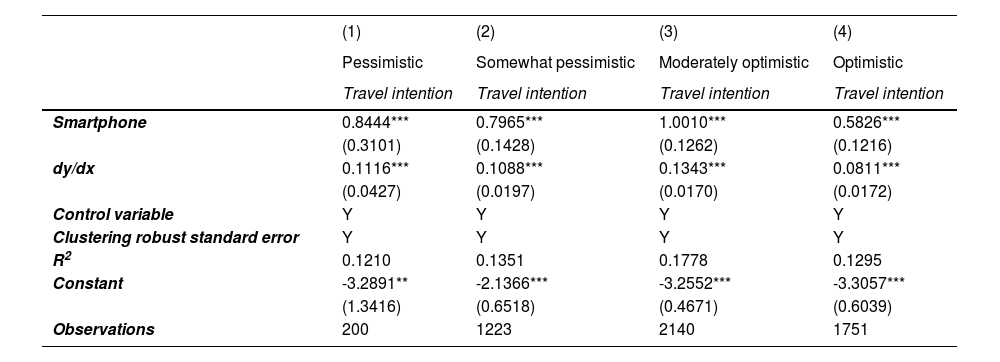
Furthermore, we classified all samples into four categories based on attitude towards life: pessimistic, somewhat pessimistic, moderately optimistic, and optimistic. Upon comparing the regression coefficients of these four groups, we find that all groups exhibit positive coefficients at the 1% significance level, as demonstrated in Table 18. This indicates a significant enhancement in the willingness to travel due to the use of smartphones and other digital technologies among all these groups. However, there are substantial differences in the absolute values of the regression coefficients among the groups. The coefficient for the optimistic group is the lowest, suggesting a relatively smaller impact of smartphone applications on the travel willingness of optimistically inclined consumers. This might be attributed to the inherently high travel inclination among optimists, who are more inclined towards activities, such as tourism, outdoor hiking, and picnics. Consequently, while the use of smartphones and digital technologies facilitates travel activities for this group, its marginal effect on enhancing travel willingness appears relatively modest compared to other groups.
Heterogeneity of life attitudes.
| (1) | (2) | (3) | (4) | |
|---|---|---|---|---|
| Pessimistic | Somewhat pessimistic | Moderately optimistic | Optimistic | |
| Travel intention | Travel intention | Travel intention | Travel intention | |
| Smartphone | 0.8444*** | 0.7965*** | 1.0010*** | 0.5826*** |
| (0.3101) | (0.1428) | (0.1262) | (0.1216) | |
| dy/dx | 0.1116*** | 0.1088*** | 0.1343*** | 0.0811*** |
| (0.0427) | (0.0197) | (0.0170) | (0.0172) | |
| Control variable | Y | Y | Y | Y |
| Clustering robust standard error | Y | Y | Y | Y |
| R2 | 0.1210 | 0.1351 | 0.1778 | 0.1295 |
| Constant | -3.2891** | -2.1366*** | -3.2552*** | -3.3057*** |
| (1.3416) | (0.6518) | (0.4671) | (0.6039) | |
| Observations | 200 | 1223 | 2140 | 1751 |
Note: *, **, and***indicate significanceat the 10%, 5%, and 1% levels. Robust standard errors are in brackets.
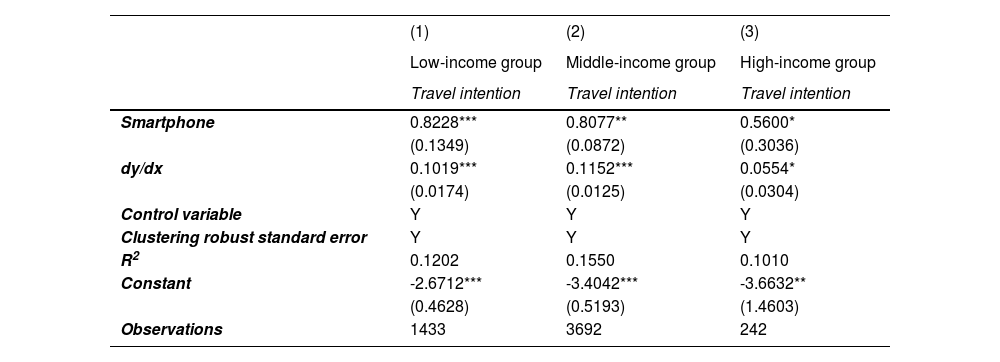
Finally, to further examine the role of income disparities, we categorized the sample based on respondents' local income levels, as indicated by the question, "What is your income in the local area?" The sample was divided into low, middle, and high-income groups, and separate regression analyses were conducted for each group. The results are presented in Table 19. The findings indicate that the regression coefficient for the explanatory variable "smartphone" is both statistically less significant and smaller in magnitude for the high-income group, compared to the other two groups. This suggests that the influence of smartphone and other digital devices on travel intentions is more pronounced among the low and middle-income groups. One potential explanation for this effect is that smartphones and other digital technologies serve as tools that enable these groups to enhance their income and mitigate the financial barriers to travel. In contrast, the impact of smartphones and digital technologies on the travel intentions of the high-income group appears relatively weaker, possibly because such technologies do not significantly contribute to increasing their income but enhance convenience or stimulate interest in travel. Consequently, it can be concluded that the influence of smartphone and digital technologies on travel intentions is more substantial for lower and middle-income groups, whereas it is less pronounced for higher-income groups.
Heterogeneity of income.
| (1) | (2) | (3) | |
|---|---|---|---|
| Low-income group | Middle-income group | High-income group | |
| Travel intention | Travel intention | Travel intention | |
| Smartphone | 0.8228*** | 0.8077** | 0.5600* |
| (0.1349) | (0.0872) | (0.3036) | |
| dy/dx | 0.1019*** | 0.1152*** | 0.0554* |
| (0.0174) | (0.0125) | (0.0304) | |
| Control variable | Y | Y | Y |
| Clustering robust standard error | Y | Y | Y |
| R2 | 0.1202 | 0.1550 | 0.1010 |
| Constant | -2.6712*** | -3.4042*** | -3.6632** |
| (0.4628) | (0.5193) | (1.4603) | |
| Observations | 1433 | 3692 | 242 |
Note: *, **, and***indicate significanceat the 10%, 5%, and 1% levels. Robust standard errors are in brackets.
To further explore the relationship between varying degrees of income growth and travel intentions, we examined how smart devices reshape consumer perceptions of wealth, particularly among low- and middle-income groups, thereby reducing the financial burden traditionally associated with travel.
On one hand, emerging digital platforms have introduced flexible income-generation channels, enabling sustainable financial accumulation. On the other hand, digital financial innovations and the rise of the sharing economy have systematically transformed consumers’ perception of spending thresholds, shifting travel decisions from "whether one can afford to travel" to "how to optimize travel expenditures." This technological intervention disrupts the conventional budget-versus-necessity dichotomy, expanding the range of travel choices available to consumers.
In contrast, for high-income groups, the role of digital technology shifts towards enhancing experiential quality rather than affordability. The rise of intelligent algorithms fosters a heightened awareness of personalized travel preferences, which are then actualized through advanced digital tools. This shift creates a "quality-over-quantity" consumption logic, where travel decisions prioritize exclusive, highly customized experiences over sheer frequency or volume.
This differentiation highlights the distinct patterns of consumption stratification in the digital economy. Low- and middle-income consumers exhibit greater technological adaptability and responsiveness, as digital innovations provide them with new avenues for economic mobility. Conversely, high-income consumers encounter diminishing marginal returns on digital enablement, as their discretionary spending capacity is already well-established. This divergence underscores the evolving role of digital technology in shaping stratified consumption behaviors within modern tourism economics.
By synthesizing the foregoing analyses, the observed heterogeneous effects across variables, such as age, gender, personality traits, life attitudes, and income levels underscore the differential impact of smartphone and digital device usage on travel intentions across distinct consumer segments. These findings substantiate the validity of Hypothesis 3 posited in our study.
Discussion and conclusionConclusionIn the contemporary landscape of the 21st century, the widespread use of smartphones has profoundly transformed not only human work, but also various aspects of research and daily life. As Richard Branson, the founder of the Virgin Group, once remarked, "A mobile phone is like a heart; it makes us stronger." Beyond offering convenience in professional and personal spheres, smartphones and other digital devices have significantly influenced travel behavior. This study focused on whether the extensive adoption of digital smart devices, represented by smartphones, affects consumers’ travel intentions.
First, we conducted regression analyses to verify the impact of smartphone usage on travel intentions. Our findings demonstrate that the application of digital technology and the widespread use of smart devices significantly enhance consumers’ inclination to travel, providing insights into increasing the competitiveness of tourism destinations. To ensure the accuracy and robustness of our regression results, we conducted instrumental variable analysis, alternative variable measurement methods, alternative estimation methods, propensity score matching, and sensitivity analyses. Furthermore, we employed additional tests using other regression models, macro-level quasi-experimental validation, and random sampling methods, all of which confirmed the validity of our conclusions.
Second, to further explore the mechanisms through which digital devices influence travel intentions, we hypothesized five key mediating effects: (1) information channel expansion, (2) social network broadening, (3) mutual trust enhancement, (4) improved convenience in daily life, and (5) increased income levels. Among these mechanisms, the expansion of information channels and the broadening of social networks emerged as the most influential pathways through which smartphone usage shapes consumer travel intentions. Our empirical analysis also validated the effects of mutual trust enhancement and improved convenience, though their influence ranked slightly lower. The income-enhancing effect, however, exhibited the weakest impact, contributing minimally to changes in travel intention. These findings align with the research conclusions of Zhou et al. (2023) and Deb et al. (2024).
Tourism behavior is driven by a combination of pragmatic economic considerations and leisure-seeking motivations. On the one hand, the use of smartphones has broadened information channels, allowing digital marketing to permeate the decision-making and consumption processes of tourists, thereby enhancing travel willingness. On the other hand, financial planning remains a critical factor influencing potential travelers, and the adoption of digital platforms has accelerated the transformation of traditional tourism models. This shift has led to greater transparency in tourism expenditures, more efficient interactions between businesses and consumers, and enhanced trust in digital platforms. At the same time, the increased accessibility of information and financial resources has also contributed to the emergence of a digital divide, wherein disparities in the access to digital resources and literacy further exacerbate existing socio-economic inequalities. Consequently, these factors have interfered with the income-enhancing effect of digital devices, making it the weakest mediating mechanism among those examined. By integrating these diverse impact pathways, we can better understand the role of digital technology in shaping travel intentions, thereby identifying actionable strategies for the integration of digital technology and tourism industry development.
Finally, after establishing the mechanisms through which smart devices influence travel intentions, we conducted a heterogeneity analysis to distinguish different consumer segments, offering a more targeted perspective on the integration of smart devices and the tourism industry. Our data analysis revealed significant variations in the influence of digital technology on travel intentions across different demographic groups, based on age, gender, personality traits, attitudes toward life, and income levels. Specifically: Consumers aged 40–60 years exhibited the strongest responsiveness to smartphone-induced travel motivation, followed by those aged 21–40 years. Men were more influenced by smartphone usage in their travel decisions than women. Extroverted consumers’ travel willingness increased the most due to smartphone and digital technology usage. Optimistic consumers demonstrated higher overall travel intentions, but pessimistic consumers were more susceptible to external influences stemming from digital technology and social connections.
By refining target audience identification, we can further optimize digital tourism marketing strategies and tailor innovations in digital tourism models to better align with consumer demand characteristics. These insights contribute to theoretical advancements in tourism research while offering practical implications for developing digital tourism in the era of smart technology.
ImplicationsFollowing the conclusion, the revival of the global tourism industry post the COVID-19 pandemic underscores the importance of enhancing consumer travel intentions and accelerating tourism economy development, an aspect that many countries have begun to prioritize. Our manuscript confirms that the use of smartphones and other digital devices significantly boosts consumer travel intentions. Furthermore, by examining influencing mechanisms and conducting differential tests among different consumer groups, our study provides a theoretical basis for stimulating the development of tourism economy, stimulating tourism consumption and enhancing the competitiveness of tourism destinations.
By distinguishing the impact pathways of smart devices on tourism consumption, it becomes evident that the integration of digital technology enhances tourism willingness and innovation in three primary ways.
First, it drives innovation in tourism communication methods, exemplified by the expansion of information channels and the digitalization of trust-based connections. Emerging tourism information dissemination and interaction platforms—such as tourism promotion websites, tourism service applications, and social interaction platforms—enable more intuitive displays of tourism-related information, thereby facilitating the formation of interactive networks among consumers as well as between consumers and service providers. Consequently, it is essential to optimize digital tourism marketing strategies, advance the branding of tourist attractions and cities, and establish new channels to disseminate and promote tourism information (Tajvidi et al., 2017). Specifically, tourism marketing websites and service applications effectively present environmental conditions and tourism project details, providing consumers with comprehensive information support to enhance their understanding of regional tourism resources. Feedback from tourism guide websites and hotel management sites in countries like India, Uganda, and Romania indicates that factors, such as website navigation, information volume, and page interactivity, can alter consumers’ perceptions of risk and benefit, influencing their choices (Lepp et al., 2014; Khare et al., 2020). Therefore, convenience and interactivity are the core elements to consider while designing navigation websites and tourism applications. For instance, the Hong Kong Disneyland website primarily employs a 'text + image' format for information presentation, facilitating an intuitive and efficient search experience. Additionally, the website supports multiple language options, catering to the linguistic needs of international tourists. Analyzing its response speed, the average loading time of the Hong Kong Disneyland website is 0.97 ss, ensuring a swift and efficient response to user inquiries. To further enhance interactivity, tourism service booking applications can leverage mobile smart information devices to deepen users’ sensory and emotional engagement in the interactive experience. Comparing the international tourism review and booking platform, TripAdvisor, with the Chinese comprehensive tourism-sharing platform, Mafengwo, the former provides a highly convenient commercial booking service, offering extensive user-generated short reviews and ratings for hotels, restaurants, and attractions. Through search algorithms and verified operator authentication, consumers can comprehensively compare and select tourism services. However, TripAdvisor's interactivity is relatively weak, as it primarily relies on brief reviews and ratings, and its globalized information structure often lacks localized details. In contrast, Mafengwo has deeply cultivated China's lower-tier tourism markets, positioning in-depth travel blogs as its core value proposition. By integrating interactive features, such as Q&A, comments, and follows, the platform fosters a comprehensive travel decision-making, experience-sharing, and knowledge-exchange ecosystem. This user-generated content model enables a detailed presentation of regional tourism information. Additionally, the emphasis on in-depth travel experiences enhances active user engagement, as Mafengwo facilitates connections with 'community experts,' allowing users to find local guides or experience providers, thereby increasing tourism participation and platform loyalty.
Furthermore, aligning with García et al. (2024) on online information reliability, ensuring consistency between reviews published on tourism service platforms and evaluations on other platforms is crucial. Verifying and standardizing information across multiple platforms can significantly enhance the electronic word-of-mouth (eWOM) effect, fostering consumer trust in the quality of tourism service. Consequently, tourism marketing and review management must extend beyond informational websites and service booking applications to encompass a broader spectrum of social media platforms, including TikTok, Facebook, Instagram, and Snapchat, to shape a cohesive tourism brand image. Considering the unique characteristics of different social platforms, various strategies can be employed to encourage consumers to share their tourism experiences. For instance, thematic tourism hashtags can be created on visual and short-video-driven platforms, such as TikTok and Instagram, to amplify the dissemination of tourism information through topic-based marketing. This can be complemented by online-offline hybrid campaigns, where consumers are incentivized to participate in giveaways, location check-ins, or event engagements while sharing their experiences online. Tourism can be further promoted by collaborating with key opinion leaders (KOLs) and key opinion consumers (KOCs) and inviting them to document and share their travel experiences through images, written content, and lifestyle videos. Interactive engagement methods, such as Q&A sessions and polls, can also be utilized to introduce tourism services and products, leveraging the fan economy to expand the reach and influence of tourism offerings. Finally, continuous real-time monitoring of promotional content across tourism review platforms and social media is necessary to assess the effectiveness of marketing strategies. A comprehensive, data-driven approach that evaluates multiple dimensions—such as webpage and app click-through rates, sentiment analysis, bookmark-to-conversion ratios, point-of-interest (POI) check-in growth rates, and hotel booking redirection rates—can help refine and optimize tourism promotion methods, ensuring greater consumer engagement and the effective promotion of tourism activities.
Finally, existing studies show that consumer reviews displayed on platforms, such as Facebook, Booking, and Priceline, directly affect perceived trust, product understanding, and consumers' willingness to purchase (Foris et al., 2020; Khan et al., 2023). This implies that it is crucial to maintain the image management of tourist destinations and promote word-of-mouth effects. Accordingly, an emergency public relations plan should be established to mitigate risks associated with public opinion. On the one hand, a graded response mechanism for public opinion should be implemented, along with the development of a dynamic sensitive-word database. By identifying negative keywords related to local tourist attractions, such as 'fraud' or 'misleading photography,' timely feedback can be ensured (Ladhari et al., 2015). On the other hand, algorithmic content regulation should be utilized to adjust recommendation weights within content pools, while contracted influencers can be engaged to disseminate positive content, thereby counterbalancing negative narratives. Simultaneously, a corrective action-sharing module can be incorporated into tourism information platforms to disclose service improvement updates, allowing partnered content creators to conduct real-time assessments and share their insights.
Second, the integration of digital technology in tourism not only enhances travel willingness and innovation, but also contributes to advancing tourism experience content through the facilitation of life-service optimization and the expansion of digitalized social networks. As technological innovation broadens the conceptual and practical scope of tourism experiences, travelers can gain a more immediate understanding of the regional and cultural characteristics embedded in tourism activities, while simultaneously engaging more deeply with these experiences. This enhances the psychological impact of tourism on visitors. Additionally, the uniqueness of tourism activities has become an integral topic of consumer social interactions, contributing to daily discourse and embedding itself in various aspects of social engagement and self-presentation. Therefore, it is essential not only to further enhance the level of digital innovation in tourism content to evoke positive consumer experiences, but also to ensure that such content is topically relevant and shareable, fostering multi-layered interactions among tourism projects, participants, and potential consumers. To achieve this, online tourism services should be enriched, and systems for online booking, tourism guidance, and real-time interactive responses should be refined. These improvements represent a significant enhancement in service quality, contributing to a more comfortable tourism environment. For example, in the domain of services for special-needs populations, the 'GetYourGuide' platform utilizes augmented reality (AR) technology to enable real-time sign language translation and employs haptic feedback through electronic devices, facilitating exponential growth in adoption among special-needs users. In terms of risk and emergency management, the 'Expedia' platform developed a real-time global risk data synchronization system during the COVID-19 pandemic, enabling millisecond-level refund processing for travel bookings, significantly enhancing consumer satisfaction. In technological innovation and integration, the 'Hopper' platform has improved pricing prediction accuracy by 28% through quantum pricing algorithms, thereby enhancing service quality for consumers. These cases illustrate that the increasing application of mobile information devices for comprehensive user data collection and personalized services is becoming more prevalent in tourism applications. Thus, further advancements in dynamic pricing, travel planning, accessibility design, and sustainable development should be pursued to deepen the integration of smart technologies into tourism services, ultimately driving innovation in tourism service content.
Moreover, enhancing the interactivity of tourist attractions is key to leveraging smart devices to enrich tourism experiences. Disney theme parks undoubtedly emerge as a leader in designing interactive tourism features. By using movies as a key tool to stimulate travel intentions, they integrate plot stories and character images into landscape design and various interactive elements, which not only drive the commercial application of cultural intellectual properties (IPs), but also strengthen the unique experiential qualities of tourism activities through story-like character interactions (Florido et al., 2023). Based on this case, first, attention should be paid to the spatial design of tourist attractions. The Disney theme park utilizes 3D projections, dynamic seating, mist effects, and other technologies to enhance the realism of the scenes. Meanwhile, the park's signature scents and tactile vibration systems further strengthen the synergy of consumers’ senses. Therefore, simulating the park environment and incorporating multisensory facilities can effectively improve visitors' interactive experiences. Second, what sets Disney apart is the role-playing interaction between the staff and visitors. Leveraging the original intellectual property (IP) stories and the data from visitors' MagicBands, performers engage in personalized dialogues with visitors based on pre-set scenarios. This can be expanded through an interactive innovation model that combines virtual and real elements, occasionally integrating popular intellectual properties (IPs) from animations and movies. By using official character interactions, visitors’ emotional involvement can be heightened, encouraging them to engage in role-playing, thereby fostering spontaneous connections between them and the environment of a particular tourist spot. Third, the connection between tourism viewing and consumption experiences can form a closed-loop. For example, the Hedwig owl toy at Universal Studios Beijing's Harry Potter theme area has a "magical awakening" feature, allowing it to "stick" to the visitor's shoulder. The staff, dressed as movie characters, conducts an "adoption ceremony" for each customer. In this context, tourism products with storytelling and interactivity, as opposed to merely collectible items, can significantly enhance visitors' willingness to engage in consumption.
Lastly, the key to integrating smart technology with tourism content lies in enhancing both the presentation and the experiential quality. Therefore, exploring the unique cultural history and legendary stories of a region, transforming them into key content for interactive tourism experiences is necessary. Therefore, the communicative attributes of mobile information platforms can be expanded. A representative example of this is virtual tourism, which is based on the digitization of cultural heritage. Virtual tourism provides both opportunities for the preservation and dissemination of fragile cultural heritage, as it not only makes local imaginations more tangible for visitors, enriching their experiential memories, but also enhances the willingness to visit cultural heritage sites (Ji et al., 2023). However, according to the views of scholar Katherine, high exposure to cultural heritage does not entirely equate to the revitalization of attention and presence for the heritage landscape. Therefore, the technological reproduction of landscapes through virtual tourism needs to evoke visitors' empathy and engagement (Burlingame, 2022; Choi et al., 2022), encouraging them to establish connections with the landscapes and inspiring them to share their own stories. This way, technology can effectively break the barriers of time and space.
Third, represented by the income-enhancing effect, the application of smart technology and devices reflects the widespread adoption of digital infrastructure, showcasing how the integration of digital technology improves the overall living conditions of residents. This enhancement not only enriches material consumption demands, but also meets the spiritual and cultural needs of residents, thereby providing more stable and long-lasting support for residents' tourism consumption. To further enhance the willingness for tourism, on one hand, efforts should continue to promote the digitalization of society, offering possibilities for expanding information channels, enriching social networks, and building digital trust. On the other hand, efforts should be made to improve residents' digital integration, enhance the digital literacy of underserved groups, and elevate the digital access and skills of the broader consumer base. In this regard, Yunnan Province in China launched the 'One Mobile Phone to Tour Yunnan' smart tourism platform in 2018. Leveraging Alibaba Cloud's digital infrastructure, the platform not only created virtual tourism experiences for the ancient town of Lijiang, but also introduced cultural heritage projects, such as AR learning for Dongba script and digital workshops for Bai ethnic tie-dyeing. Additionally, it trained over 30,000 rural digital guides, deployed more than 2000 digital stations, and designed age-friendly platforms. This initiative effectively addressed issues related to insufficient regional digital coverage and the low digital literacy of marginalized groups, resulting in a 146% increase in tourism growth from 2018 to 2023. This case demonstrates that a digital platform constructed through government-market-technology collaboration can effectively enhance regional tourism vitality, integrate local cultural tourism resources, and innovate government-enterprise cooperation models, thus promoting the comprehensive development of regional economy, culture, and tourism. In conjunction with the analysis of heterogeneous consumer groups, we have demonstrated that middle-aged and elderly groups, male consumers, extroverts, and pessimists are more sensitive to tourism information provided through digital devices. In connection with the influence mechanism of smart devices on tourism willingness discussed earlier, it is necessary to further refine the directions for innovation and upgrade tourism information channels and service offerings, and digital infrastructure. First, the needs of middle-aged and elderly groups should be considered while developing digital communication and marketing for tourism. For instance, tourism software can incorporate health security reminder functions that monitor users' steps, heart rate, and other indicators during travel activities. In case of an emergency, the system should be able to promptly contact emergency contacts to ensure the safety of elderly travelers. Additionally, the software interface should be designed to accommodate "senior-friendly" versions, enlarging the font size and simplifying the operation steps for ease of use. In the process of expanding tourism information channels, a group of opinion leaders who are trusted by middle-aged men should be established. This could include retired military personnel, teachers, and doctors they are likely to communicate with and trust. On one hand, cooperation can be established with these lifestyle and travel-sharing influencers, positioning them as ambassadors for sharing tourism experiences. They can introduce scenic activities and services through videos, texts, and images, creating an interactive experience that resonates emotionally with middle-aged male audiences. On the other hand, themed activities can be designed, such as travel and life-sharing for peers, where Key Opinion Leaders (KOLs) and Key Opinion Consumers (KOCs) initiate events. By leveraging innovative communication effects, these activities can amplify the perceived participation in tourism and boost the desire and enthusiasm of middle-aged men to share their travel experiences. It is also important to identify the major software used and media accounts followed by these groups. By using big data to push personalized preferences, marketing efforts can be targeted more precisely. From the 'China Mobile Internet Annual Report' and 'Global Social Media Demographic Trends,' it can be observed that middle-aged and elderly males in China primarily use information software, such as WeChat, Toutiao, Tencent News, Douyin, and Kuaishou, while those abroad tend to favor platforms like Facebook, LinkedIn, BBC News/CNN, as well as video streaming sites, such as YouTube and Netflix. Given the characteristics of these digital platforms, it is clear that renowned personalities and authoritative organizations, respectively, validating and clarifying tourism information channels are of relative importance for the middle-aged and elderly male demographic. Therefore, the efforts of large travel companies in communicating real-time tourism information, the design and promotion of tourism activities by local government cultural tourism departments, and the classification and rating of tourism resource quality by professional research institutions can better validate the quality of tourism activities. These can help create stable and reliable channels for tourism information dissemination.
Next, in terms of innovation in tourism content, on one hand, extroverted and pessimistic consumers tend to be more active on social platforms, demonstrate higher sensitivity to perceived risks, and demand higher quality in consumer products. Therefore, the digital integration of tourism services should balance both functional stability and interactive sociality. For example, travel apps should establish in-depth, shared tourism information communities, offering detailed, parameterized itinerary planning. This not only allows for intuitive comparisons of accommodation, dining, and service options, but also includes monitoring and forecasting of various risks, such as weather conditions, traffic delays, and other disruptions. Additionally, travel service apps can incorporate convenient video editing and beautification functions. For instance, the 'Travel Photography' feature on 'Mafengwo' generates millions of short videos daily, providing easy-to-use social interaction services. On the other hand, the design of tourism project content needs to consider the practical needs of specific groups, such as middle-aged, male, extroverted, and pessimistic individuals, to enhance their experience and sense of participation in tourism activities. For example, Saudi Arabia has integrated fitness activities with tourism, promoting the development of community sports and landscapes, which aligns with the health needs of middle-aged and elderly individuals (AlMarzooqi, 2023). Simultaneously, Yunnan Province in China has introduced the 'Traditional Chinese Medicine Health Tourism Route,' which integrates regional medicinal herb cultivation landscapes, offering visitors a digitalized experiential program. This initiative is not confined only to cultural wellness, but also encompasses more adventurous activities, regional historical and cultural retrospectives, as well as hands-on experiences of traditional craftsmanship—activities that are likely to appeal to various demographic groups.
Furthermore, regarding the expansion of digital infrastructure, it is essential to strengthen data behavior management and negative feedback response mechanisms, specifically tailoring them to middle-aged individuals, male consumers, extroverted individuals, and those with a pessimistic worldview. These groups, being more susceptible to the influence of smart technology, are more inclined to participate in tourism activities. Consequently, it is critical to track and document their tourism consumption behaviors and decision-making processes in real-time, thus enabling the identification of areas for the iterative optimization of tourism services and projects. Additionally, this demographic is more likely to rapidly receive tourism-related information and share it through digital platforms. Therefore, it is necessary to design effective public opinion management strategies that monitor emotional intervention thresholds, mitigate perceived risks and pessimism, and present tourism experiences more accurately and positively.
Limitations and future directionsLike other studies, our work has certain limitations, but these limitations also provide a foundation for future research.
First, due to the constraints of the sample data, we were unable to incorporate a time dimension allowing a more dynamic analysis by considering the temporal differences in the impact of smartphones on travel intentions. Without incorporating the time factor into our study, our conclusions may be biased. Therefore, it would be valuable to consider the duration of smart device usage and accordingly analyze the differing tourism behavior intentions. In this context, the theory of habit formation can be referenced to explain the intervention of prolonged mobile device use on users' tourism intentions. A controlled experiment could be conducted to compare groups with different smartphone usage durations. Time series analysis methods, or Long Short-Term Memory (LSTM) neural networks, could be employed to process users' smartphone usage behavior over time, enabling the examination of the dynamic process through which technology exposure leads to behavioral transformation. This approach would further validate the potential utility shifts caused by technological inertia.
Second, the manuscript investigates the positive impacts of digital technology on consumer travel intentions, providing both theoretical explanations and empirical validation. However, it is essential to acknowledge the dual nature of digital technology. While it facilitates greater convenience and access to information for consumers, excessive reliance on digital technologies can create issues, such as information overload and privacy concerns, which may, in turn, inhibit the travel intentions of certain consumer segments. In this regard, on one hand, the limited attention theory framework can be utilized to analyze the potential attention suppression effects caused by information overload. This could involve extracting the frequency of users' information avoidance behaviors from the behavioral logs of their device usage, or comparing the impulse purchase and regret rates of consumers to validate the impact of information overload. On the other hand, in conjunction with the Technology Acceptance Model (TAM), structural equation modeling could be employed to measure users' perceived risk and information quality, highlighting their considerations regarding privacy information collection and information management capabilities. Additionally, it is essential to further identify strategies to mitigate risks and overcome excessive dependence on digital technology, in order to provide more targeted interventions to enhance consumer digital integration and tourism intentions. This is also a critical area of our ongoing research.
Third, in the heterogeneity analysis section of the manuscript, we briefly explored the significant differences in the impact of smartphone and digital technology use on travel intentions across consumer groups with varying ages, genders, personalities, and life attitudes. However, these conclusions will need to be validated through larger sample data. Additionally, the classification of psychological traits, such as introversion and extroversion, optimism and pessimism, was relatively simplistic. Future research will require more precise classifications and measurements to offer a deeper analysis and reflection on the research conclusions presented in this manuscript.
CRediT authorship contribution statementYanan Tan: Writing – review & editing, Writing – original draft. Guoliang Jiang: Formal analysis, Data curation. Shaheem Sayed Merajuddin: Software, Formal analysis. Fang Zhao: Supervision, Funding acquisition.
This paper was approved by Jilin University Philosophy and Social Science Innovation Team Youth Project "Chinese Modernization and New Form of Human Civilization" (Project approval number: 23cxtdqn03).