


Editado por: Abbas Mardari
Más datosIndustry 5.0 has introduced a novel interpretation of sustainable supply chains (SSCs) that emphasizes the importance of building a transparent and trustworthy network that can be continuously monitored and controlled through stakeholder collaboration as well as the use of advanced, intelligent machinery. The ultimate goal of SSCs is to meet specific economic, social, and environmental standards. The implementation of blockchain technology can significantly improve the reliability, efficiency, and security of the information exchanged among stakeholders in SSCs. However, these stakeholders inevitably possess varying informational advantages and exhibit divergent perspectives regarding the adoption of blockchain technology. This paper thus aims to examine the impediments to the adoption of blockchain technology in the context of SSCs with the goal of promoting blockchain adoption. To achieve this objective, this study analyzes the barriers to blockchain adoption from the perspectives of various stakeholders in SSCs and constructs a barrier severity assessment model that utilizes group decision-making methods to integrate all stakeholders’ attitudes. This study employs the PEEST (political, economic, environmental, social, and technological) framework to identify 27 barriers to the adoption of blockchain technology. Subsequently, an expertise-based group decision-making approach is used to quantify the prominence of various barriers according to various types of stakeholders. The results indicate that the five most intense barriers are storage constraints, insufficient economic incentives, high integration costs, a lack of functional appeal, and ambiguity regarding data disclosure and public data management regulations. This research makes novel theoretical and practical contributions, as it takes an empirical and all-encompassing approach to identifying obstacles to the adoption of blockchain technology and provides valuable insights for policymakers and practitioners to reference in overcoming these obstacles.
Industry 5.0 seeks to capitalize on the cognitive abilities and creative potential of multiple stakeholders alongside the use of automated machinery to achieve mass customization (Maddikunta et al., 2022). Industry 5.0 has emerged as a novel improvement to sustainable supply chains (SSCs) by utilizing advanced technologies such as artificial intelligence and blockchain to continuously monitor and manage manufacturing processes as a complement to traditional management techniques. Developing trusted data recording, transmission and storage methods are vital to this transition as diverse stakeholders collaborate in SSCs, where blockchain technology is viewed as a potential solution to existing information asymmetry and transaction credibility problems owing to its decentralization, nontamperability, traceability, collective maintenance, openness and transparency (Crosby et al., 2016).
Blockchain is essentially a decentralized database that applies cryptographic methods to the storage and management of data blocks and thus guarantees transparency through consensus mechanisms, encryption algorithms, and distributed storage (Nakamoto, 2008). Numerous companies such as Alibaba,1 Tencent,2 Inspur3 and IBM4 have invested in blockchain technology to increase transparency in supply chains. Moreover, smart contracts enable automation through the use of consensus protocols, which improves efficiency in SSCs. However, blockchain is still in its infancy (Kouhizadeh et al., 2021). Numerous studies have explored the factors that hinder the use of blockchain in SSCs, including the energy consumption required by high-intensity computing (Azzi et al., 2019) as well as the lack of regulations and professional talent (Abeyratne & Monfared, 2016; Saberi et al., 2019). In addition, the interrelationships between the barriers to blockchain adoption have been investigated (e.g., Biswas & Gupta, 2019; Kamble et al., 2019, 2020). Existing studies offer numerous insights into the reasons underlying the limited uptake of blockchain technology in SSCs, and thus overcoming the barriers to blockchain adoption is a subject that holds major academic interest.
SSCs involve multiple stakeholders that possess varying attitudes toward the adoption of blockchain, as its use will impact them in varying ways. The transparency it offers may confer advantages upon certain stakeholders while depriving others of specific informational advantages. In this sense, the implementation of blockchain in SSCs necessitates achieving a consensus view throughout the entirety of the SSC. The identification and intensity of the barriers to the adoption of blockchain in SSCs necessitates a comprehensive analysis of the entire SSC rather than an isolated section thereof.
This study systematically identifies the use of blockchain in SSCs using the political, economic, environmental, social and technological (PEEST) framework and develops an expertise-based information aggregation model to evaluate the intensity of those barriers from the perspectives of multiple stakeholders. The proposed model also considers the professionalism of each stakeholder to mitigate the specific preferences and private interests of certain stakeholders.
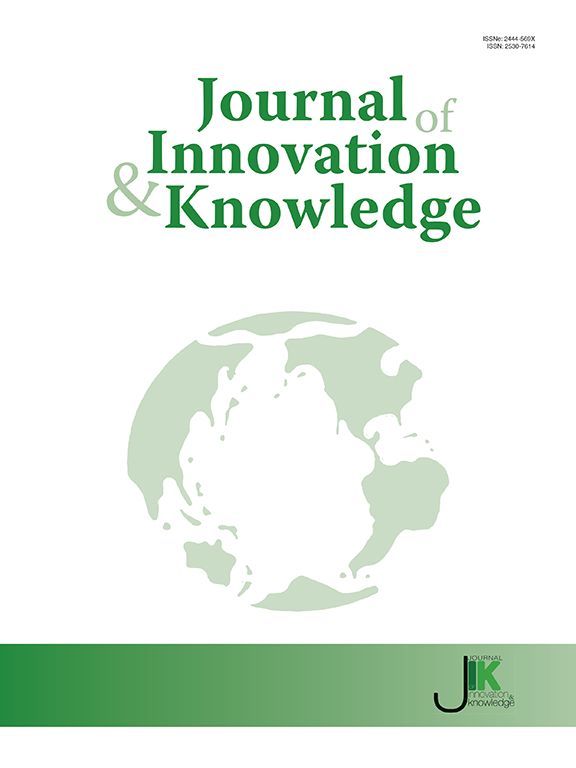
The remainder of this study is organized as follows. Section 2 reviews the related literature on blockchain technology, sustainable supply chains and group decision-making (GDM) methods. Section 3 identifies the barriers to blockchain adoption in SSCs from the perspectives of multiple stakeholders. Section 4 develops an expertise-based GDM that accounts for probabilistic preference information. Section 5 demonstrates the intensity of each barrier to blockchain adoption in SSCs. Finally, Section 6 concludes.
Literature reviewThis study aims to investigate the adoption of blockchain in SSC management using the GDM method. This section reviews two relevant streams of literature: that on the use of blockchain in SSCs as well as that on the application of GDM in evaluating problems.
Blockchain and SSCsWith the emergence of Industry 5.0, the importance of SSCs has been further highlighted. The integration of cutting-edge technologies such as artificial intelligence and the Internet of Things has allowed for the continuous monitoring and intelligent management of SSCs, as pointed out by Maddikunta et al. (2022). Moreover, the use of blockchain technology has been regarded as a powerful tool for mitigating the risks associated with agent credibility owing to its as immutability, transparency, and traceability. In light of this, a growing number of enterprises have introduced blockchain into SSCs to enhance the transparency of their sustainability practices (Kouhizadeh et al., 2021). As technological advancements and sustainability continue to merge, blockchain technology is poised to revolutionize how SSCs are managed in the future.
The current studies on blockchain and SSCs can be categorized into two distinct categories. The first is centered on the integration of blockchain technology into SSCs and focuses on the various benefits that arise from such an integration (e.g., Kouhizadeh et al., 2021; Linton et al., 2007; Nikolakis et al., 2018; Saberi et al., 2019). Blockchain technology can create a robust information traceability system that provides the relevant actors with access to critical data relating to sustainability and environmental protection (Azzi et al., 2019; Kleindorfer et al., 2005; Kshetri, 2018; Linton et al., 2007). Similarly, smart contracts can be leveraged to enhance the operational efficiency of SSCs. In international trade, inefficient business practices and geographic differences often result in the excessive use of manpower and capital. Smart contracts can authenticate commodity transactions such that trade details are posted to a blockchain ledger only upon meeting contractual obligations. As such, smart contract-based SSCs record trading data that is unmodifiable, which enhances their efficiency, security, and economic viability (Kamble et al., 2019).
The second category is devoted to evaluating the current application of blockchain in SSCs. The barriers to the adoption of blockchain in SSCs can be sorted into four categories as follows. (1) Privacy risk. The issue of privacy has been identified by several studies (e.g., Kouhizadeh et al., 2021; Liu et al., 2021; Sadhya & Sadhya, 2018; Zhao et al., 2017) and include vulnerability to a 51% attack, private key security, criminal activity, double spending, transaction privacy leakage, and hazards related to smart contracts (Li et al., 2020). (2) Lack of professional talent. The introduction of blockchain has changed the relationships among and even the hierarchical structures within enterprises. It is thus worthwhile to explore how enterprises can manage the challenges brought about by this technology (Li et al., 2020; Mangla et al., 2017) as well as how coordination among organizations in the supply chain can be improved (Kouhizadeh et al., 2021). (3) High cost of blockchain. The cost of introducing blockchain includes hardware and integration expenses (Zhao et al., 2017), system maintenance, and training (Kouhizadeh et al., 2021; Sadhya & Sadhya, 2018). (4) The lack of supervision. Blockchain is a double-edged sword. While it offers the potential to improve trust and operational efficiency by virtue of its traceability and transparency, it also poses the risk of privacy leakage. However, the regulations and standards governing data disclosure and privacy protection are still in their developmental stages (Acquisti et al., 2012; Stewart, 2017) and thus most enterprises have little confidence in blockchain-based businesses.
GDM methodsExamining the barriers to the adoption of blockchain in SSCs is a multifaceted undertaking that warrants the consideration of various stakeholders and their specialized knowledge. GDMs have demonstrated notable efficacy in addressing problems of this nature. The GDM method leverages the collective intelligence of a decision-making group that comprises multiple stakeholders with diverse backgrounds and expertise. The group is tasked with evaluating and selecting the most optimal decision and ranking alternative options (Liang et al., 2017). Multistakeholder decision-making methods have been in used practice since the ranking of group alternatives was proposed by the French mathematician Borda in 1781. The longitudinal procedure of GDM can be condensed into the following three steps: (1) collecting preference information; (2) clustering preference information; and (3) aggregating the preference information at a high-level.
The most commonly used preference representation formats can be divided into two types: deterministic preference information (i.e., representing utility values on the basis of multiple attribute utility theory (Butler et al., 2001) and numerical preference values (Shi et al., 2018)) and uncertain preference information (i.e., incomplete fuzzy linguistic preference information (Cabrerizo et al., 2010), fuzzy preference relations (Chiclana et al., 1998), and intervals in linguistic preference information 2-tuples (Chen et al., 2012)). Uncertain preference information is more adaptable and closer to reality than other types of preference information because its decision-making process is limited by multiple factors. There are three main kinds of uncertain preference information. (1) Preference ordering, defined as fuzzy binary relations that satisfy the conditions of reciprocity and max-min transitivity (Tanino, 1984). This type of information expression is commonly used to handle the fuzzy information caused by the diversity of individual opinions. Then, the preference orderings are used to capture the preference of the whole group. (2) Linguistic preference is used for vague or ambiguous information such as the measurement of linguistic preference relations (Xu, 2005) and their consistency (Dong et al., 2008). (Herrera and Herrera-Viedma, 2000) established a framework for solving the multi-criteria decision-making problems under linguistic information. And (3) probabilistic preference, defined as a probability or cumulative distribution function that can be used for uncertain information. Lu and Boutilier (2011) constructed a vote elicitation model under conditions of probabilistic preference to estimate cost trade-offs. Ji et al. (2021) proposed a bio-objective optimization model for aggregating stakeholder opinions with probabilistic preference to improve their objectivity and reliability. Chen et al. (2023b) proposed a fairness-aware large-scale collective opinion generation model, then further considered individuals’ behavioral characteristics and constructed a multiobjective optimization-driven collective opinion generation model to improve the accuracy of the results. Probabilistic preference has advantages in terms of information collection, which has been adopted in the measurement of Building information modeling (BIM)-based projects (Chen et al., 2023a,c). In this study, we adopt probabilistic preference to express stakeholders’ opinions for the following two reasons. First, in the barriers to blockchain adoption, the preference information given by stakeholders is imprecise and likely to depict a preference for uncertainty degrees. Second, probability theory lays a mathematical foundation for future research to rely upon in optimizing resource allocation in SSCs.
Preference information clustering is of great significance in enhancing the robustness and efficiency of GDM. First, the preference information clustering process reduces data dimensionality, which allows for the collation of preference information. Second, preference information clustering is an efficacious way to decompose the decision-making community into several small subgroups, which is vital in the aggregation process (which we discuss in detail in the next paragraph). Numerous clustering methods have been employed in GDM such as the classic k-means algorithm (Tang et al., 2019; Wu & Xu, 2018) and the fuzzy c-means algorithm (Palomares et al., 2014; Tang et al., 2019). Dong et al. (2018) employed the gray clustering method in reaching group consensus for noncooperative behaviors. The alternative ranking-based clustering for hesitant fuzzy preference has also been proposed (Liu et al., 2019). A nonnegligible feature of these algorithms (except for the fuzzy c-means-based algorithm) is that the grouping results depend upon the threshold (Liu et al., 2014). Specifically, a group may be divided into any number of categories, which determines the threshold. It is difficult to set accurate threshold values, and thus the partial binary tree DEA-DA cyclic classification model was developed to circumvent threshold selection (Liu et al., 2014).
The consensus reaching process (CRP) is a critical process in GMD that is used to generate aggregated preference information with a high degree of consistency among stakeholders. Many consensus-reaching approaches have been proposed. Some studies use the differences in preference information to characterize the consensus among stakeholders. A novel consensus measurement based on the Pearson correlation coefficient has been constructed to evaluate the degree of concordance among stakeholders’ preferences for pairs of alternatives (González-Arteaga et al., 2016). A distance-based consensus measurement and a minimum distance aggregation model was proposed for multiple attribute GDM with hesitant fuzzy linguistic term sets. The model aims to protect the initial preference of stakeholders to the degree possible during the CRP by minimizing the maximum of the distance between each stakeholder's individual opinion and the collective opinion (Zhang et al., 2018). Other studies have designed consensus-reaching mechanisms based on the behavior of and interaction between stakeholders. A social network trust–consensus approach was proposed to illustrate the trust relationships between stakeholders (Wu & Chiclana, 2014). A visual interaction consensus model was constructed to proceed with the aggregation in accordance with stakeholders’ degree of trust (Wu et al., 2017). A self-management mechanism in CRP was designed to dynamically generate stakeholder weights in managing noncooperative behaviors (Dong et al., 2016). The above studies provide a wealth of consensus-reaching methods, but ignore the impact of stakeholder heterogeneity on information aggregation.
Research gap and contributionExisting studies not only provide a comprehensive view of the use of blockchain in SSCs but also identify several barriers that hinder it. The impact of these barriers varies, and evaluating their impact is essential for barrier removal under limited resources. This study fills this research gap in the following two ways. First, this study uses the PEEST framework to analyze the barriers to blockchain adoption from five dimensions: policy, economy, environment, society, and technology. This effort not only classifies the existing barriers but identifies new barriers. Second, this study evaluates the intensity of these barriers from a multistakeholder perspective.
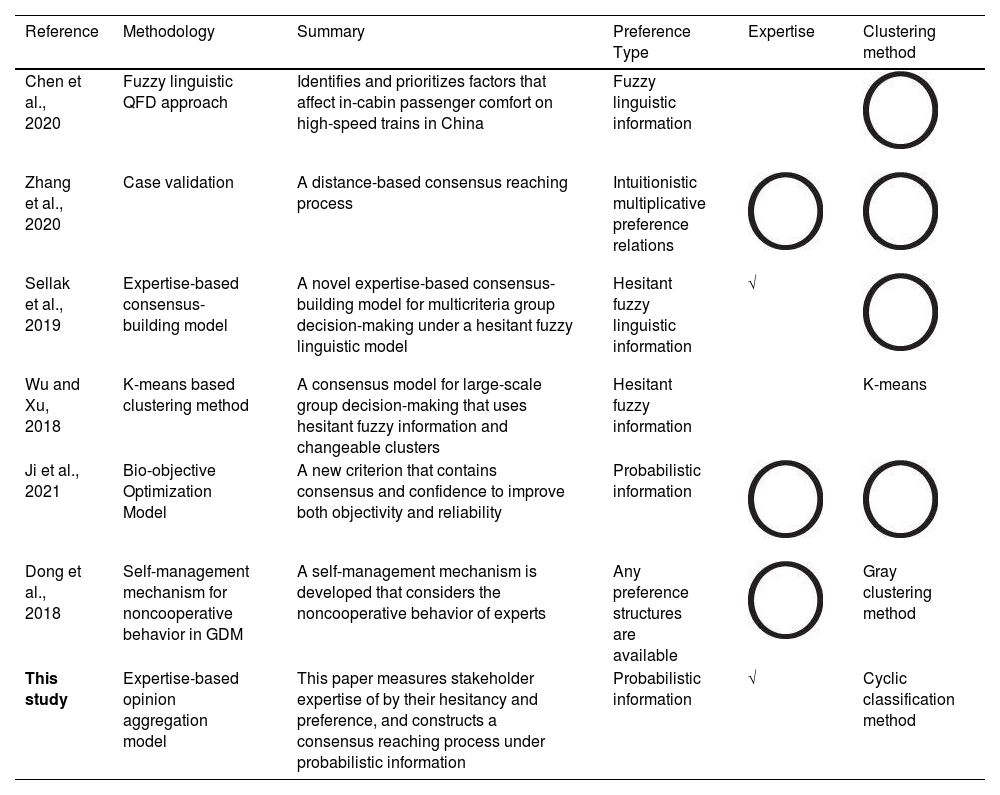
The use of blockchain in SSCs requires support from multiple stakeholders. Therefore, it is essential to integrate the opinions of multiple stakeholders in evaluating the barriers to the use of blockchain in SSCs. GDM is an effective method for fusing information and has great potential to generate aggregated evaluations. To clearly illustrate the contributions of this study to GDM, Table 1 compares the current GDM-related literature with this study.
Studies on GDM and this study
| Reference | Methodology | Summary | Preference Type | Expertise | Clustering method |
|---|---|---|---|---|---|
| Chen et al., 2020 | Fuzzy linguistic QFD approach | Identifies and prioritizes factors that affect in-cabin passenger comfort on high-speed trains in China | Fuzzy linguistic information | ||
| Zhang et al., 2020 | Case validation | A distance-based consensus reaching process | Intuitionistic multiplicative preference relations | ||
| Sellak et al., 2019 | Expertise-based consensus-building model | A novel expertise-based consensus-building model for multicriteria group decision-making under a hesitant fuzzy linguistic model | Hesitant fuzzy linguistic information | √ | |
| Wu and Xu, 2018 | K-means based clustering method | A consensus model for large-scale group decision-making that uses hesitant fuzzy information and changeable clusters | Hesitant fuzzy information | K-means | |
| Ji et al., 2021 | Bio-objective Optimization Model | A new criterion that contains consensus and confidence to improve both objectivity and reliability | Probabilistic information | ||
| Dong et al., 2018 | Self-management mechanism for noncooperative behavior in GDM | A self-management mechanism is developed that considers the noncooperative behavior of experts | Any preference structures are available | Gray clustering method | |
| This study | Expertise-based opinion aggregation model | This paper measures stakeholder expertise of by their hesitancy and preference, and constructs a consensus reaching process under probabilistic information | Probabilistic information | √ | Cyclic classification method |

Table 1 reveals the identification of three additional research gaps. The extant GDM literature primarily attains consensus through linguistic preference or fuzzy information, and insufficient emphasis is placed on the development of consensus achievement strategies that are rooted in probabilistic preferences. The existing GDMs thus fail to incorporate the influence of stakeholder characteristics on decision outcomes, which weakens their robustness. Current clustering methods require that clustering thresholds be predetermined, which usually requires a significant number of experimental trials, thereby resulting in the consumption of substantial computational resources. To fill these three research gaps, this study describes stakeholders according to their hesitancy and preference and constructs an expertise-based weight allocation to facilitate the amalgamation of diverse viewpoints. Moreover, a novel cyclic classification method with probabilistic preference is developed to solve the threshold selection problem in the clustering process.
The findings of this study can serve as a practical reference for stakeholders in SSCs and policymakers, thus enabling them to optimize their resource allocation. This study serves as a precursor to investigating how expertise and design consensus can be reached in the context of probabilistic preference and introduces an alternative viewpoint on designing probabilistic preference-based GDM models. Fig. 1 provides an overview of the technical model discussed herein.
Barriers to blockchain adoption in SSCs
The PEST analysis model is a commonly utilized framework that encompasses four key domains, namely, political, economic, social, and technological factors, and is frequently employed to evaluate the internal and external factors that affect organizations in the face of novel challenges. Environmental sustainability is a crucial component of SSCs. As such, an environmental perspective should be taken into account when examining the barriers to the adoption of blockchain technology. However, it is noteworthy that this perspective is not currently considered in the PEST framework. In this section, we propose the PEEST framework as an extension of PEST to analyze blockchain adoption in SSCs, which is well-suited for identifying obstacles that may affect adoption of blockchain technology. This study then employs a systematic approach to identify and categorize the barriers to blockchain adoption in SSCs through a comprehensive review of the relevant literature.
Political barriersOfficial policies not only affect stakeholders’ enthusiasm for blockchain adoption but also are responsible for its ongoing management and maintenance. Numerous empirical studies show that government supervision and policy incentives are an important driving force of SSCs (e.g., Govindan et al., 2014; Kouhizadeh et al., 2021; Luthra et al., 2016; Martin & Murphy, 2017; Milberg et al., 2000; Saberi et al., 2019; Sayogo et al., 2015). The first barrier in the political context is that there are few incentives to adopt blockchain (Pol_1). Second, multiple studies have presented that there is no official evaluation standard for enterprises’ sustainability (Pol_2) (e.g., Govindan et al., 2014; Kouhizadeh et al., 2021; Luthra et al., 2016; Saberi et al., 2019). Therefore, it is difficult to measure the positive effect of blockchain on sustainability, which makes senior executives skeptical of its value (Govindan et al., 2014). Third, there are no reliable references for blockchain adoption in SSCs (Pol_3). This uncertainty and unpredictability discourages stakeholders from taking action. Fourth, there is little government supervision of blockchain adoption in SSCs (Pol_4). Governments can address the governance and ethical considerations associated with blockchain adoption by establishing frameworks for data protection, privacy, cybersecurity, and the responsible use of blockchain technology. Moreover, governments can establish ethical guidelines and frameworks to ensure that blockchain adoption aligns with societal values and safeguards the rights of both individuals and organizations. Stakeholders are worried about the absence of effective government oversight (Kouhizadeh et al., 2021; Saberi et al., 2019; Sadhya & Sadhya, 2018). The fifth political barrier to blockchain adoption in SSCs is the lack of regulations or laws that concern data sharing (Pol_5) (Acquisti et al., 2012; Stewart, 2017). Blockchain may bring about privacy risks that may in turn affect corporate profits (Acquisti et al., 2012; Stewart, 2017). Moreover, possible conflicts between data owners and users may arise in the absence of government supervision (Sayogo et al., 2015).
Economic barriersBlockchain improves the quality and credibility of SSCs. Many enterprises in SSCs have started investing in blockchain. Maersk utilizes blockchain in its international logistics to track containers, instantly check the status of cargoes, and avoid transportation fraud. Alibaba collaborated with AusPost, Blackmores, and PwC to use blockchain to combat food fraud (Kshetri, 2018). However, the cost of introducing blockchain is a significant economic burden for many enterprises that includes the following considerations. (1) High installation costs(Eco_6). Enterprises need to develop software such as information encryption and tracking technology (Sadhya & Sadhya, 2018) and buy additional hardware to construct blockchain-based operating systems (Sayogo et al., 2015). (2) High maintenance and administrative costs(Eco_7). The adoption of blockchain in SSCs is in its infancy, and there is a dearth of professionals with the appropriate technical skills, thus raising their labor (Kouhizadeh et al., 2021; Saberi et al., 2019; Sadhya & Sadhya, 2018). (3) High production and delivery costs(Eco_8). Blockchain technology can be used to bring transparency to the entire supply chain. Therefore, it is imperative for companies to improve their sustainability performance throughout the entire supply chain (Kleindorfer et al., 2005; Linton et al., 2007). (4) High training costs(Eco_9). The implementation of blockchain technology has resulted in significant advancements in various aspects of organizational culture, processes, infrastructure, and other areas, but it has necessitated employee training programs, thereby incurring substantial financial costs (Kouhizadeh et al., 2021; Saberi et al., 2019). (5) High integration costs(Eco_10). In general, existing systems are incompatible with blockchain technology. It is imperative that blockchain-centric solutions be compatible with existing legacy systems, which incurs substantial integration expenses (Kaur et al., 2018; Kouhizadeh et al., 2021; Saberi et al., 2019) (6) High information sharing costs(Eco_11). Stakeholders in blockchain-based SSCs must disclose transaction information to maintain their credibility. For example, companies need retain relevant documents to support third-party certification (Sayogo et al., 2015) given the added risk of information leaks.
Environmental barriersEnvironmental barriersBlockchain requires significant energy consumption to support an enormous number of transactions (Ecology_12). The high number of linkages in SSCs have caused the number of transactions to surge. The energy consumption of blockchain-based systems will increase exponentially with the growth of SSCs, which comes at a high environmental cost. Environmental protection laws require enterprises to take steps to protect the environment. Accordingly, businesses are apprehensive that the high energy consumption of blockchain poses serious legal and social risks.
Organizational barriersThe organizational barriers to the use of blockchain in SSCs can be divided into intra- and inter-organizational barriers.
Intra-organizational barriers. (1) Blockchain may change organizational cultures and practices, which may be met with resistance from members of the organization (Org_intra_13) (Kouhizadeh et al., 2021; Sayogo et al., 2015). When blockchain is introduced as an innovative technology, it will attack existing procedures, delivery mechanisms, and personnel. For example, financial personnel need to become familiar with the operating procedures of blockchain-based systems such as smart contracts. (2) The lack of support from corporate executives greatly hinders blockchain adoption in SSCs (Org_intra_14) (Kouhizadeh et al., 2021; Mangla et al., 2017; Sayogo et al., 2015). Corporate executives make investment decisions that directly affect blockchain adoption in SSCs. (3) The tolerance of new technologies has a significant impact on blockchain usage in enterprises (Org_intra_15).
Inter-organizational barriers. The coordination of all stakeholders is critical for blockchain adoption in SSCs. (1) Different stakeholder cultures make it difficult for them to coordinate blockchain adoption (Org_inter_16). (2) The lack of professional talent also restricts blockchain adoption in SSCs (Org_inter_17). (3) Stakeholders in SSCs hold different opinions on blockchain adoption due to the following two points (Org_inter_18). First, stakeholders in SSCs have diverse goals and sustainability practices. Second, the impact of the information transparency brought about by blockchain varies by stakeholder.
Social barriersThis section elaborates the social barriers to blockchain adoption in SSCs from the three aspects of consumer values, businesses values, and blockchain's social reputation.
(1) Consumers’ enthusiasm for green products varies, which implies that the profits associated with blockchain usage are uncertain. Blockchain technology can improve the sustainability and thus the credibility of enterprises which expands the markets for green products served by SSCs. The products and services provided by blockchain-based SSCs are accompanied by higher prices that are borne by customers (Tseng et al., 2013). Customers will make trade-offs between greenness, product reliability, and high prices, which increases uncertainty in blockchain-based SSCs (Soc_19). (2) Transparency enhances transaction credibility, which in turn enhances enterprises’ reputation. However, blockchain also increases the possibility of data leakage (Milberg et al., 2000; Sayogo et al., 2015). Many companies argue that the costs of data leakage are greater than the reputational benefits afforded by blockchain (Soc_20). (3) The negative impact brought about by “the Bitcoin scandal” such as OneCoin event has limited the use of blockchain in SSCs (Soc_21).
Technological barriersThe lack of technical standards and mainstream applications for blockchain indicates that it is still in its inception. The technological barriers to blockchain adoption in SSCs include: (1) data security (Tech_22); (2) handleability (Tech_23), (3) storage capacity (Tech_24), (4) scalability (Tech_25), (5) permission (Tech_26), and (6) data immutability (Tech_27).
Data security There are two main data threats associated with the use of blockchain. (1) A 51% Attack. Blockchain follows the POW consensus mechanism based on hashing power. When the hashing power of a miner exceeds half of the total, or the miner owns more than half of the Bitcoin in the entire blockchain, the miner can employ its computing capacity to modify the ledger, affect other miners, and further control the entire consensus network (Abeyratne & Monfared, 2016; Li et al., 2020; Sayogo et al., 2015). (2) Private key security. A user's private key is the digital identity used for verification, which is generated and managed by the user. Hackers can utilize loopholes to illegitimately access private accounts and tamper with confidential information. Moreover, this criminal behavior is difficult to track, and the modified information cannot be recovered.
HandleabilityBlockchain realizes the self-verification, transmission, and management of nodes through distributed accounting and storage. Also, blockchain excludes third-party institutions from point-to-point electronic transactions, which improves the credibility and efficiency of transacting (Nakamoto, 2008). Private and public keys are used to ensure the security of users’ information. Nevertheless, blockchain-based trading is complicated and fallible. Also, errors are irreversible due to the immutability of the ledger. Therefore, for most operators without expertise in blockchain, the blockchain's ease of use is relatively low.
Limited storage capacityThe blockchain records the log data of each transaction. Numerous participants bring an enormous number of tasks to be performed, which in turn creates great storage requirements (Kamble et al., 2020; Sadhya & Sadhya, 2018; Tseng et al., 2013).
ScalabilityEach block in the blockchain carries the complete record of transactions, and each new transaction will be accompanied by a block that is newly added to the ledger. As transactions increase, the amount of data rises exponentially, which slows the network's response speed (Kouhizadeh et al., 2021; Sadhya & Sadhya, 2018; Yaga et al., 2018). Additionally, the high number of participants in SSCs require a formative technical architecture to support their massive throughput.
PermissionBlockchain systems are divided into two types: public and private systems. The public blockchain is a completely centralized system with higher openness in which all users can enter and exit the system voluntarily. Private blockchains apply access control mechanisms to limit access (Dinh et al., 2018). We thus pose the following questions: What are the benefits and challenges that public and private blockchain systems bring to SSCs? What factors need to be considered in choosing the system type? Is the decision of a blockchain system affected by the supply chain type? And if so, what is the mechanism? (Henry et al., 2018; S. Kamble et al., 2019). These questions have yet to be addressed by either scholars or practitioners, and thus we seek to do so in this study.
Data immutabilityData immutability ensures data authenticity and improves the reliability of SSCs. However, it is problematic that data that have negative effects cannot be modified (Biswas & Gupta, 2019; Kouhizadeh et al., 2021; Saberi et al., 2019). For instance, bad supply behavior will remain on the ledger, even if it is discovered that it was caused by a natural disaster rather than supplier negligence.
Expertise-based GDM for ordering the barriers to blockchain adoption in SSCsThe introduction of blockchain in SSCs requires the coordination of multiple stakeholders. Therefore, it is necessary to integrate multiple views in evaluating the intensity of the barriers to blockchain adoption. GDMs can be used to form a group opinion with a high consensus level. Therefore, GDMs are suitable for assessing the intensity of the barriers to blockchain adoption. However, it should be noted that stakeholders are affected differently by blockchain technology. As a result, they may have divergent attitudes toward its use. Additionally, stakeholders possess varying professional expertise, knowledge, backgrounds, skills, personalities, and experiences, which contributes to their ability to assess the adoption of blockchain. These factors have a significant influence on the final outcome of this evaluation process (Cheng et al., 2018). To address this issue, an expertise-based GDM approach is proposed that aims to mitigate the impact of stakeholder attributes on the assessment of blockchain adoption.
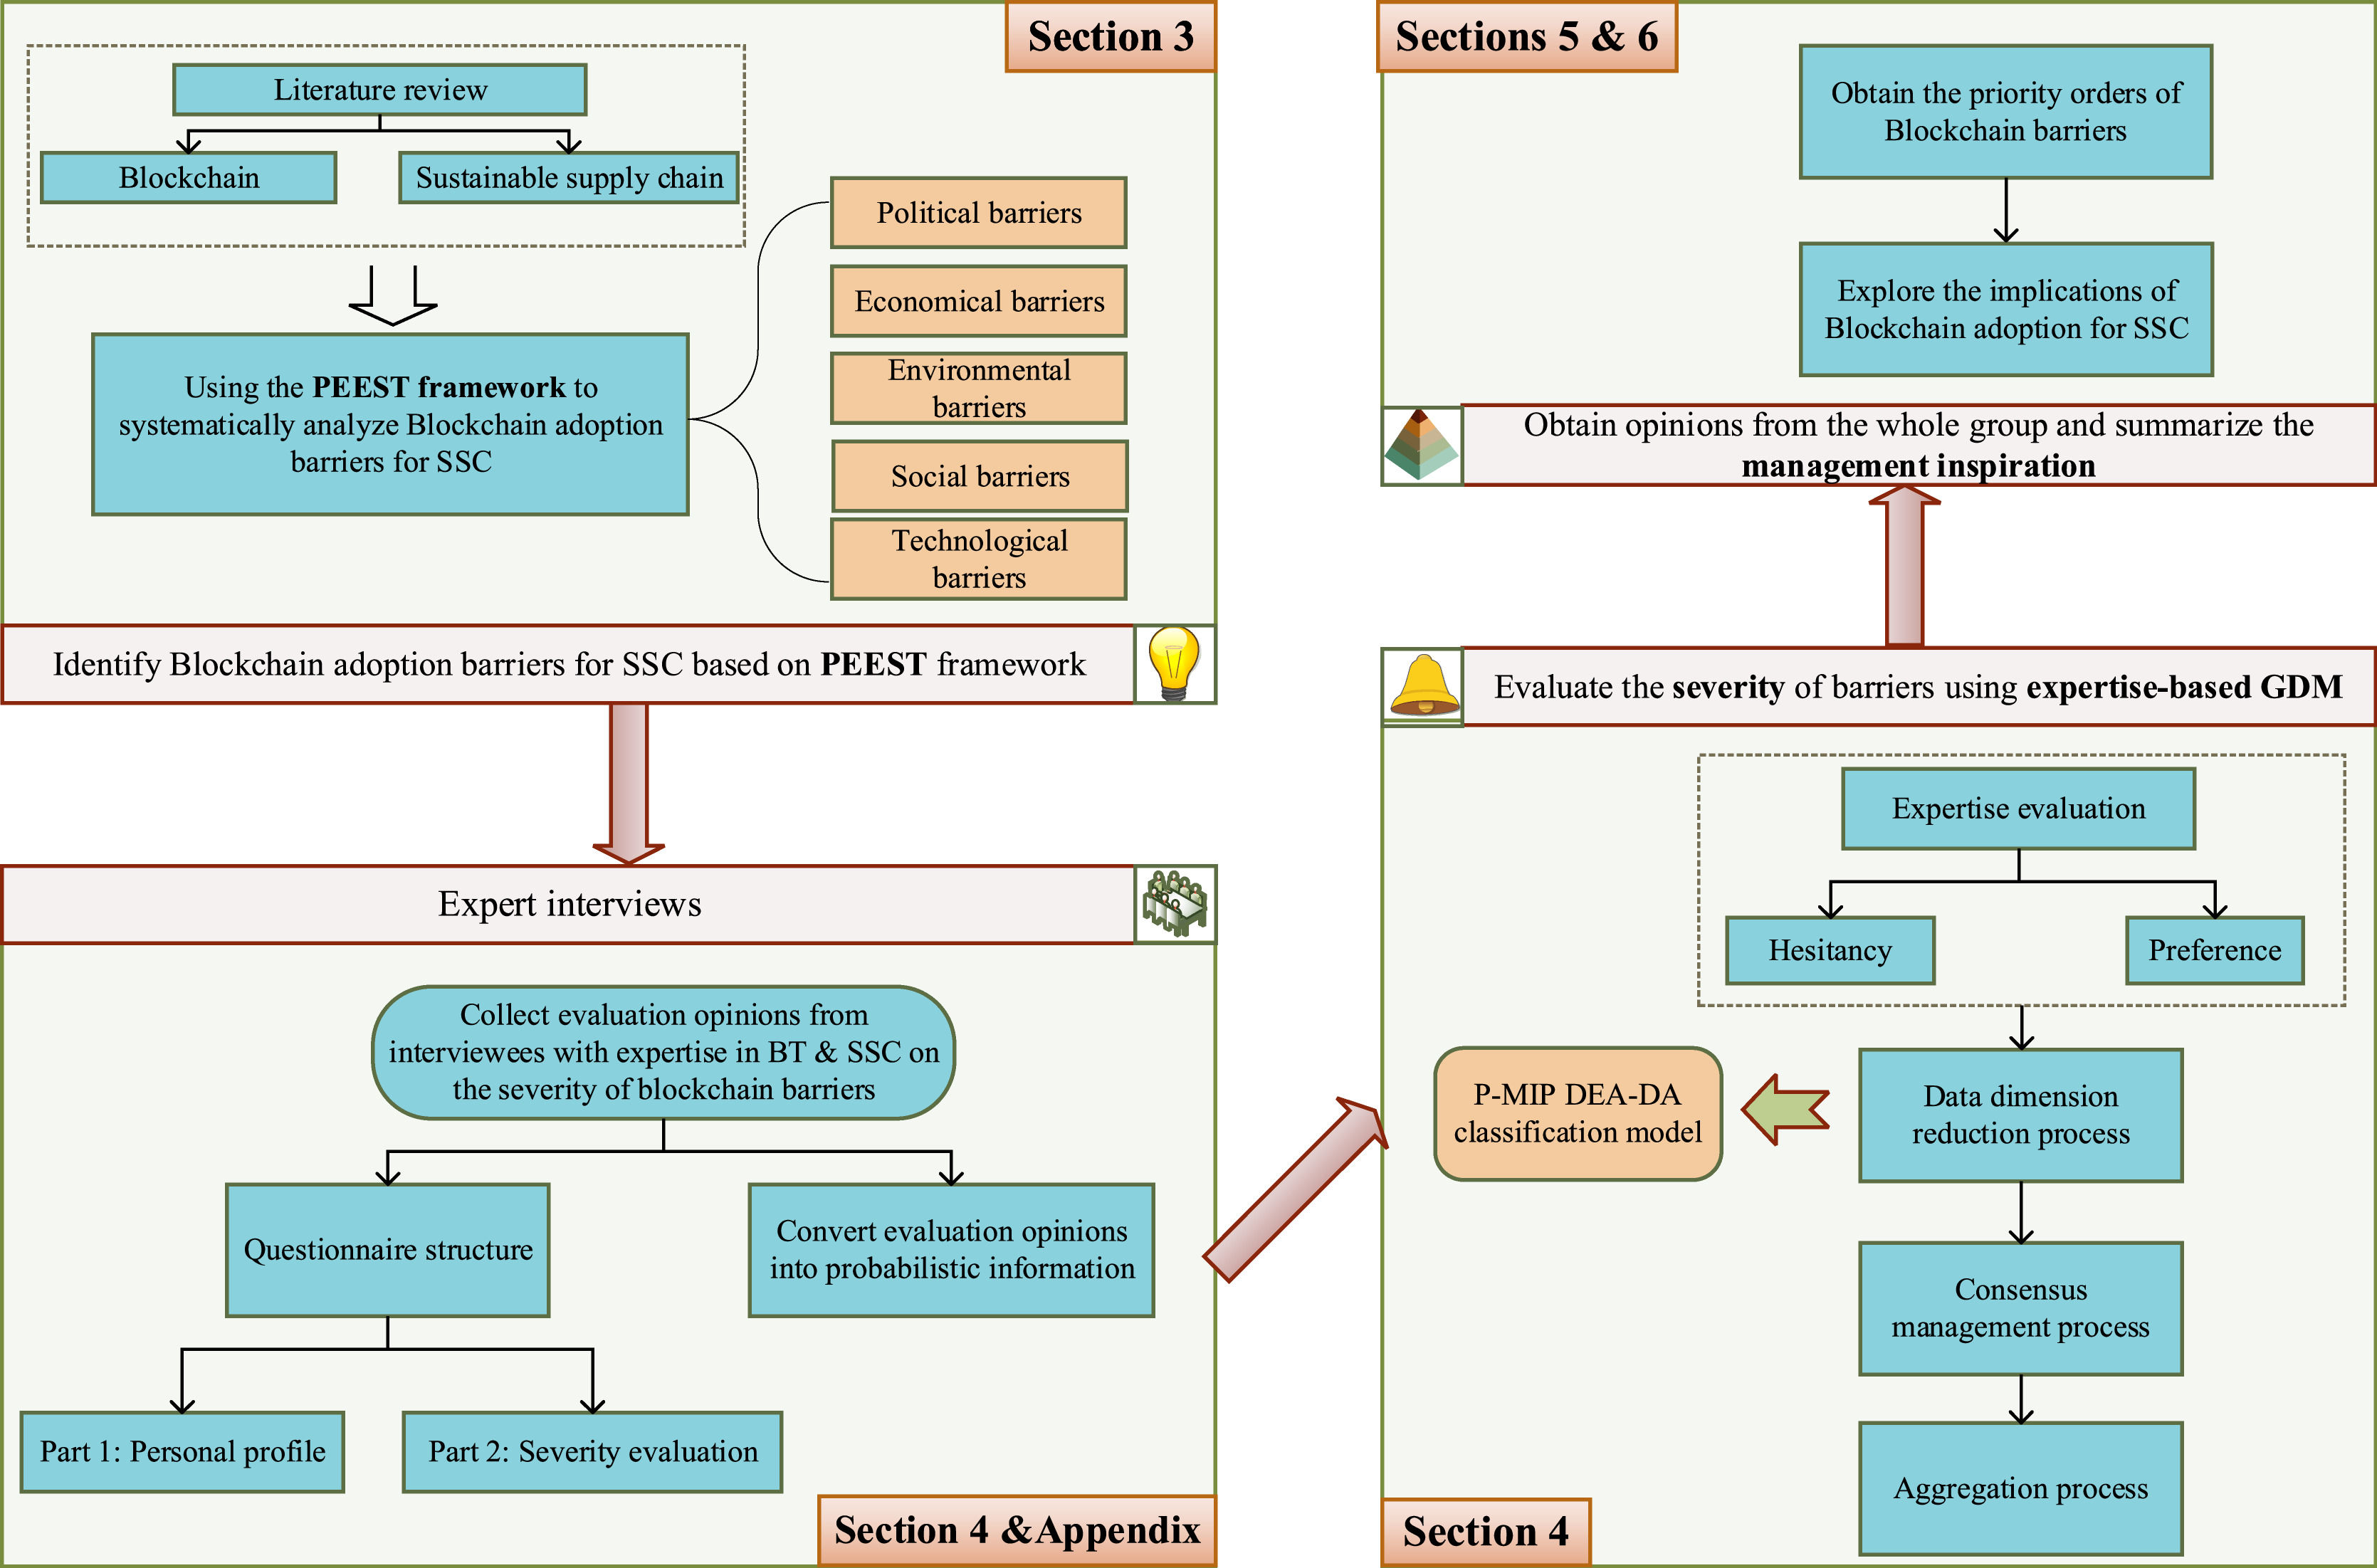
By incorporating expertise-based criteria, the proposed method seeks to ensure a fair and balanced evaluation process that involves five steps: (1) collecting decision information; (2) determining stakeholder weights; (3) clustering based on the cyclic classification model; (4) performing the consensus management and polymerization process; and (5) obtaining expertise-based feedback and the aggregated opinions. Fig. 2 shows a roadmap of the expertise-based GDM.

Compared with previous GDMs, the advantages of the expertise-based GDM can be summarized as follows: (a) this work is the first attempt to measure the expertise of stakeholders using probabilities and an expertise-based weighting method, which greatly enhances the robustness of the results; (b) this study extends the partial binary tree DEA-DA cyclic classification model to probabilistic information, thus eliminating the model's dependence on the threshold; (c) this study proposes a novel consensus achievement model that uses probabilistic information, which enriches the existing GDM methods.
Expertise-based weight allocation methodThe expertise-based weight allocation method is utilized to rank stakeholders based on their professional expertise. This approach aims to mitigate potential errors resulting from stakeholder attributes in the evaluation process. By assigning weights based on expertise, this method ensures that the results are not driven by individual characteristics but instead by the collective knowledge of multiple stakeholders. This helps to enhance the accuracy and reliability of the results.
The expertise of a decision-maker can be defined as her/his ability to distinguish similar but not identical situations and to apply her/his judgment coherently (Sellak et al., 2019). It is essential to assign diverse weights to decision-makers in accordance with their expertise. The existing weighting methods can be classified into two categories: (i) direct weighting methods, which are distributed by the moderators (Leyva-López & Fernández-González, 2003; Pérez et al., 2014) or through peer inspections, and (ii) indirect weighting methods, which assign weights in accordance with endogenous characteristics such as consistency (Alonso et al., 2010; Liang et al., 2017), social connections (Liang et al., 2017), or trust (Wu et al., 2015; Wu et al., 2017; Wu & Chiclana, 2014). The weights allocated through the direct methods are affected by the familiarity among moderators and decision-makers. The higher the familiarity, the more reliable the results will be. Nonetheless, due to the complexity of familiarity control (Dong & Cooper, 2016), the direct methods are not always accurate when the group is large or the criteria are multidimensional. Furthermore, the indirect methods are only applicable to specific scenarios, which limits their usage.
This study proposes an expertise-based approach to overcome these challenges. Effectively measuring the expertise of a decision-maker is at the core of the expertise-based weighting approach. This study exploits hesitancy and preference to delineate stakeholders’ ability to evaluate the intensity of the barriers to blockchain adoption in SSCs.
PreliminariesSuppose there are m stakeholders engaged in the decision-making process and their assessments over a certain event are extracted as probability distributions. Let x denote the decision variable and D={d1,d2,⋯,dm}denote the set of stakeholders. The opinion of stakeholder i on decision space X can be formulated as the probabilistic distribution function (PDF) fi(x),(1,2,⋯,m):
where ϕ is a mapping function Rm→R+, which is used to fuse individual PDFs into group PDFs. f(x) is the opinion of the group, which should satisfy the unity condition ∫−∞+∞f(x)d(x)=1.Weight formulation
The presence of diverse stakeholders with varying levels of knowledge, social connections, professional backgrounds, and other factors contributes to a wide range of perspectives within the group. The assignment of weights to stakeholders based on their varying levels of expertise is therefore a crucial aspect of this study. Let λi(i=1,2,⋯,m),λi∈[0,1] denote the weight vector. The weight of stakeholder di can be formulated as follows:
where giy∈[0,1] denotes the performance of stakeholder di under featureyth,vy∈[0,1] represents the weight of featureyand ∑y=1zvy=1.
The proposed expertise-based weighting approach incorporates two distinct features—specifically, thatz=2 and the feature set is G={g1,g2}. These two features represent hesitancy and preference, respectively.
HesitancyHesitancy reflects stakeholders’ confidence. If stakeholder di∈D expresses a preference over alternatives with more certainty, the PDF will have a smaller variance/standard deviation, which implies that his/her expertise is higher. On the contrary, when the PDF of stakeholder di has a greater variance/standard deviation, his/her hesitancy is higher, which indicates lower expertise.
This study uses the coefficient on variation to measure hesitancy. Variance/standard deviation is not used to measure hesitancy because it depends on the average value of the variable, which causes it to lose its significance when the dimensions and means of multiple random variables are distinct. The measurement of hesitancy in this study is as follows.
Assume there are n alternatives. Let A={a1,a2,⋯,an} be the alternative set, D={d1,d2,⋯,dm}be the stakeholder set, and PDF fij(i=1,2,⋯,m;j=1,2,⋯,n) denote the preference distribution of stakeholder di on alternative aj. The hesitancy of stakeholder di for alternative aj is:

The overall hesitancy of stakeholder di is:
where Hij∈[0,1],Hi∈[0,1],∀i∈{1,2,⋯,m},j∈{1,2,⋯,n}. It is evident that there exists a positive correlation between the level of hesitancy and the standard deviation. A heightened degree of hesitancy and a lower level of expertise can be inferred from the increased degree of fluctuation.Preference
Preference is the second feature of expertise, which describes stakeholders’ ability to evaluate all alternatives. The more clearly stakeholder di can appraise the best (worst) option, the higher his/her preference score will be, which indicates that he/she has a high level of expertise.
The Kolmogorov–Smirnov test is a classic statistical method used to test whether two empirical distributions are divergent or whether one empirical distribution is identical to another paragon distribution. This study applies the Kolmogorov distance to examine the difference between the preference distributions of stakeholder di over alternatives aj,ak. The result will be used to formulate preference score, which is given as follows. The Kolmogorov distance between alternatives aj and ak is:

The preference score of stakeholder di is:
where Pi(j,k),Pi∈[0,1],∀i∈{1,2,⋯,m},i,j,k,n∈N+. The higher the Kolmogorov distance among preference distributions, the greater the preference level is, which implies that the stakeholder can differentiate the alternatives more clearly and is thus more professional. The weight of stakeholder di is:where vy∈[0,1] indicates the weight of characteristics giy. The weight of each stakeholder is defined as:The cyclic classification method for probabilistic preference


The classification process is of great importance for reducing data dimensionality in GDM. This section introduces a novel cyclic classification method for probabilistic preference. The novel classification method holds two advantages: (1) it can solve the challenges in threshold selection, and (2) it is based on preclassification. The preclassification accounts for the background of each stakeholder, which can significantly improve the efficiency of the classification process and the validity of the results.
Mixed integer programming data envelopment analysis discriminant analysis (MIP-DEA-DA) is a nonparametric discriminant analysis method that compares the estimated discriminant score of the sample with the evaluation score obtained by the discriminant function to classify the new sample and minimize the total number of misclassifications using mixed integer programming. We utilize MIP-DEA-DA to improve the threshold selection of traditional classification algorithms (González-Arteaga et al., 2016). However, MIP-DEA-DA cannot be directly employed to classify information in this paper for two reasons. First, MIP-DEA-DA can only divide the sample observations into two groups and thus cannot be used for multigroup classification. Second, potential calculation errors in any algorithm make the results unstable. The partial binary tree DEA-DA cyclic classification model proposed by Liu et al. (2014) converts an h-type classification problem into an h−1 binary classification problem through the use of a partial binary tree, and then repeats the MIP-DEA-DA method for grouping. This method not only improves the robustness of the classification results, but also achieves multigroup classification. This study further extends the work of Liu et al. (2014) to probabilistic information environments and proposes the probability-based MIP-DEA-DA cyclic classification method.
For convenience, two critical concepts are put forward for preference aggregation and consensus level (CL). Preference aggregation represents the opinions of all stakeholders in a group. CL describes the similarity between samples. The higher the CL, the reliable the grouping results are. Therefore, CL is often used to categorize samples with high similarity and thus improve the CL by adjusting the grouping of individuals.
Preference aggregationSuppose that the weighting vector of stakeholders is λ=λi(i=1,2,⋯,m),fij(x) denotes the PDF of stakeholder di in space X and fij(x)−1 is the inverse of function fij(x). fQAj is the aggregated PDF for the alternative aj of one group. fQAj is a QA function formulated as follows (Ji et al., 2021):

Then, the aggregated opinion is expressed as follows.
fQA={fQA1,fQA2,⋯,fQAn},(fQAj∈[0,1]), where fQA represents the aggregated preference set of all alternatives for the particular decision problem.
CLCL is used to measure the cohesiveness between stakeholders in a group. We use the Pearson correlation coefficient to describe the CL of a group.
Given two PDF sets fp={fp1,fp2,⋯,fpn} and fq={fq1,fq2,⋯,fqn}, which respectively represent the opinions of stakeholders dp and dq on n alternatives, then the Pearson correlation coefficient on the two n-dimensional vectors p=(cp1,cp2,⋯,cpn) and q=(cq1,cq2,⋯,cqn) is computed as follows:
where cpj and cqj respectively represent the opinions of stakeholders dp and dq. For the sake of simplicity, we use mean of PDF to approximate the aggregated stakeholder opinion. cpj‾ and cqj‾ are calculated as follows:

The typical properties of the Pearson correlation coefficient include (González-Arteaga et al., 2016):
- (a)
Haphazardness: cor(p,q)=cor(p,q),∀p,q∈Rn,
- (b)
Range: cor(p,q)∈[−1,1],∀p,q∈Rn,
- (c)
Self-Robustness: cor(p,p)=1,∀p∈Rn,
- (d)
Linearity: if cor(p,q)=1, then there is a perfect positive linear correlation between p and q—that is, ∃a∈R,b∈R+:q=a⋅1+b⋅p, where 1=(1,1,⋯,1) is a vector of n ones. Inversely,cor(p,q)=−1 indicates a perfect negative correlation between p and q (i.e., ∃a∈R,b∈R−:q=a⋅1+b⋅p), and
- (e)
Linear Stability: given that p′=a⋅1+b⋅q and q′=c⋅1+d⋅q,a,b,c,d∈R,b and d are nonzero and have the same sign (i.e., both are positive or negative). Then, cor(p′,q′)=cor(p,q).
From the perspective of social choice theory, the CL falls within [0,1], where 0 portrays a complete lack of consistency among members and 1 presents unanimous agreement (Alcantud et al., 2013; González-Arteaga et al., 2016). To convert the threshold of the Pearson correlation coefficient from [−1,1] to [0,1], the mapping function for CL is proposed as follows:
where cor(p,q)∈[−1,1],CL(p,q)∈[0,1]. CL still satisfies the above properties of the Pearson correlation coefficient.
- (a)
Haphazardness: CL(p,q)=CL(q,p),∀p,q∈Rn.
- (b)
Self-Robustness: CL(p,p)=1,∀p∈Rn.
- (c)
Linear Stability: given that p′=a⋅1+b⋅q and q′=c⋅1+d⋅q, also that a,b,c,d∈R,b and d are nonzero and have the same sign (i.e., both are positive or negative). Then, CL(p′,q′)=CL(p,q).
Proposition 1 Givenp,q∈Rn,CL(p,q)=1(resp.CL(p,q)=0), then∃a∈R,b∈R+(resp.b∈R−):q=a⋅1+b⋅p.
Proof. Known CL(p,q)=1, using Eq. (12) we can obtain that cor(p,q)=1, according to Property (d) of the Pearson correlation coefficient, where ∃a∈R,b∈R:q=a⋅1+b⋅p being 1=(1,1,⋯,1) is a vector of ones with appropriate dimensionality. The proof for the case CL(p,q)=0 is also acquired.
Proposition 2 Givenp,q∈Rn,CL(p,q)=1, then∀o∈Rn, thatCL(o,p)=CL(q,o).
Proof. Given CL(p,q)=1, employing Proposition 1, ∃a∈R,b∈R+:q=a⋅1+b⋅p. Given ∀o∈Rn,∃c,e∈R,d,f∈R+:p=c⋅1+d⋅o,q=e⋅1+f⋅o. Using Property (e) of the Pearson correlation coefficient, we can obtain cor(p,o)=cor(q,o), which, according the definition of CL, is equal to CL(p,o)=CL(q,o).
The above propositions provide the conditions for the measurement of the consistency in a decision-making group. Then, we introduced a probability-based MIP DEA-DA cyclic classification (P-MIP DEA-DA) model.
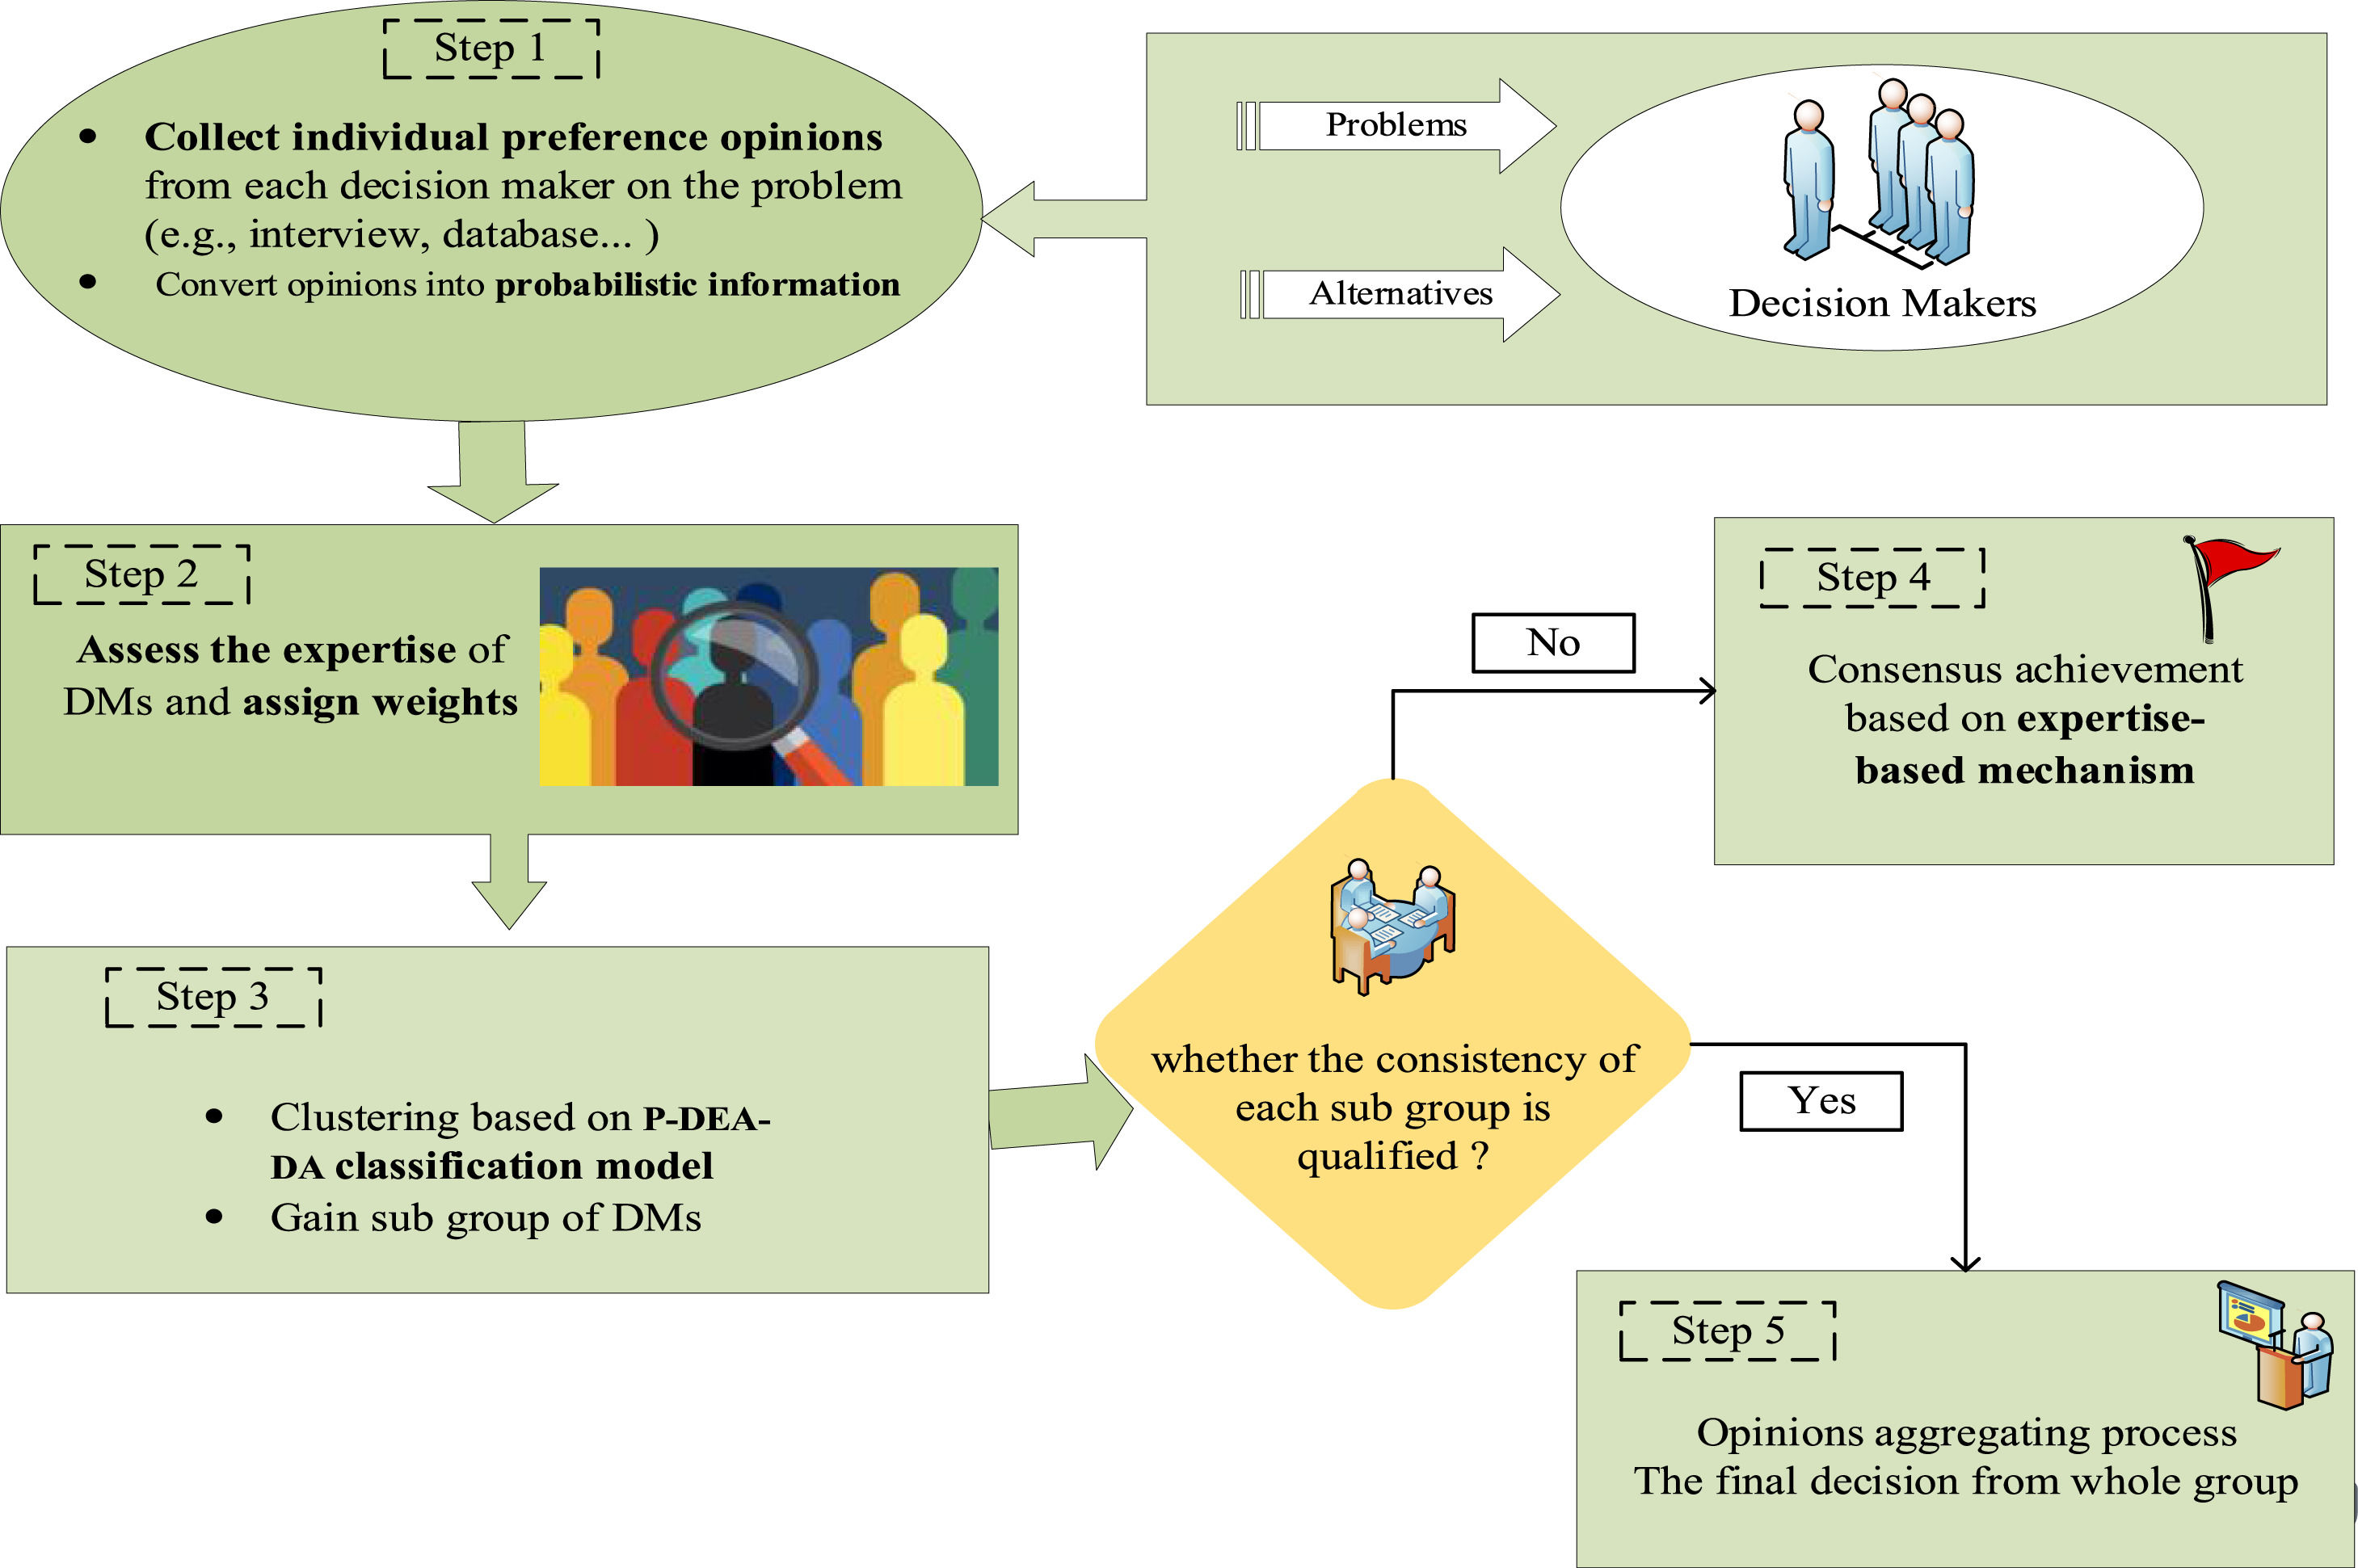
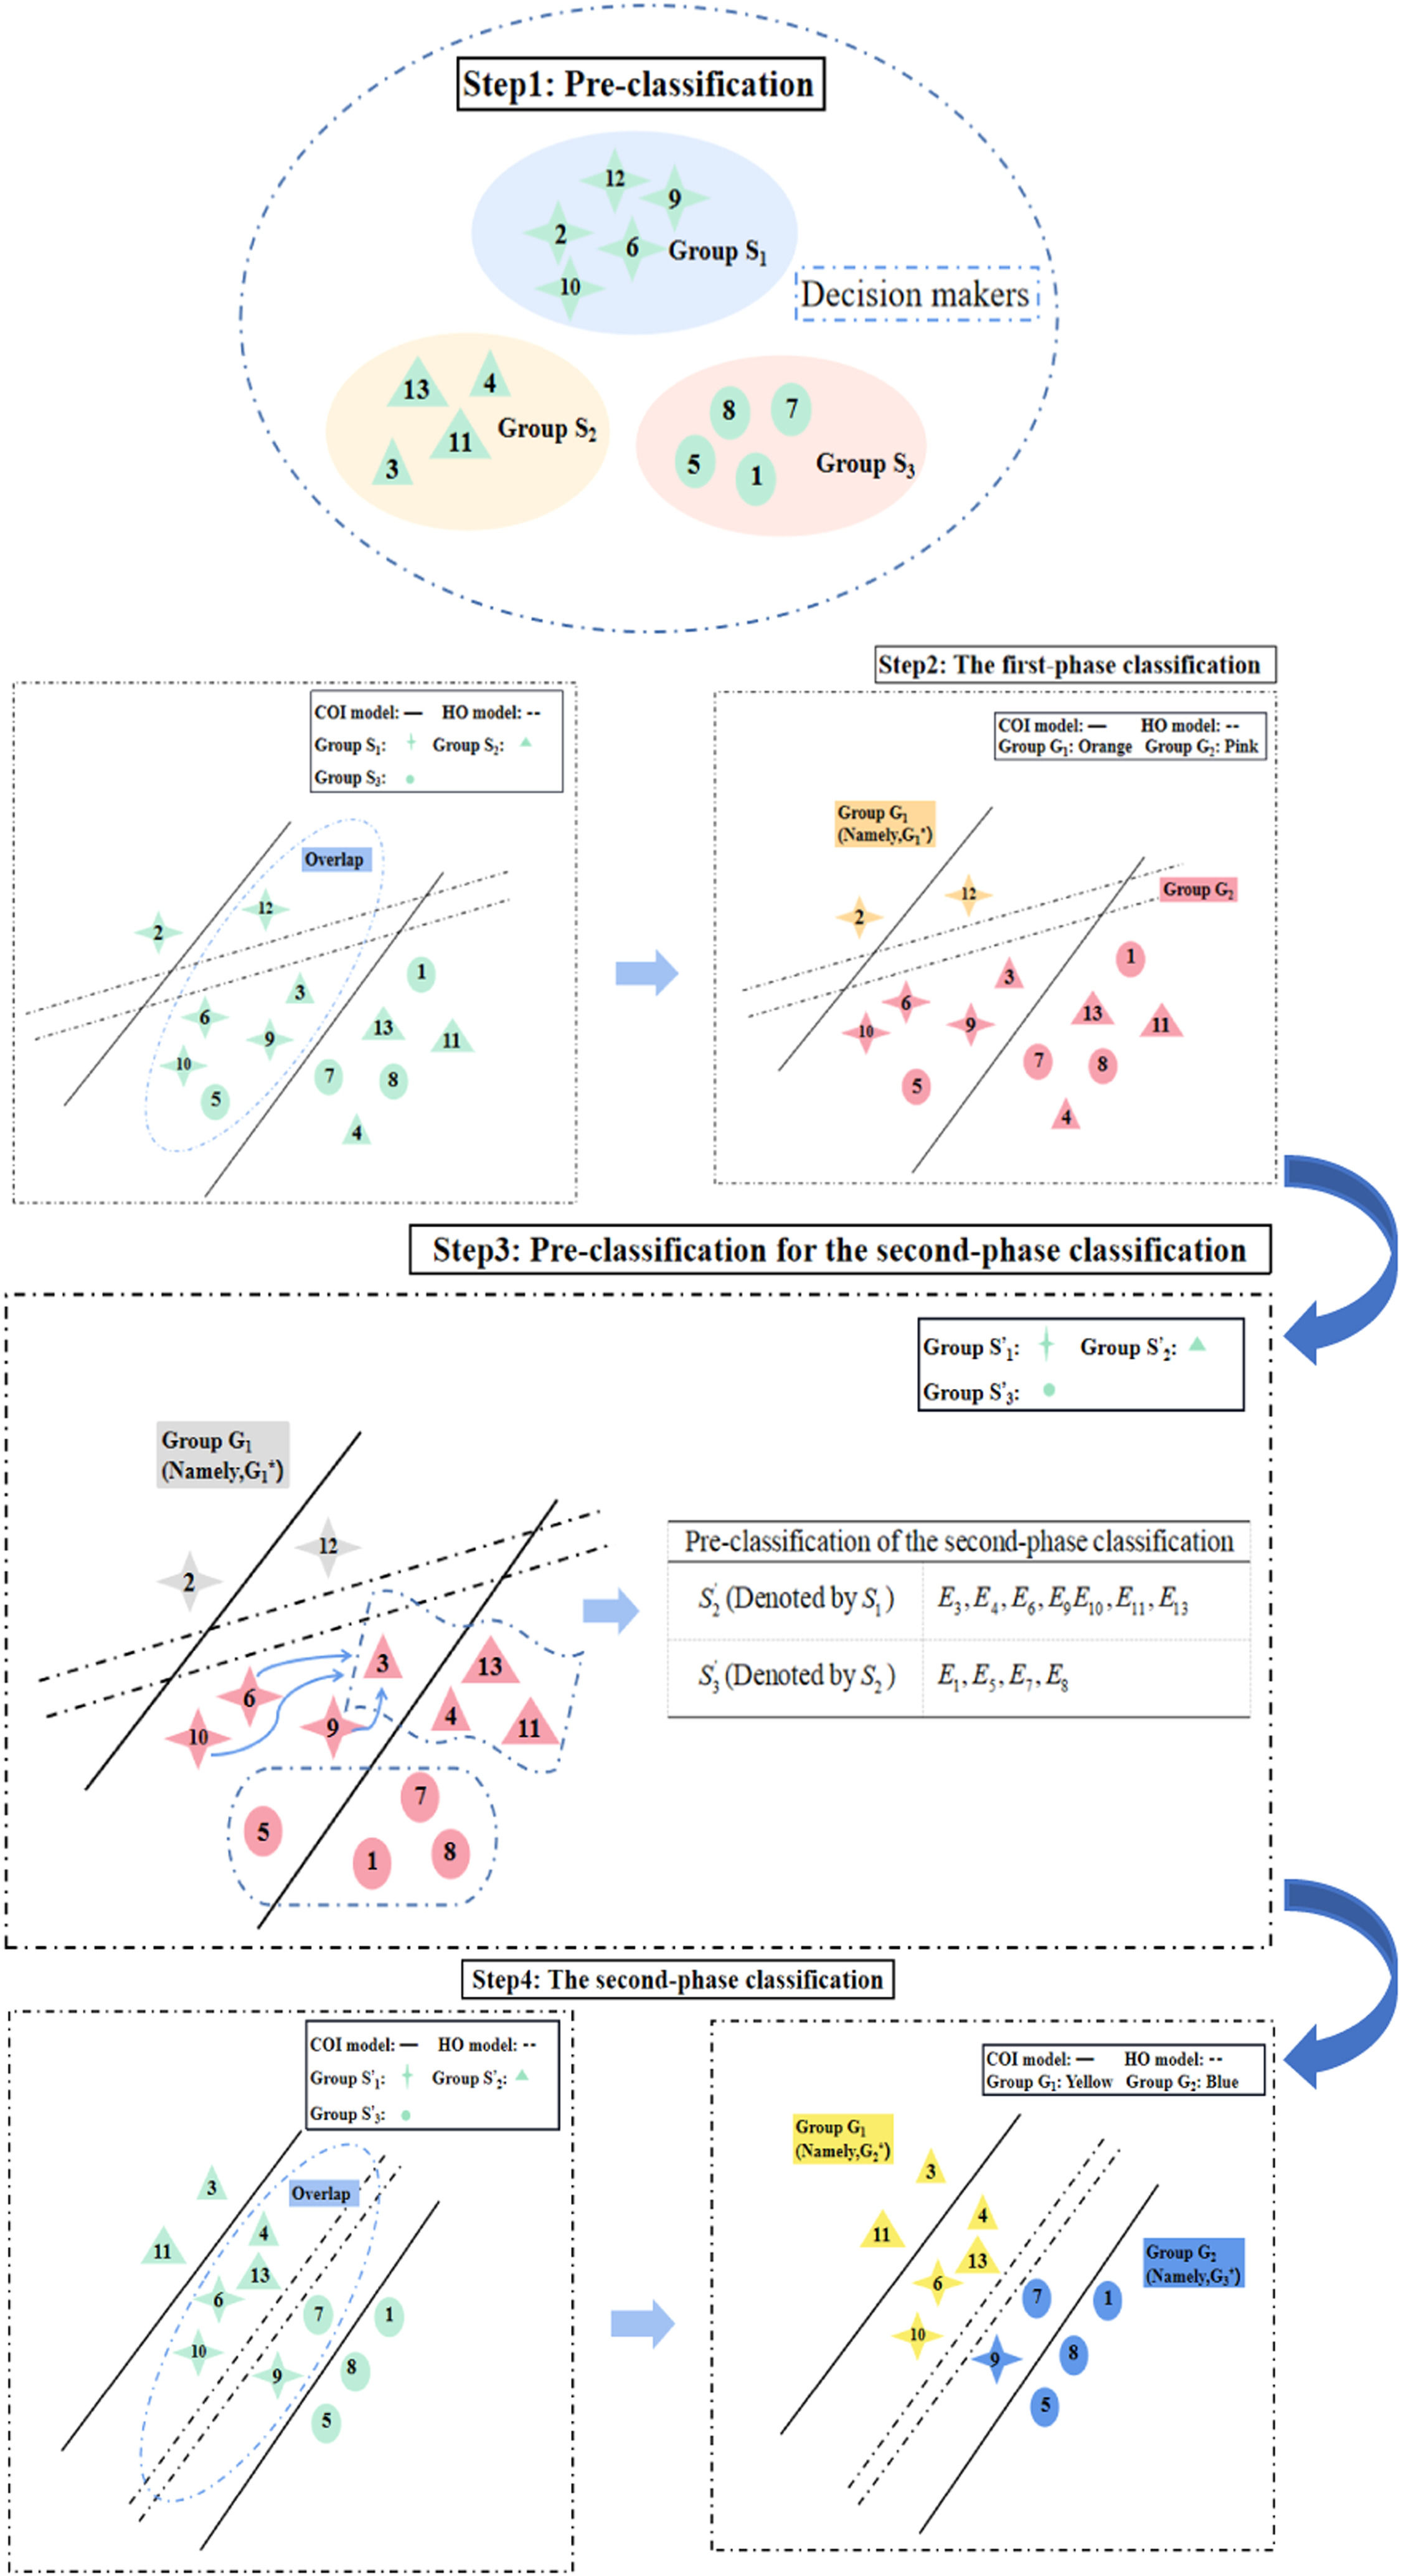
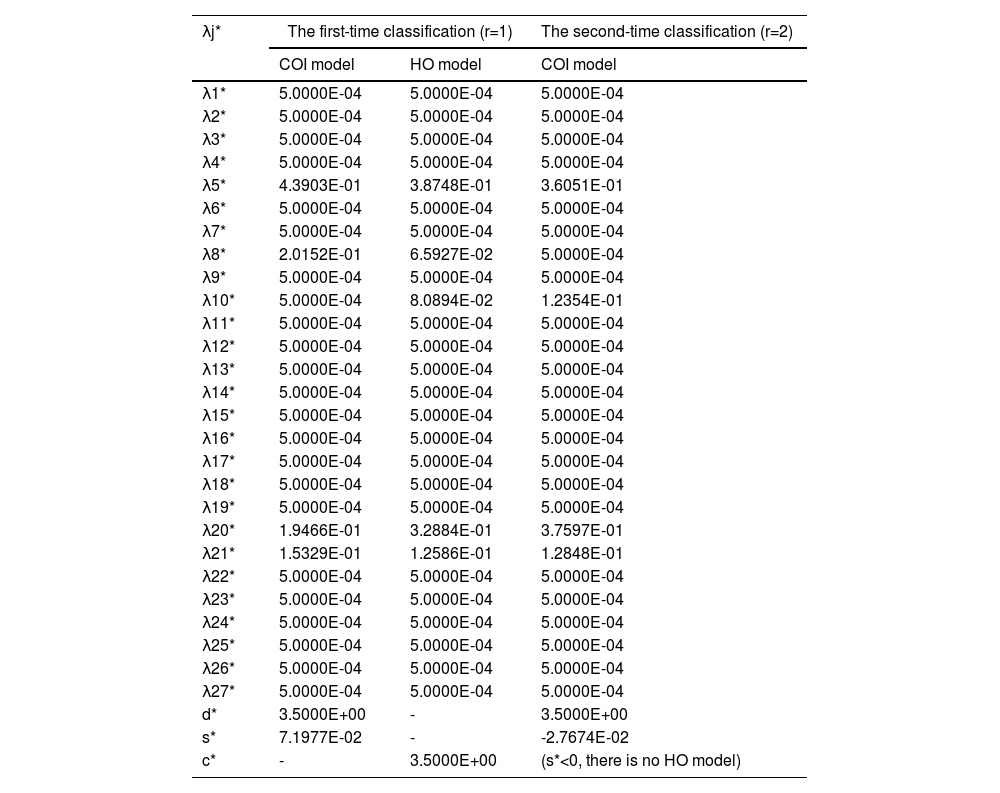
Probability-based MIP DEA-DA cyclic classification (P-MIP DEA-DA) modelMIP DEA-DA contains two linear programming process (i.e., Stage 1 and Stage 2). Given two groups G1 and G2,Stage 1 identifies the overlap areas that contain both groups’ members using two hyperplanes and also generates two new groups that are outside those areas. Stage 2 constructs another two hyperplanes to classify members within the overlap areas into two groups.
Stage 1: Classification and overlap identification (COI)

All other variables are nonnegative. The notations in the above COI model are described as follows. cij(i=1,2,⋯,m;j=1,2,⋯,n) represents the value of the ith stakeholder for the jth alternative. Namely, cij is equal to the mean of fij. λj=λj++λj−,λj+=(|λj|+λj)/2,λj+=(|λj|−λj)/2,|λj|=λj++λj− represents the weight of the jth alternative. ξj+≥λj+≥εξj+,ξj−≥λj−≥εξj−andξj++ξj−≤1,j=1,2,⋯,n is the nonlinear condition. ε is a small number (0.0005). d indicates the discriminant score and ssignifies the deviations of the linear discriminant function from the discriminant score d. n is the number of alternatives.
The optimal solutions of the COI model are λj+*,λj−*,d*,s*. (a) If s*<0 (i.e., there is no overlap area), then the computation of P-MIP-DEA-DA is stopped. All members are clearly classified into G1 or G2 according to ∑j=1nλj**cij=d*. (b) If s*≥0 (i.e., there is an overlap area), then we proceed to Stage 2. All members can be classified into the following subset using the COI model:
- (1)
New−G1={i∈New−G1|∑j=1n(λj+−λj−)cij>d*+s*},
- (2)
New−G2={i∈New−G2|∑j=1n(λj+−λj−)cij
- (3)
K1=G1−New−G1,
- (4)
K2=G2−New−G2,
- (5)
Overlap=K1∪K2={i∈Overlap|d*−s*≤∑j=1n(λj+−λj+)cij≤d*+s*}.
Fig. 3 shows the classification of all members into five subgroups, where the triangles depict members of G1, the dots depict members of G2, the green triangles depict members of New−G1, the orange dots depict members of New−G2, the blue triangles depict members of K1, and the blue dots depict members of K2. The overlap area is the area between the two lines.
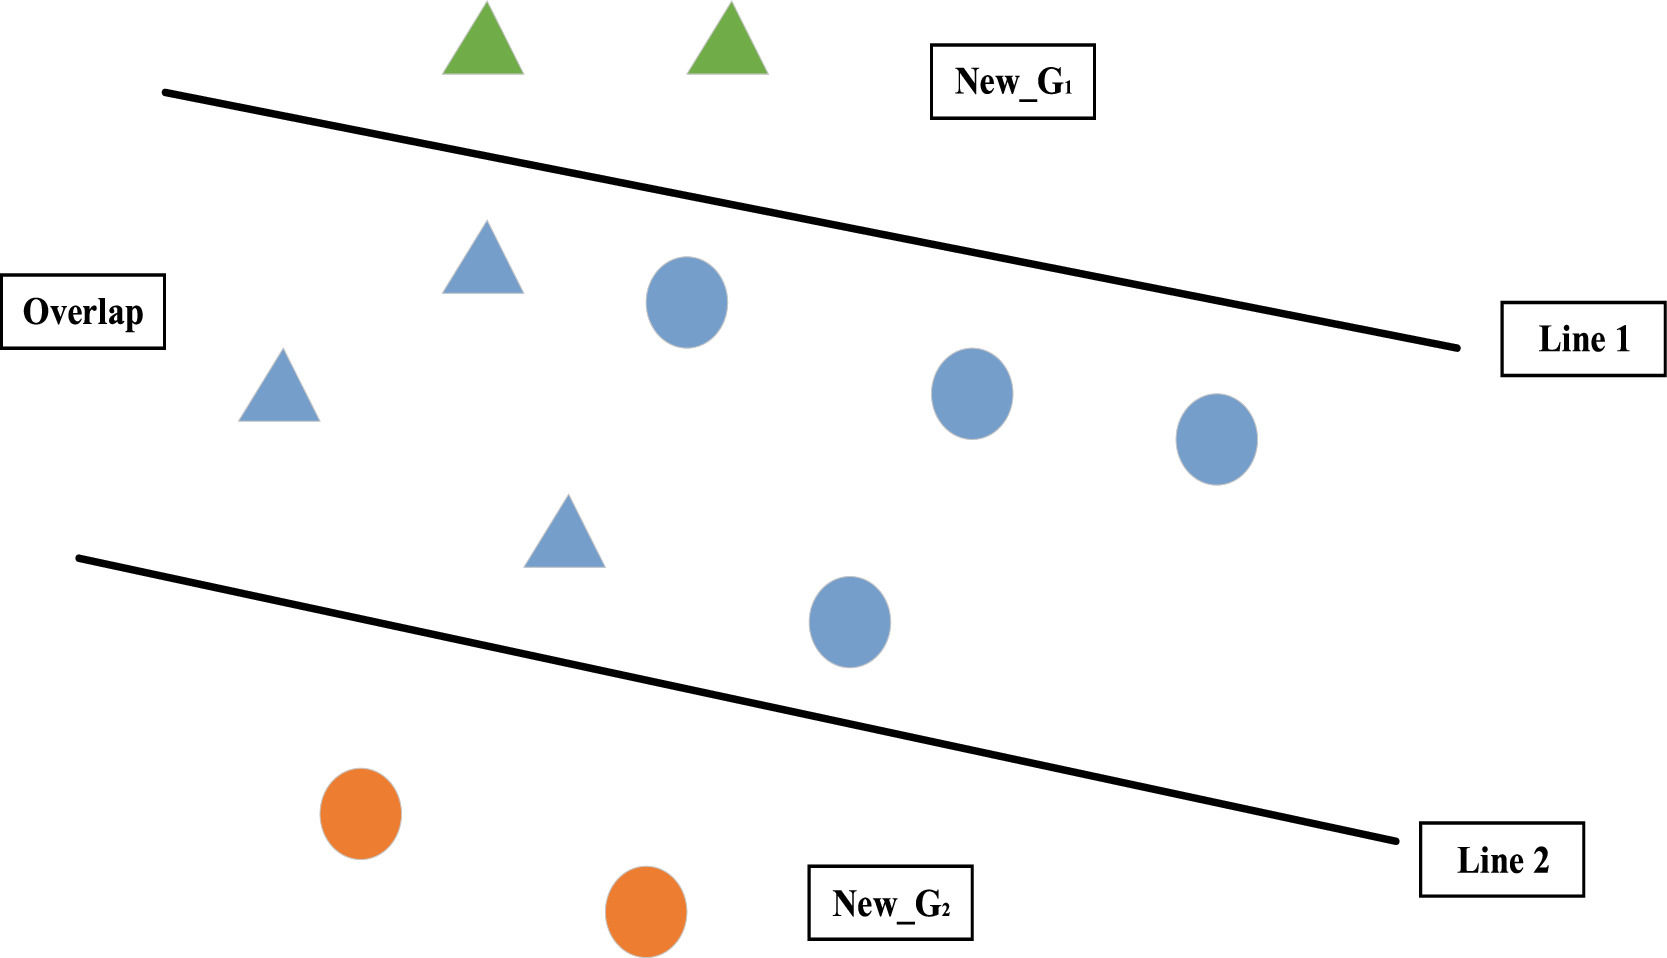
Stage 2: Handling overlap (HO)

.")
All other variables are nonnegative. The notion instructions of the HO model are as follows. M is a given large number (M=10000in this paper). yi is a binary variable. The meanings of other variables are the same as in the COI model.
The optimal solutions of the HO model are λj+*,λj−*,c*. The overlap area identified in the COI stage can be further classified as follows:
- (1)
New−G1={i∈New−G1|i∈Overlap,∑j=1n(λj+*−λj−*)cij≥c*},
- (2)
New−G2={i∈New−G2|i∈Overlap,∑j=1n(λj+*−λj−*)cij≤c*−ε}.
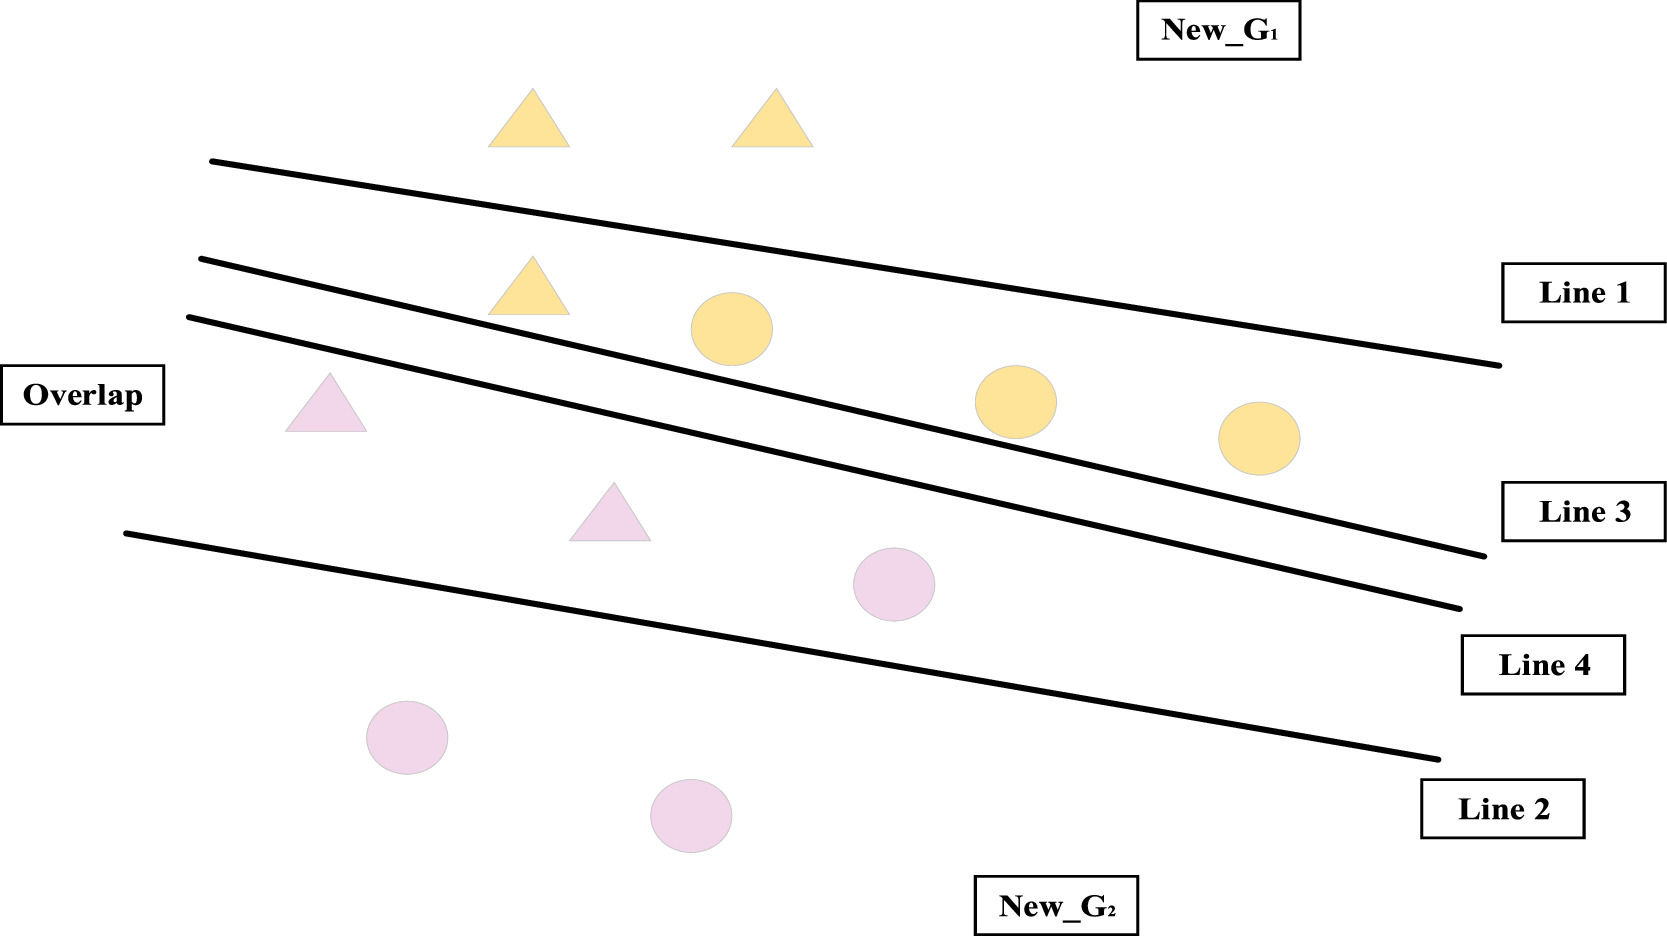
For clarity, Fig. 4 shows the classification of the HO model. In Fig. 4, the overlap area is separated into two subsets by Lines 3 and 4 that indicate the discriminant function ∑j=1n(λj+*−λj−*)cij=c* and ∑j=1n(λj+*−λj−*)cij=c*−ε, respectively. Fig. 4 shows the final groups, where all triangles depict members of G1, all dots depict members of G2, all yellow points depict members of New−G1, and all pink depict members of New−G2.
 stage.")
Compared with traditional classification methods, the newly proposed circular classification method makes two significant improvements. The first is that it eliminates the threshold limit, where the stability of the classification result stops the cyclic classification process. That is, the categories use in the rth generation are identical to those of r−1th, which implies that there is no need for a threshold to be used as a signal to stop the cycle. The second is that multiple classification cycles ensure the robustness of the results. The specific classification processes are as follows:
Step 1 Preclassification (first-phase classification): Suppose we collect Z decision samples through questionnaires or surveys. These samples are preclassified into h aggregations in accordance with the existing information (e.g., seniority, expertise), which are denoted by S1,S2,⋯,Sh when the corresponding quantities of aggregated integrations are u1,u2,⋯,uh.
Step 2 Presetting and classification (first-phase classification): Since the P-MIP DEA-DA model can only handle two groups, the presetting of h aggregations is essential. We denote S1 by G1 and group the others into G2. Then, the P-MIP-DEA-DA model can be utilized to discriminate and separate G1 and G2, which leads to the new classifications of G1(1) and G2(1). After ensuring that the new categories are consistent with the original categories, (i.e., G1(1)=G1 and G2(1)=G2), we proceed to Step 3; otherwise, we proceed to the next round of discrimination and classification employing the P-MIP-DEA-DA model until the result of the rth classification is the same as that of the r−1th classification. The conditions that must be met for the loop to stop are when G1(r−1)=G1r and G2(r−1)=G2r. G1(1)is the first classification, denoted by G1*, and G2(r) is the initial value for the next stage of classification.
Step 3 Preclassification (second-phase classification): In this step, we preclassify the group G2(r)={S1′,S2′,⋯,Sh′} obtained in Step 2. Suppose that the numbers of samples in G1* are v1,v2,⋯,vh and those in G2(r)are u1′,u2′,⋯,uh′. Si′ denotes the samples in Si minus those in G1*. Accordingly, the number of samples Si′ is ui′=ui−vi. Samples in Si′ will be allocated to S1′,⋯,Si−1′,Si+1′,⋯,Sh′ according to Eq. (12). The probability matrix of samples from Si′ is denoted by Pu′(u′=1,2,⋯,ui′) according to Eq. (9). The aggregated probability vectors of S1′,⋯,Si−1′,Si+1′,⋯,Sh′ can be obtained by Yq(q=(i,⋯,i−1,i+1,⋯,h)). Eq. (12) can be used to obtain the consensus level CL(Pu′,Yq) to measure the consistency between Si′ andS1′,⋯,Si−1′,Si+1′,⋯,Sh′. Let us assume that CL(Pu′,Yq)=max{CL(Pu′,Yq),q=1,⋯,i−1,i+1,⋯,h}. Then, Yt is most consistent with Pu′ and thus the sample Pu′ will be distributed to St′. Similarly, the other preferences P1,P2,⋯,Pu′ are allocated to S1′,⋯,Si−1′,Si+1′,⋯,Sh′. Ultimately, we can obtain h−1 reassigned aggregations denoted as S1,S2,⋯,Sh−1 that contain u1′,u2′,⋯,uh−1′ samples.
Step 4 Presetting and classification (second-phase classification): Similar to Step 2, we denote S1 by G1 and assign all others to G2. We adopt the P-MIP-DEA-DA model to conduct the new classification procedure and apply the discriminant conditions until the stop conditions are met. Suppose that we obtain G1* and G2(r), where G1* is the desired category. Then, CL can be used to establish the classification used in the third-phase classification.
Step 5 Sorting of classification results: The above classification processes are repeated to the h−1th iteration. We obtain h aggregations that are reassigned through the novel classification method (i.e., G1*,G2*,⋯,Gh*) and contain u1*,u2*,⋯,uh* samples.
We use Eq. (12) to obtain the CL between stakeholders in the same group. Then, we calculate the mean of consistency as the CL of the group. We denote the CL between stakeholder di and stakeholder dj in group Gh* as CL(di,dj) and the CL of group Gh* as CL(Gh*). Following:
where uh* is the number of samples in group Gh* and CL(Gh*) satisfies Propositions 1 and 2.
It is essential to invite stakeholders to judge whether the consistency in each new group is acceptable. If the consistency passes the test, then we proceed to the aggregation process (Section 4.3); otherwise, we proceed to the consensus management process (Section 4.4).
AggregationThis section introduces the method used to obtain the aggregated opinion of the group. The aggregation process aims to aggregate all individual opinions and commonly includes both intra- and inter-group aggregation. The QA function is used for the aggregation process. The intra-group aggregation is given by:
where fij(x)−1 is the inverse of fij(x). fpj∈[0,1] describes the PDF of the pth group for the jth alternative, and the pth group contains up* stakeholders. fp represents the aggregated opinions of the pth group on all alternatives, and h is the number of stakeholder groups obtained in Section 4.2.

The inter-group aggregation derives the final decision-making result by integrating all intra-group aggregations. The calculation is as follows:
where fij(x)−1 is the inverse of fpj(x),fQAj∈[0,1] represents the final decision on the pth alternative, and fQA is the collection of aggregated opinions on all alternatives.Consensus management & adjustment

Consensus management and adjustment is an important procedure for improving consistency that consists of two successive tasks: (1) identifying the samples that differ the most from the collective preference, and (2) applying expertise-based feedback mechanisms to adjust individual assessments. The proposed rules aim to not only bring individual opinions closer to the consensus, but also to further assist stakeholders in improving their assessments.
- (A)
Identify the most differentiated individual. We calculate the mean of fij(i=1,2,⋯,m;j=1,2,⋯,n) using fQAj(j=1,2,⋯,n), where Cij denotes the mean matrix of fij(x) and CQA_j denotes the mean matrix of fQA.
We then compute the Euclidean distance between Cij and CQA_j. The pairwise comparison matrix can be delineated as follows.
If Dpq=Max(Dij)(i=1,2,⋯,m;j=1,2,⋯,n), the opinionfpq of stakeholder dp is the farthest from the group consensusfQAq.
- (B)
Adopt the expertise-based consensus adjustment regulations. Expertise-based consensus adjustment is used to improve stakeholders’ level of expertise. Suppose that the individual farthest from the group is identified as di. Then, decision-makers can be classified into two categories according to their expertise as follows:
- (A)


AR. 1 If cij
AR. 1.1 If di∈D−,∃D′={do∈D+:cij≤coj≤cQA_j},D′≠∅,
then, fij←foj.
AR. 1.2 If di∈D+,∃D′={Do∈D+:cij≤coj≤cQA_j∧λi≤λo,di≠do},D′≠∅,
then, fij←foj.
AR. 2 If cij>cQA_j, then decrease cij according to:
AR. 2.1 If di∈D−,∃D′={do∈D+:cQA_j≤coj≤cij},D′≠∅,
then, fij←foj.
AR. 2.2 If di∈D+,∃D′={do∈D+:cQA_j≤coj≤cij∧λi≤λo,di≠do},D′≠∅,
then, fij←foj.
The expertise-based consensus adjustment rules pay more attention to stakeholders with lower levels of expertise, which makes the consensus-building process more credible.
The GDM decision-making process under probabilistic preference conditions can be summarized as follows.
Step 1 Preference collection: Collect stakeholders’ preference information for n alternatives and fit the set of probability distribution functions for all stakeholders.
Step 2 Weighting: Apply the expertise-based weighting method to obtain the weight vector W=(λ1,λ2,⋯,λm).
Step 3 Classification: Obtain h aggregations S1,S2,⋯,Sh by adapting the cyclic classification method for probabilistic preference.
Step 4 Consensus reaching: Achieve a consensus by satisfying the consistency requirement set forth in the expertise-based consensus adjustment guildelines.
Step 5 Opinion aggregation: Through QA aggregation, the final result is obtained such that fQA={fQA1,fQA2,⋯,fQAn}.
The GDM proposed above can be widely applied to decision-making problems in various scenarios. This study focuses on the barriers to blockchain adoption in SSCs, the details of which are presented in Section 5.
Data analysisIn this section, we apply the expertise-based GDM introduced in Section 4 to evaluate the intensity of the barriers to blockchain adoption in SSCs.
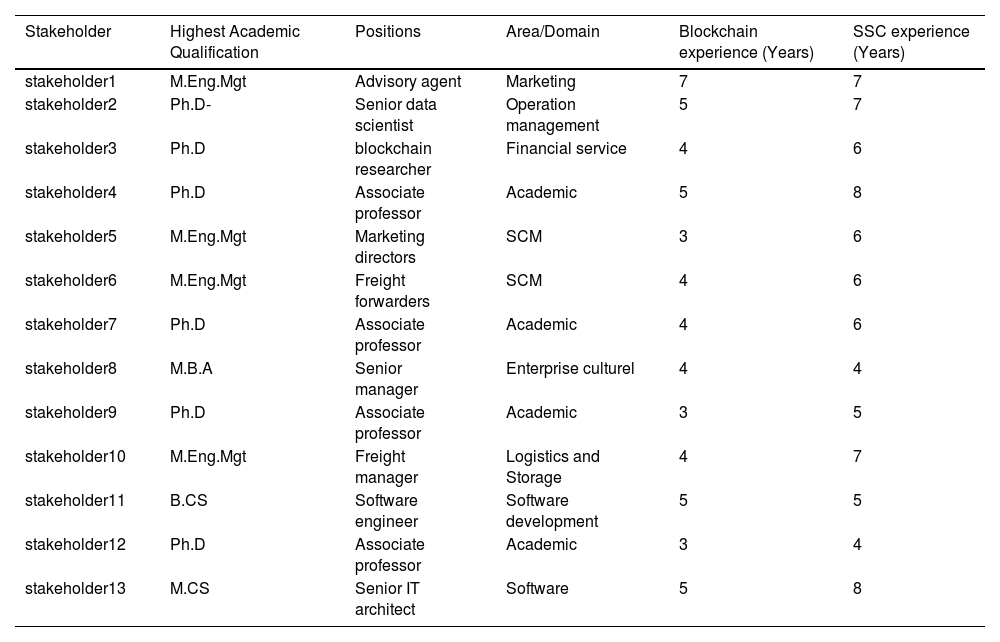
BackgroundIn Section 3, we identified 27 barriers to blockchain adoption in SSCs using the PEEST framework. We surveyed 13 stakeholders with knowledge of blockchain adoption in SSCs. The stakeholders include marketing directors, operating consultants, freight forwarders, software executives, financial supervisors, and academics. Table 2 shows the characteristics of the stakeholders
Profile of the stakeholders.
Stakeholders may have idiosyncratic preferences and evaluations of the intensity of each barrier to bockchain adoption. Estimating the expertise level of each stakeholder is beneficial to improving the reliability of the decision-making process. Section 5.2 introduces the levels of expertise of the 13 respondents.
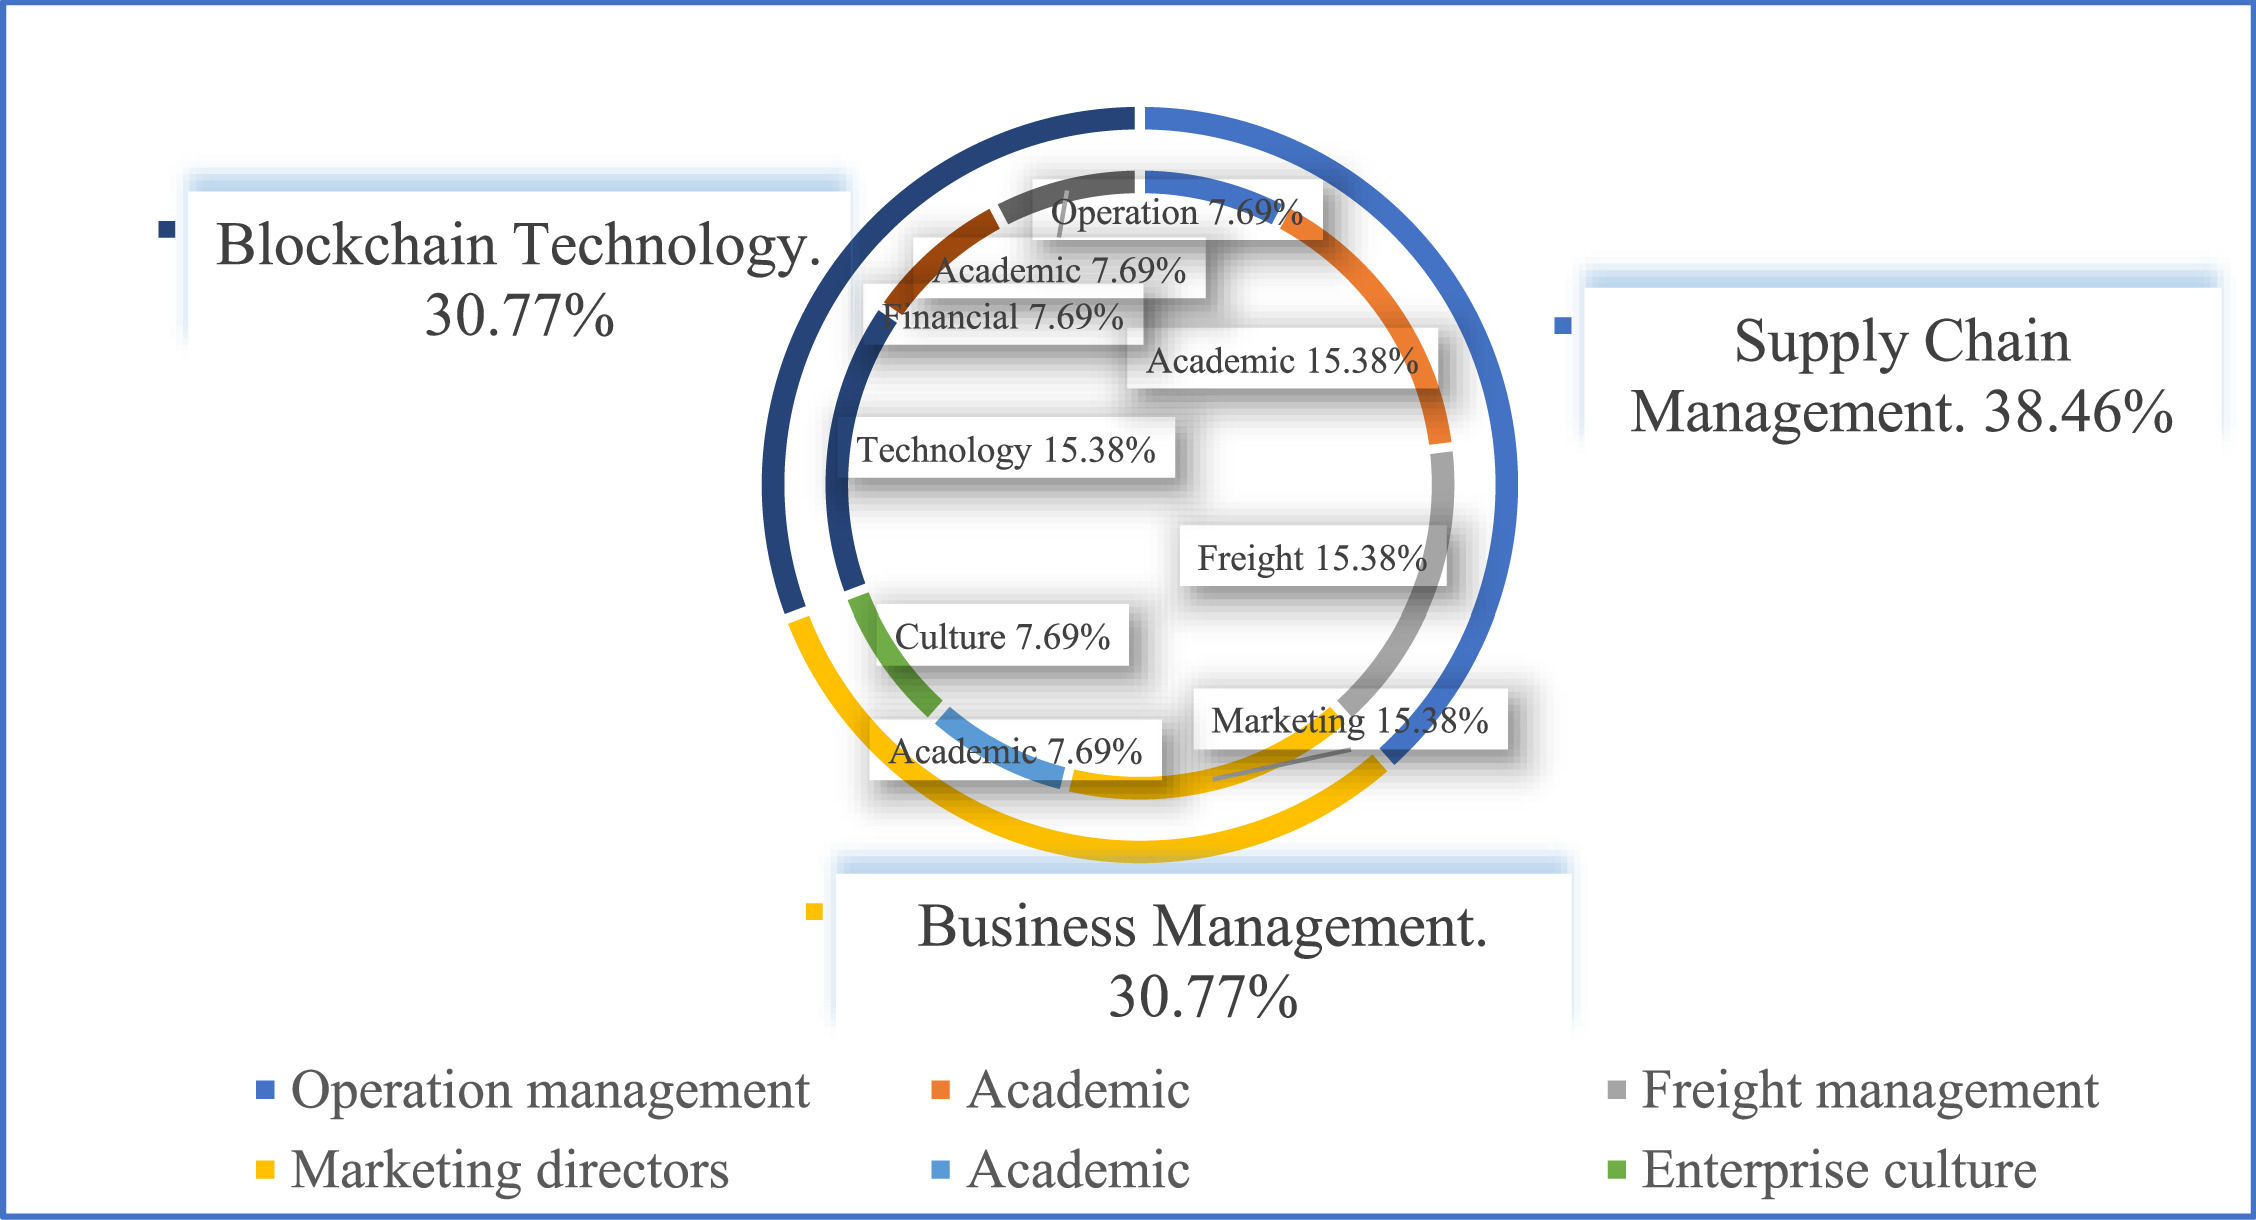
Assigning weights to stakeholdersData on the intensity of the barriers to blockchain adoption were gathered from 13 stakeholders with backgrounds in blockchain technology, supply chain management, and business management. Fig. 5 shows the backgrounds of the respondents.

Fig. 5 presents a comprehensive overview of the backgrounds of the 13 interviewed stakeholders. The inclusion of this background information is crucial as it serves as the basis for the preclassification of the stakeholders outlined in Section 5.3. This classification process ensures that the perspectives and insights provided by the experts are relevant and aligned with their respective expertise domains.
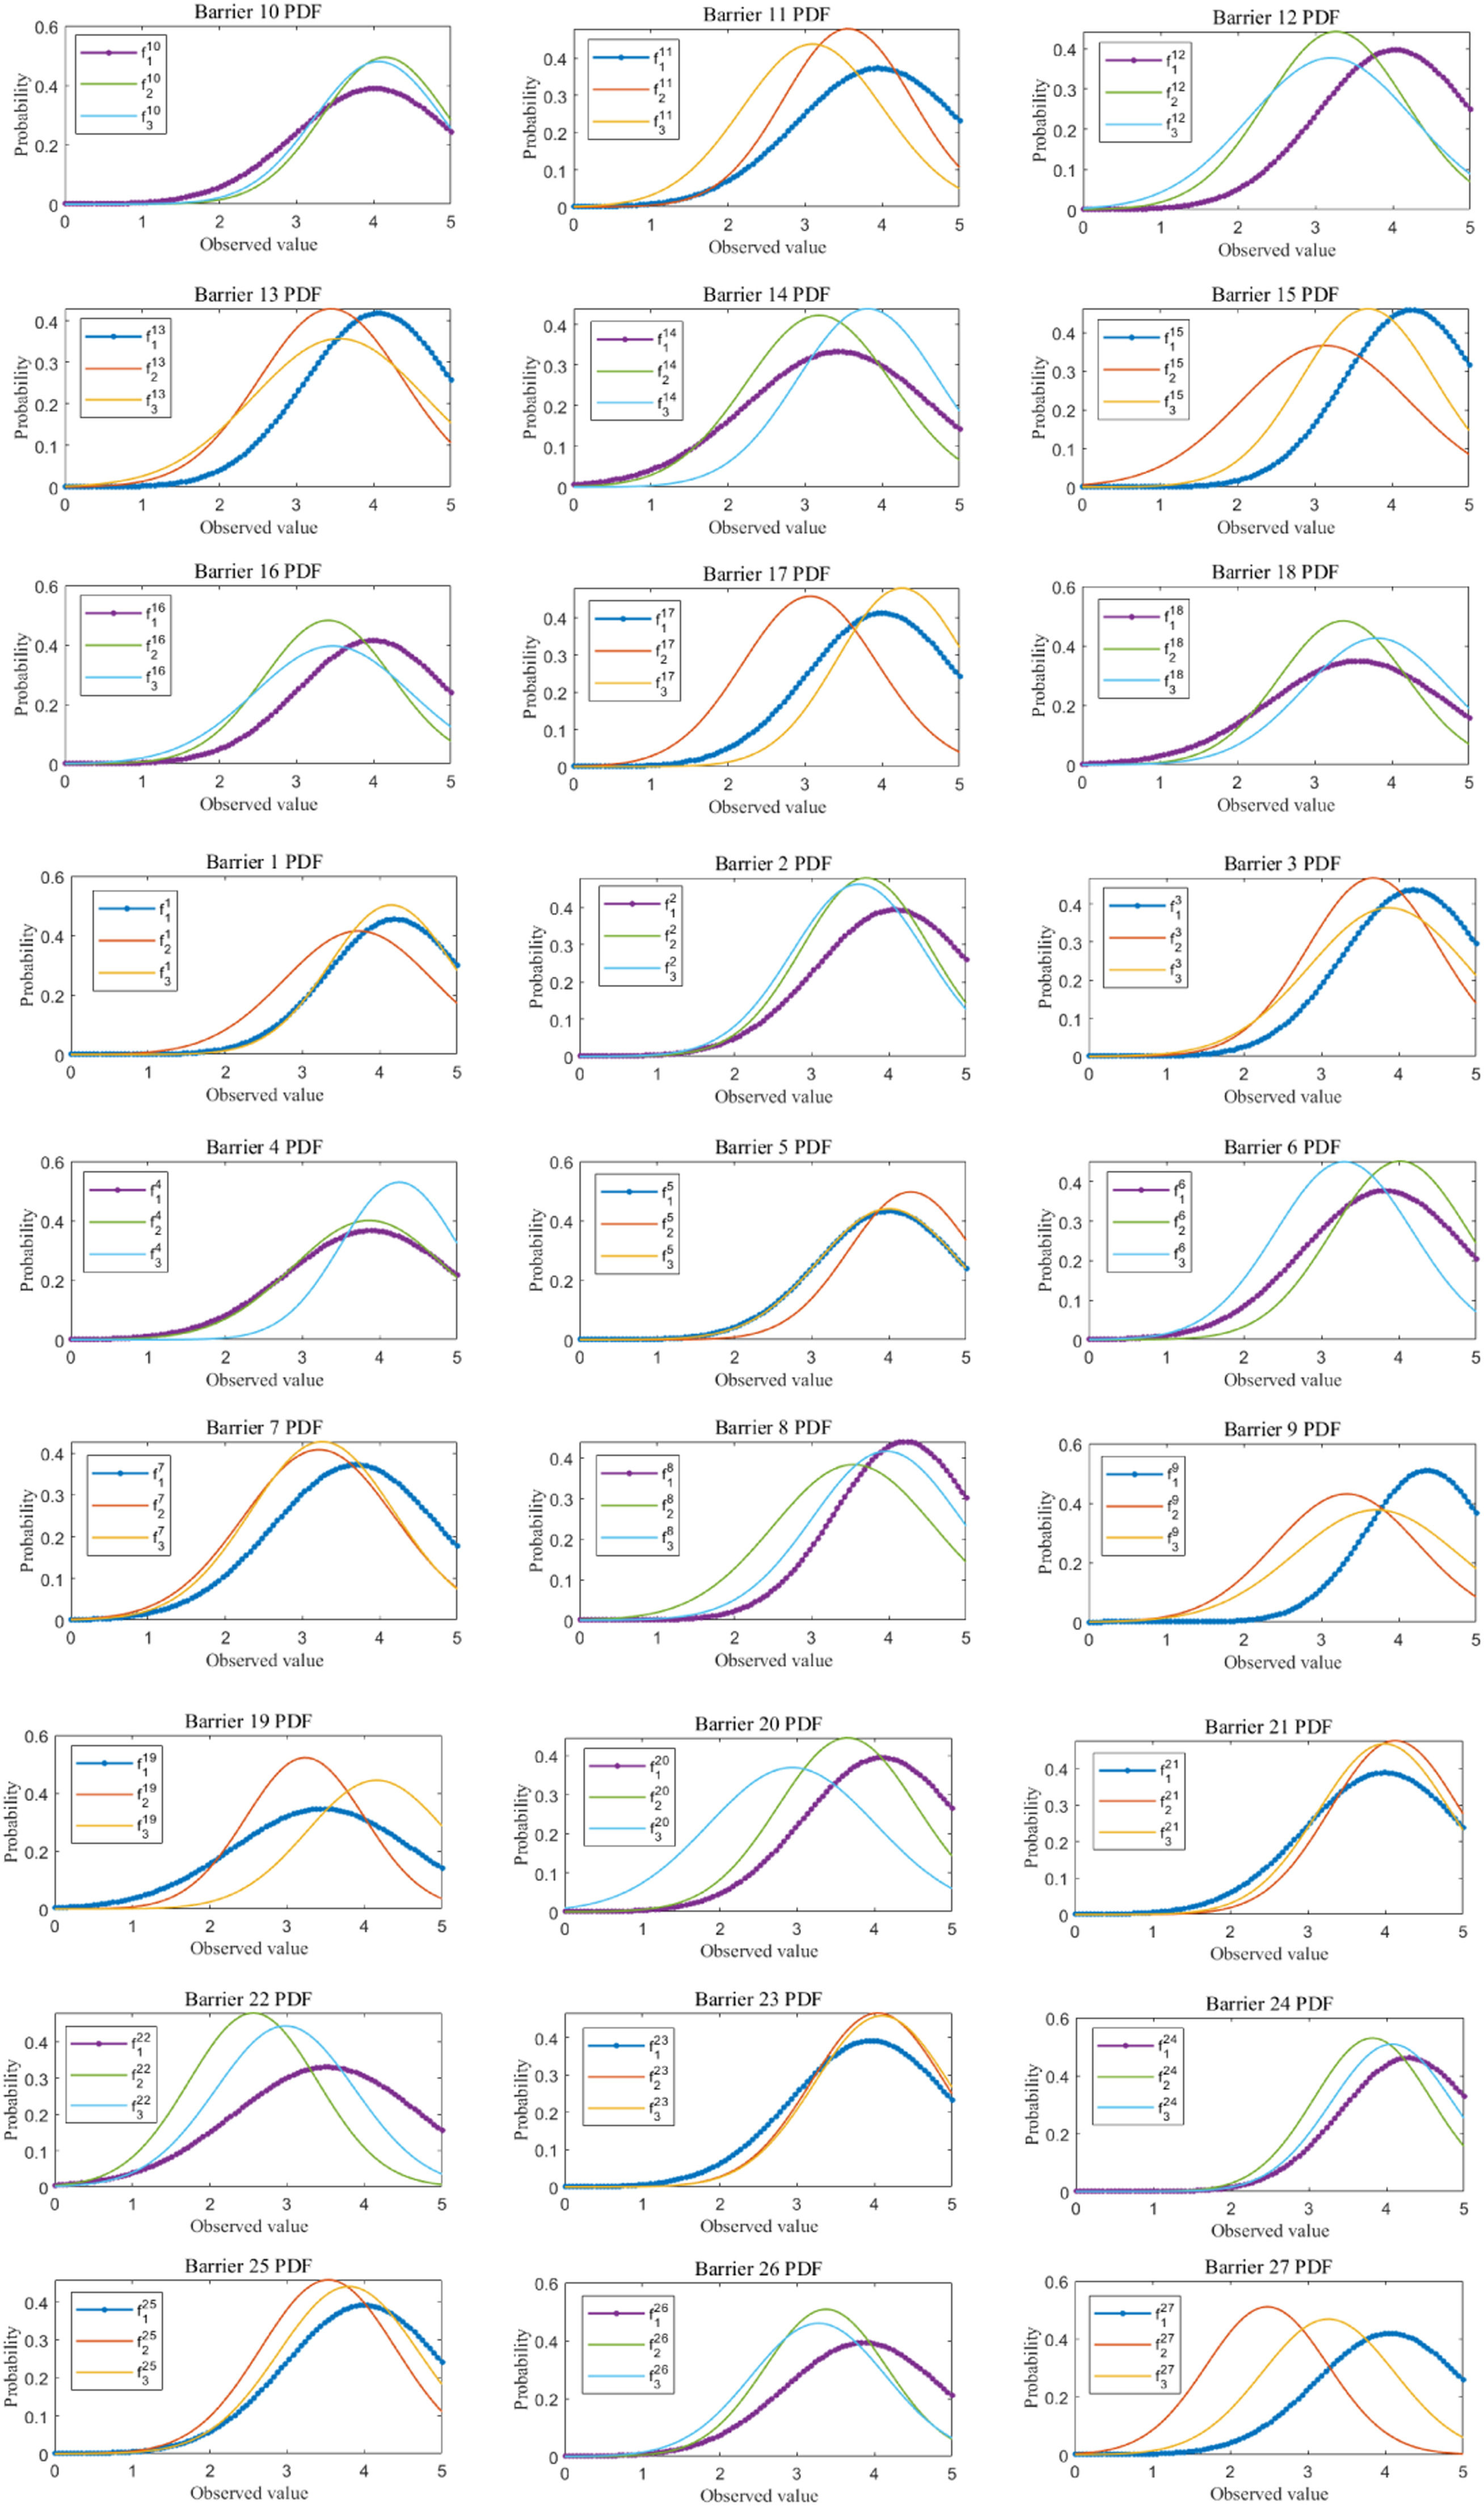
As mentioned in Section 2, stakeholders’ assessments are imprecise rather than vague or ambiguous. Therefore, this study extracts the assessment information as probabilistic data. We use MATLAB to fit the probability distribution of the assessments on 27 barriers. We denote the ith stakeholder by di and the probability distribution of the ith stakeholder on the jth barrier by fij.
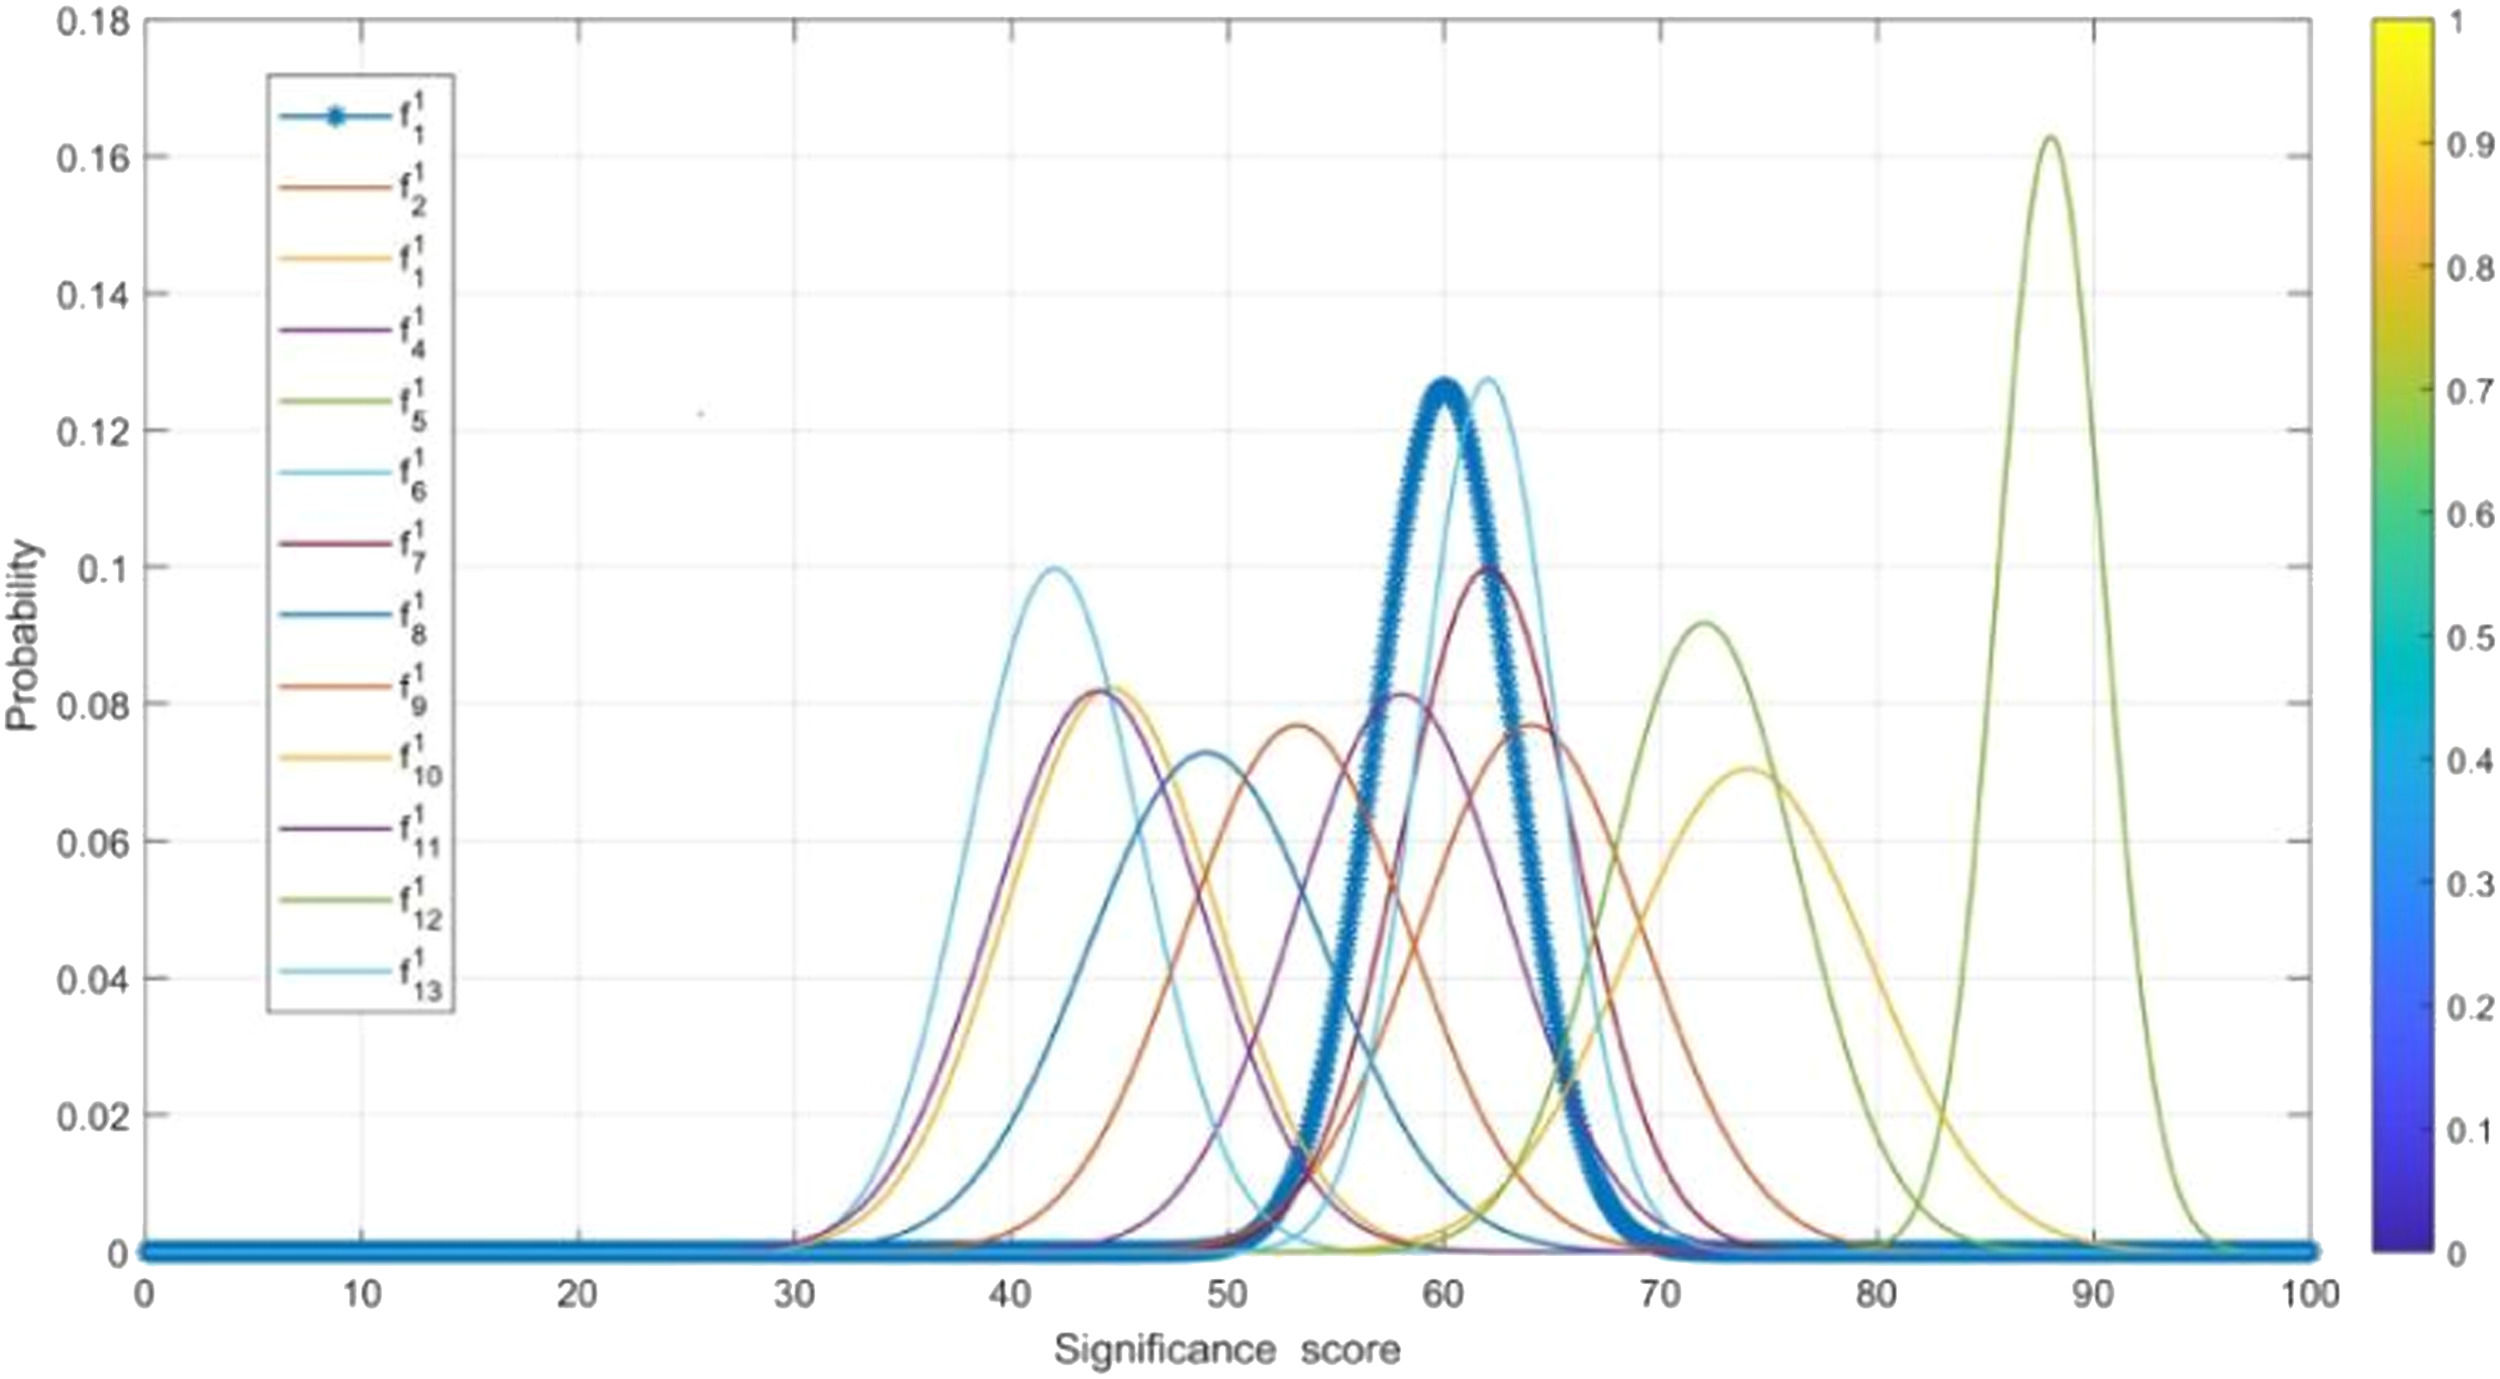
Fig. 6 presents the probability distribution of opinions from 13 stakeholders on Barrier 1 (Pol_1). Compared to other stakeholders, d6 gave the highest attention to (Pol_1), followed by d1 and d5.

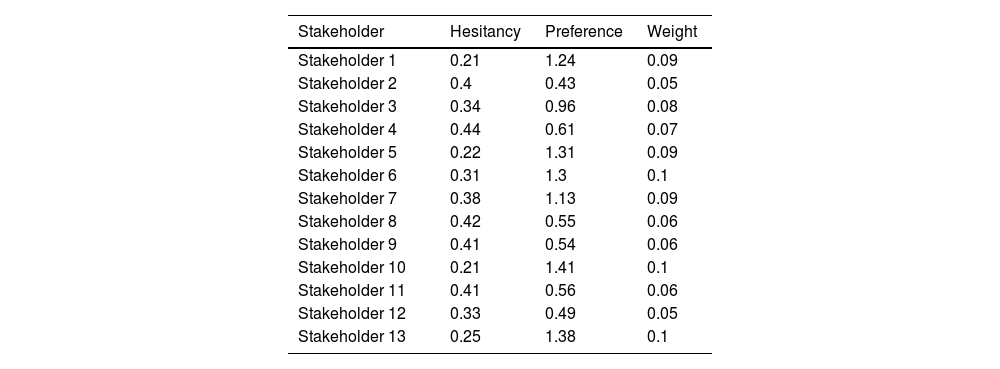
According to the expertise-based weighting method proposed in Section 4.1, we evaluate stakeholder according to their hesitancy and preference. Here, we suppose that both features are equivalent and thus allocate them equal weights—that is, w1=w2=1. Table 3 shows the intermediate parameters and weight estimates of 13 stakeholders.
The intermediate parameters and weight estimates of 13 stakeholders.
This section aims to reduce data dimensionality using the cyclic classification method proposed in Section 4.2.
Step 1: Preclassification:
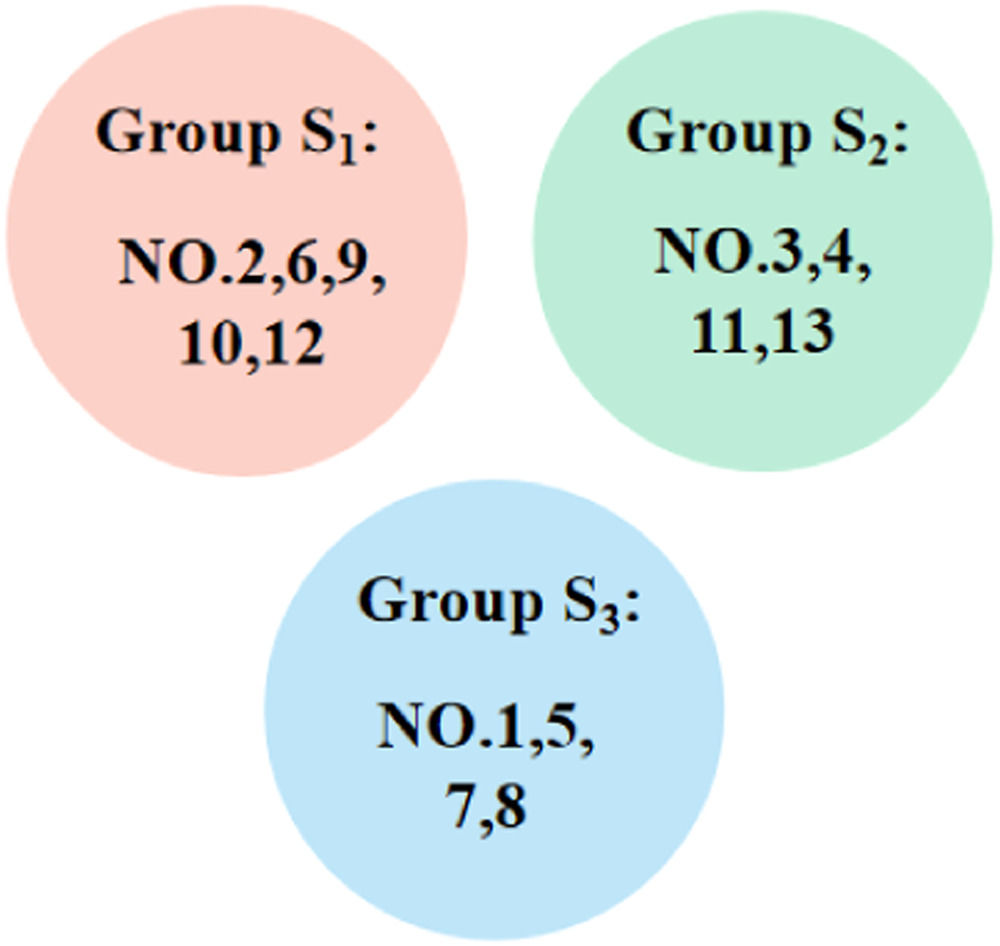
We first divided the 13 stakeholders into three groups as follows: a supply chain management group S1 that contains stakeholders 2, 6, 9, 10, and 12; a blockchain technology group S2 that contains stakeholders 3, 4, 11, and 13; and a business management group S3 that contains stakeholders 1, 5, 7, and 8. Fig. 7 presents the preclassification results.

The numbers of samples from S1,S2,S3 are u1=5,u2=4, and u3=4.
Step 2: Presetting and classification (first-phase classification):
Presetting: We denote S1 by G1 and S2 and S3 by G2. Namely, G1={d2,d6,d9,d10,d12} andG2={d1,d3,d4,d5,d7,d8,d11,d13}.
Classification: We use the P-MIP DEA-DA model to classify the assessments into two groups. Tables 4 and 5 (shown in Appendix A) present the parameters and the cyclic classification results of the first-phase classification (denoted by G1(1) and G2(1), respectively). Obviously, G1≠G1(1) and thus we take G1(1) and G2(1) as the initial groups and reuse the P-MIP DEA-DA model for reclassification. The second grouping results are denoted by G1(2) and G2(2). We check the loop stop condition and find that G1(1)=G1(2). Accordingly, the final result of the first-phase classification is G1(1)=G1(2)={d2,d12} and G1(1)=G1(2)={d1,d3,d4,d5,d6,d7,d8,d9,d10,d11}. G2(2) is the first classification, denoted by G1*. In G1*, the number of samples belongs to S1,S2,S3 and is denoted as v1=2,v2=v3=0. In G2(1), the samples from S1,S2,S3 are denoted by S1′,S2′,S3′, namely, S1′={d6,d9,d10},S2′={d3,d4,d11,d13}, and S3′={d1,d5,d7,d8}, and the number of samples belongs to S1′,S2′,S3′ and is denoted as u1′=3,u2′=4, and u3′=4, respectively. After completing this process, the classification process enters the third step.
Step 3 Preclassification (second-phase classification):
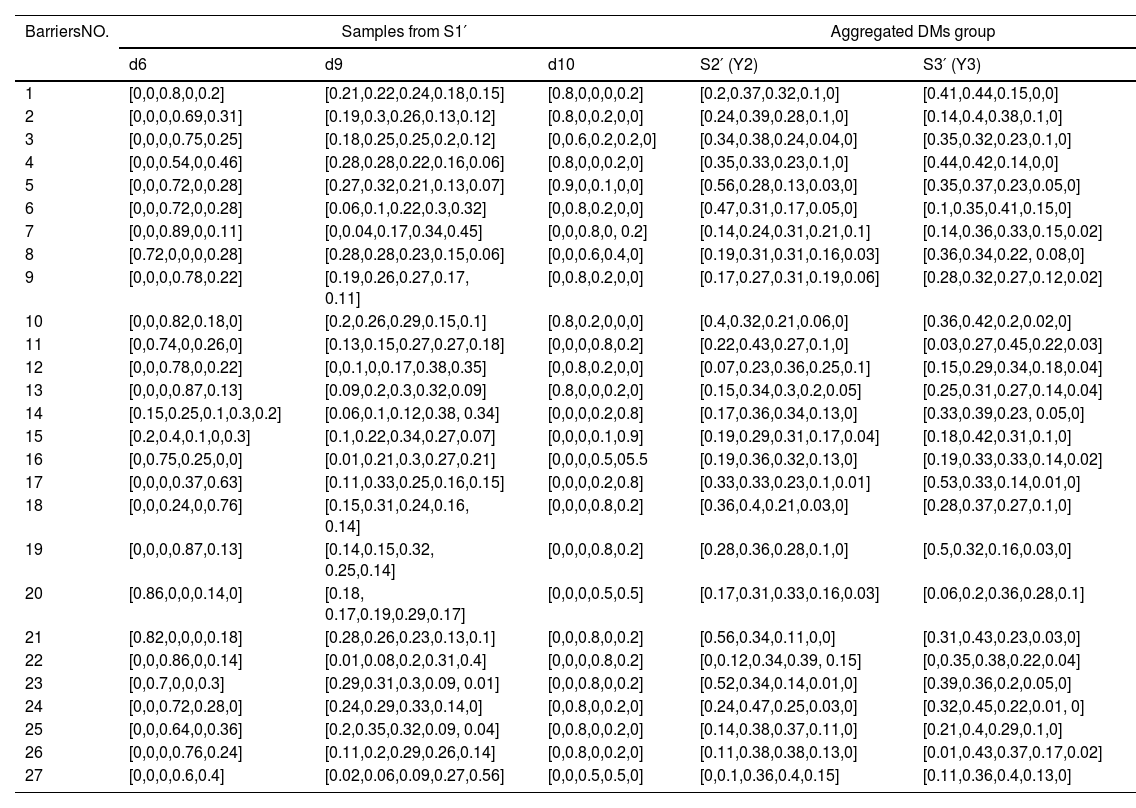
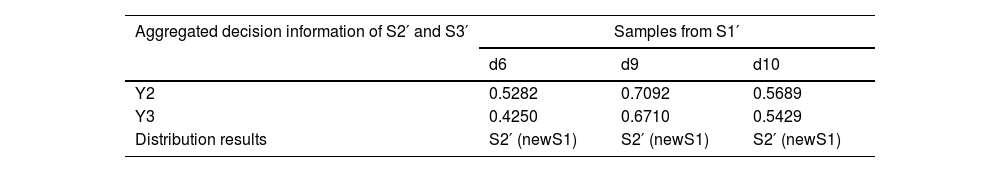
In this step, we preclassify the group G2(1)={d1,d3,d4,d5,d6,d7,d8,d9,d10,d11} obtained in Step 2. We utilize the CL function to distribute the samples in S1′={d6,d9,d10} into S2′={d3,d4,d11,d13} and S3′={d1,d5,d7,d8}. We denote the probability matrix of samples from S1′ as Pu′(u′=1,2,3) (shown in Table 6) and employ the QA function to calculate the aggregated probability matrix of S2′ and S3′ as Y2 and Y3 (shown in Table 6). Then, use the CL function to evaluate the consensus level of Y2 and each sample in S1′ as well as the consensus level of Y3 and each sample in S1′ (shown in Table 7). Finally, we obtain two new groups denoted as S1={d3,d4,d6,d9,d10,d11,d13} and S2={d1,d5,d7,d8}.
Step 4 Presetting and classification (second-phase classification):
We proceed with the second-phase discrimination and classification based on the preclassification obtained in Step 3.
Presetting: We denote the new S1 by G1 and S2 and S3 by G2, namely, G1={d3,d4,d6,d9,d10,d11,d13} and G2={d1,d5,d7,d8}.
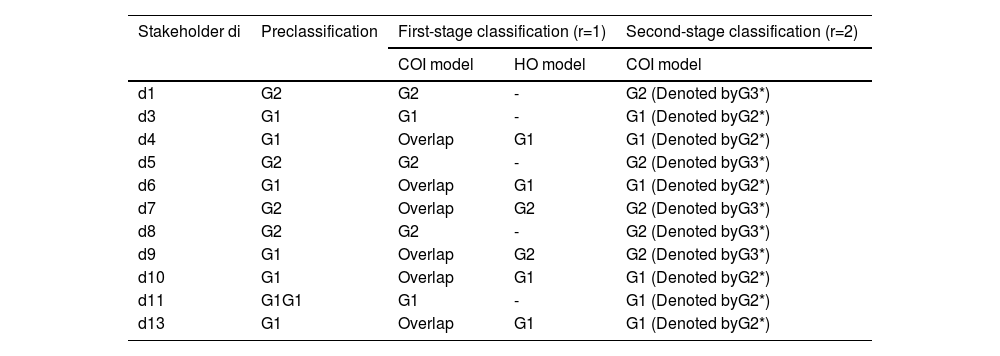
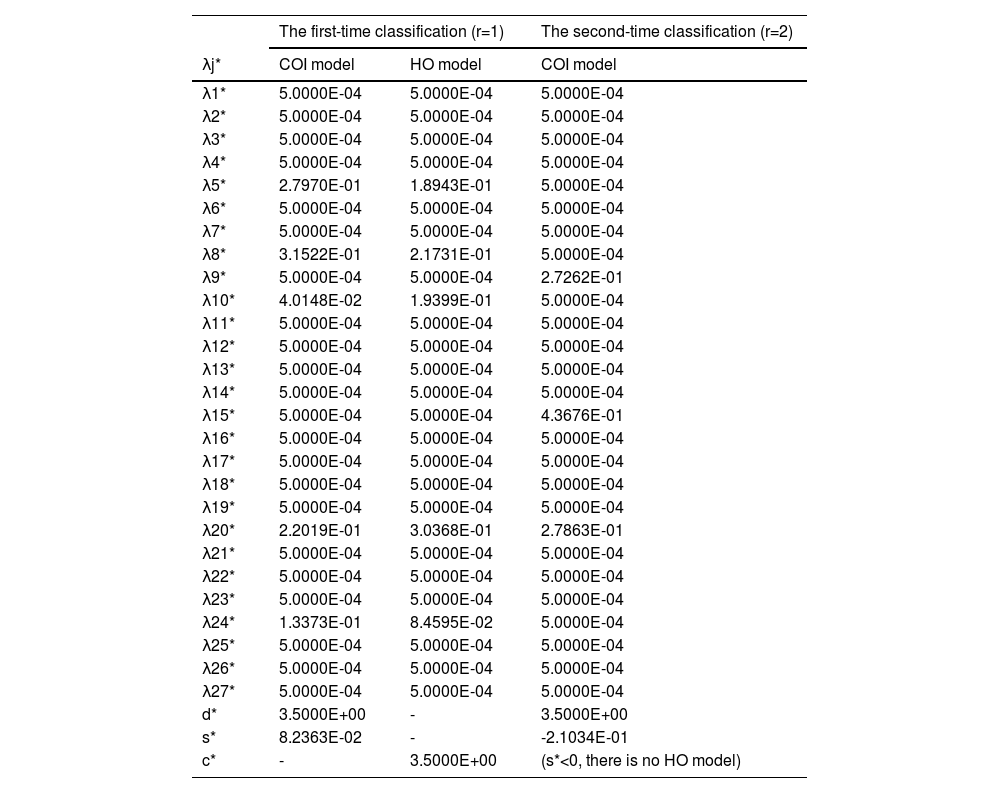
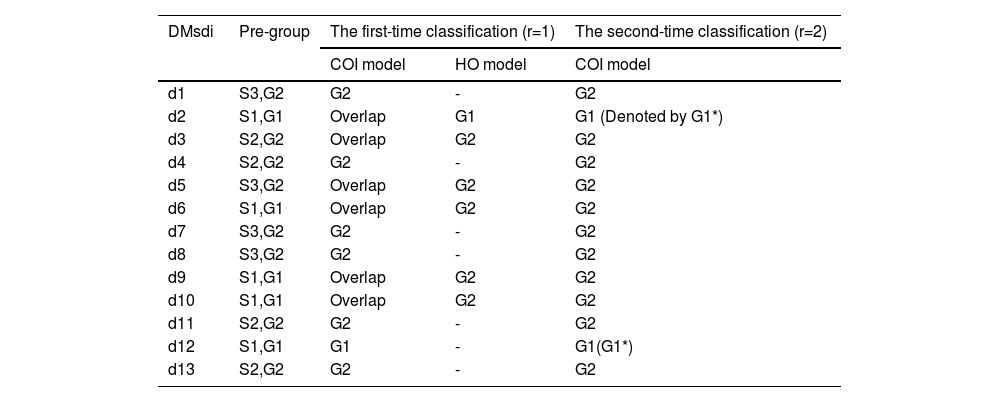
Classification: We use the P-MIP DEA-DA model to classify the assessment information into these two groups. Table 8 inAppendix A presents the parameters and estimated weights of each barrier in the second-phase classification, which are denoted by G1(1) and G2(1), respectively. Obviously, G1≠G1(1), and thus we take G1(1)and G2(1)as the initial groups and reuse the P-MIP DEA-DA model to for reclassification. The second grouping results are denoted by G1(2)and G1(2) (shown in Table 9). We check the loop stop condition and find that G1(1)=G1(2). Accordingly, the final classification is G1(1)=G1(2)={d3,d4,d6,d10,d11,d13} and G2(1)=G2(2)={E1,E5,E7,E8,E9}. G1(2) is the second classification that we need, denoted by G2*, and G2(2) is the third classification that we need, denoted by G3*.
The cyclic classification results of stakeholders in the second-phase classification.
Table 9 shows the results of second-phase classification where G1*={d2,d12},G2*={d3,d4,d6,d10,d11,d13}, and G3*={d1,d5,d7,d8,d9}. The interviewed stakeholders were divided into three groups based on their profile. Specifically, S1={d2,d6,d9,d10,d12} includes stakeholders primarily focused on supply chain management, S2={d3,d4,d11,d13} includes those primarily focused on blockchain technology, and S3={d1,d5,d7,d8} includes those primarily focused on business management. After conducting the P-MIP DEA-DA model, d6 and d10 are adjusted to the second group and d9 is transferred to the third group. The decision to adjust the categorization of certain stakeholders was made based on an analysis of their viewpoints and characteristics. While these stakeholders originally had a background in supply chain management, their expressed viewpoints demonstrated similarities to members of the blockchain and business management groups. Therefore, to ensure a more accurate representation of their perspectives, it was deemed appropriate to adjust their categorization.
Step 5 Sorting of classification results:
The final classification results of the P-MIP DEA-DA model are G1*={d2,d12},G2*={d3,d4,d6,d10,d11,d13}, and G3*={d1,d5,d7,d8,d9}. The full classification process is shown in Fig. 8.
Identifying the intensity of the barriers to blockchain adoption in SSCs
This section aims to identify the intensity of the barriers to blockchain adoption. To do so, we evaluate the CL of three stakeholder groups and aggregate the opinions of all stakeholders.
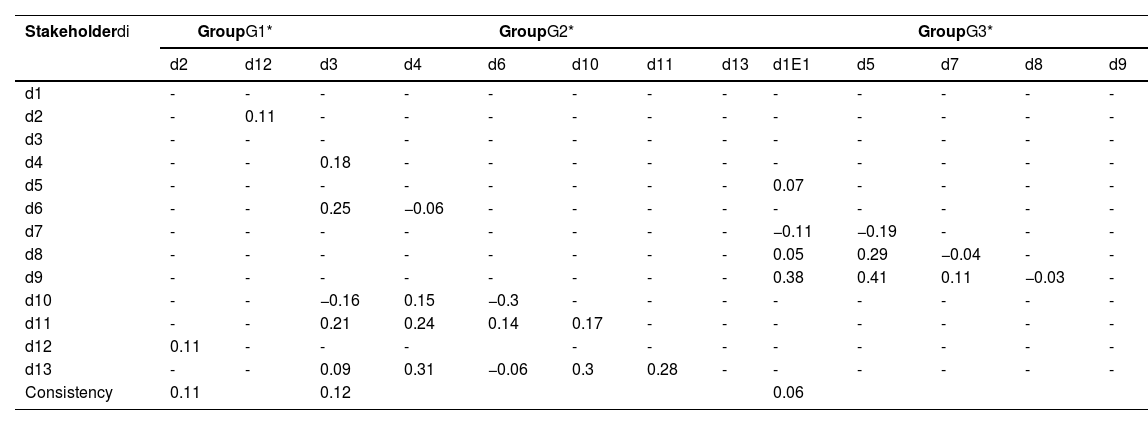
Consensus. We use the CL function in Eq. (12) to obtain the consistency between each set of two stakeholders in the same group. We use Eq. (15) to calculate the CLs of G1*,G2*, and G3*, as shown in Table 10.
The consensus levels of individual samples and groupsG1*,G2*, and G3*.
We assess the consensus level by consulting stakeholders in the field of decision-making and find that the consensus levels displayed above are satisfactory. The next step is to aggregate stakeholder opinions, which includes both intra- and inter-group aggregation.
- (1)
Intra-group aggregation. In Step 5.3, stakeholders are clustered into three groups: G1*,G2*, and G3*. Then, we utilize the QA function to obtain the intra-group aggregated opinions. Fig. 9 (shown in Appendix A) shows the probability distributions of the intra-group aggregated opinions. Table 11 shows the mean of the aggregated probability distributions of the three groups.
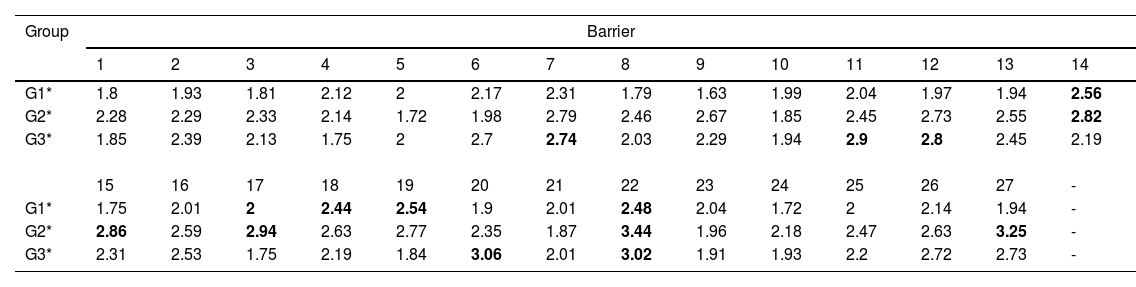
Table 11.The means of the aggregated probability distributions of the three groups.

Table 11 shows the aggregated opinions of G1*,G2*, and G3*, whose industry backgrounds are supply chain management, blockchain, and business management, respectively. According to the stakeholders in the field of supply chain management, the five most significant barriers to blockchain adoption are the lack of support from corporate executives, market uncertainty, data security, and a lack of consensus among stakeholders. According to the stakeholders in the field of blockchain technology, the five most significant barriers to blockchain adoption are data security, data immutability, the lack of professional talent, a resistance to new technology adoption and the lack of support from corporate executives. According to the stakeholders in the field of in business management, the five most significant barriers to blockchain adoption are privacy breaches, data security, high information sharing costs, energy consumption, and high maintenance and administration costs. An important finding is that all stakeholder groups share a common belief in the urgent need for data security. The absence of support from corporate executives is perceived as the most severe barrier by stakeholders in both the supply chain management and blockchain technology groups. Stakeholders in both the blockchain technology and business management groups underscored the significance of the high maintenance and administration costs of blockchain-based systems.
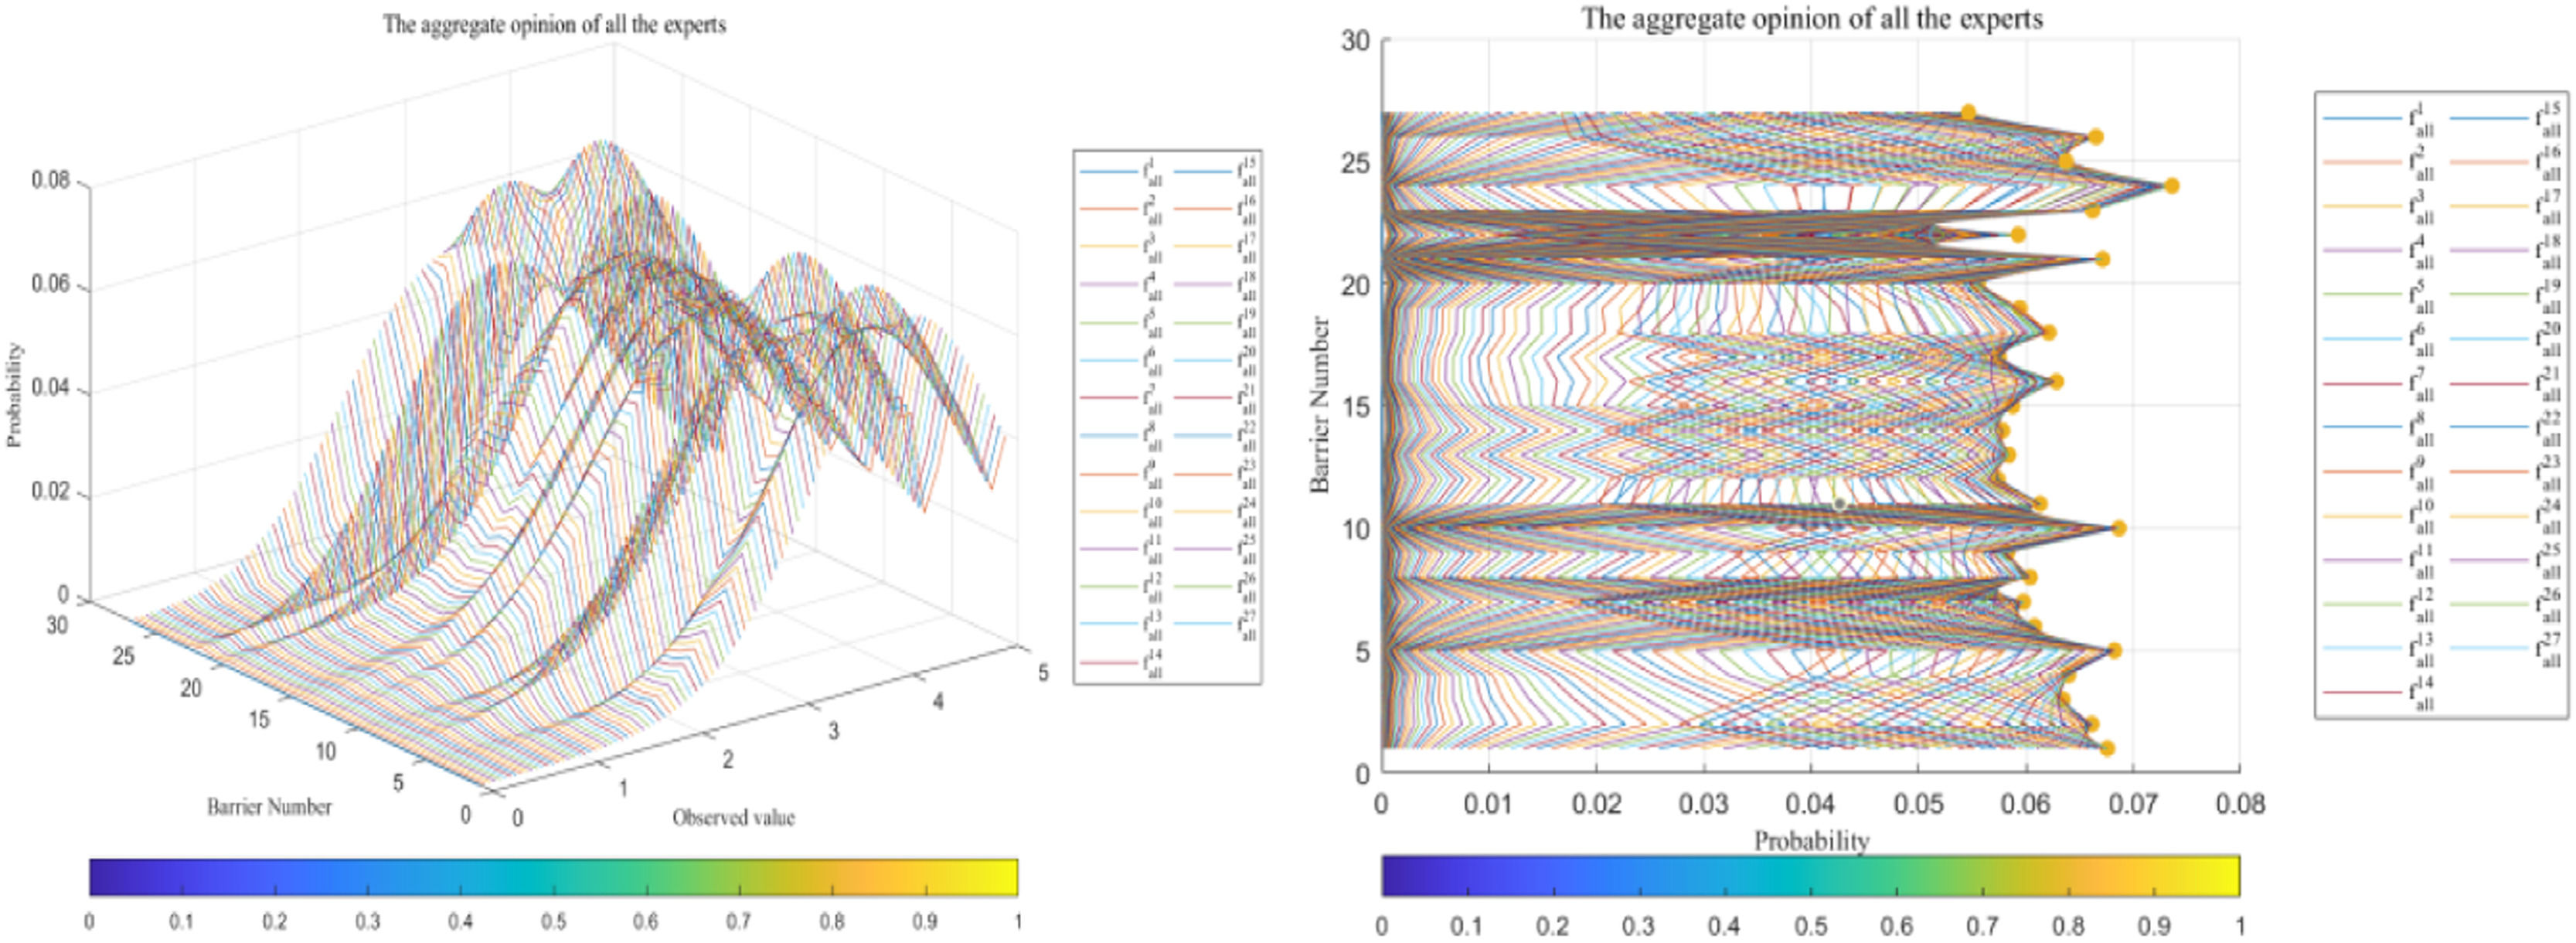
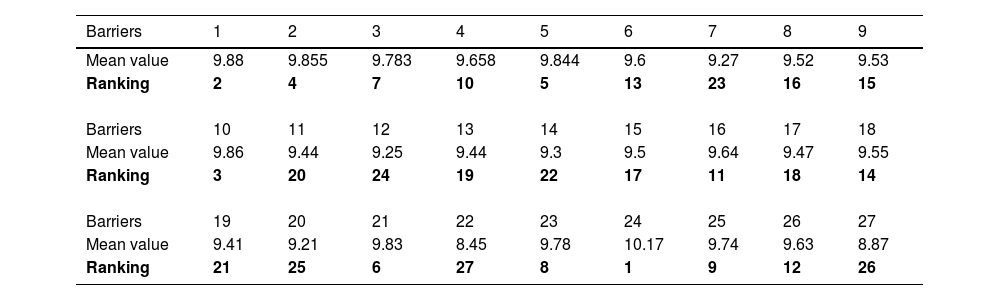
Inter-group aggregation. Based on the intra-group results, we utilize the QA function to obtain the aggregated inter-group opinions, which also represent the final decision of the group. Fig. 10 shows the probability distributions of all opinions in the group. Table 12 shows the mean of all PDFs.

The means of the aggregated probability distributions of multiple stakeholder opinions
The parameters and estimated weights of barriers in the first-phase classification.
The cyclic classification results of stakeholders in the first-phase classification.
Probability matrix of samples from S1′ and aggregated probability matrix of S2′ and S3′
The parameters and estimated weights of barriers in the second-phase classification.
We obtain the priority ranking of the barriers to blockchain adoption in SSCs from the means of the aggregated opinions from 13 stakeholders, as shown in Table 12. The five most severe barriers to blockchain adoption are Tech_24, Pol_1, Eco_10, Pol_2, Pol_5.
Conclusions and discussionPractical implicationsThe adoption of blockchain in SSCs faces significant resistance. In this paper, a thorough literature review was conducted to first identify the barriers to blockchain adoption. These barriers were then categorized into different dimensions, namely, political, economic, environmental, social, and technological barriers, in accordance with the proposed PEEST framework. Moreover, this study is the first to analyze the intensity of the barriers to blockchain adoption in the SSC context. By doing so, this research provides valuable insights and reference material for both practitioners and policymakers in overcoming and eliminating the barriers that impede the adoption of blockchain technology in SSCs.
The five most severe barriers to blockchain adoption are: (1) storage constraints (Tech_24), (2) the lack of economic incentives (Pol_1), (3) high integration costs (Eco_10), (4) the lack of sustainability guidelines (Pol_2) and (5) the lack of regulations on data sharing (Pol_5).
The most prominent barrier to blockchain adoption is storage constraints (Tech_24). Enterprises in SSCs often handle large transaction volumes and thus face substantial storage requirements. The storage capacity of a blockchain-based system directly impacts the operating efficiency of SSCs, thus making it a critical concern. The second major barrier is the lack of economic incentives (Pol_1). The government has strong control over the allocation of social resources. Economic incentives can not only enhance stakeholders’ confidence in blockchain-based solutions, but also make them more financially viable. The third barrier is the high integration costs of blockchain (Eco_10). Incompatibility between traditional systems and blockchain technology poses significant challenges and incurs additional costs during integration. This barrier highlights the need for seamless compatibility and interoperability between blockchain technology and legacy systems. The lack of sustainability guidelines (Pol_2) is another significant barrier that casts doubt on the potential benefits offered by blockchain. Furthermore, the lack of regulations or laws regarding data sharing (Pol_5) is a crucial concern for practitioners, which is consistent with previous studies conducted by Liu et al. (2021) and Tseng et al. (2013).
Official policies play a crucial role in promoting the use of blockchain in SSCs. The barriers Tech_24 and Eco_10 also have policy implications as the challenges they pose can be addressed through proactive economic policy support. These findings emphasize the role of governments as catalysts in blockchain implementation. Governments can stimulate innovation and investment in blockchain technology by offering economic incentives, establishing demonstration projects, and implementing effective data governance measures. Enterprises, on the other hand, should prioritize the development of blockchain-related technologies, including expanding storage capacity, integrating systems, and enhancing data management capabilities. Ultimately, a collaborative approach between governments and enterprises is essential for successful blockchain implementation in SSCs.
Theoretical implicationsFirst, this paper constructed the PEEST framework to identify the barriers to blockchain adoption in the SSC context. Second, this paper constructs an expertise-based GDM model to evaluate the intensity of the barriers to blockchain adoption in SSCs. Our work classifies expertise according to two dimensions—hesitancy and preference—and constructs the expertise-based GDM model to identify the barriers that impede the implementation of blockchain in SSCs. Moreover, the proposed expertise-based GMD model is based on probabilistic preference, which provides a reference for the probabilistic preference information aggregation method, which remains under researched.
Third, this study contributes to the literature on blockchain implementation in SSCs and GDM model design. Several scholars have explored the challenges of the use of blockchain in SSCs. The most relevant study (Kouhizadeh et al., 2021) identified 22 barriers to blockchain adoption using the technology–organization–environment framework and DEMATEL to analyze the causal relationships between them. Supply chain and technological barriers have been found to be the most critical barriers by both academics and industry experts. This article supplements the findings of Kouhizadeh et al. (2021) by discussing the intensity of the barriers to blockchain adoption. Regarding GDM model design, existing models have primarily focused on handling vague or ambiguous information, often utilizing fuzzy logic techniques to do so (e.g., Cabrerizo et al., 2010; Chen et al., 2012; Herrera & Herrera-Viedma, 2000). Probabilistic information has an advantage in the expression of imprecise information. However, there are few studies related to GDM model design under probabilistic preference. Our work does so by considering individual differences among decision-makers. Thus, this study makes novel contributions to the literature by extending the understanding of the barriers to blockchain adoption in SSCs from a multistakeholder perspective and by providing a novel approach to GDM model design that incorporates probabilistic preference.
Limitations and future researchDespite its contributions, there are several limitations in this study. First, the barriers are based on a review of the existing literature. Thus, the set of barriers may not be comprehensive. Future studies are therefore encouraged to further supplement the barriers to blockchain adoption using the PEEST framework. By engaging with a wider range of stakeholders, a more comprehensive understanding of the barriers can be achieved.
Second, the small number of stakeholders limits the generalizability of the results. The scarcity of individuals with expertise in blockchain makes it difficult to collect a large dataset. In the future, it will be beneficial to conduct a social network-based review of blockchain adoption in SSCs to include a wider range of analyzable data.
Third, exploring the impact of the relationships among the various stakeholders in SSCs is an important area for future research. Understanding how these relationships influence stakeholders’ decision-making processes can provide valuable insights and contribute to a more comprehensive understanding of the factors influencing the successful adoption of blockchain in SSCs.
CRediT authorship contribution statementZhu-Jun Wang: Conceptualization, Methodology, Data curation, Project administration, Writing – original draft, Writing – review & editing. Zhen-Song Chen: Conceptualization, Methodology, Software, Data curation, Project administration, Funding acquisition, Writing – original draft, Writing – review & editing. Lu Xiao: Writing – review & editing. Qin Su: Supervision, Writing – review & editing. Kannan Govindan: Writing – review & editing. Miroslaw J. Skibniewski: Writing – review & editing.
CRediT authorship contribution statementZhu-Jun Wang: Conceptualization, Methodology, Data curation, Project administration, Writing – original draft, Writing – review & editing. Zhen-Song Chen: Conceptualization, Methodology, Software, Data curation, Project administration, Funding acquisition, Writing – original draft, Writing – review & editing. Lu Xiao: Writing – review & editing. Qin Su: Supervision, Writing – review & editing. Kannan Govindan: Writing – review & editing. Miroslaw J. Skibniewski: Writing – review & editing.
This work was supported by the National Natural Science Foundation of China (Grant Nos. 72171182, 71902041, and 72031009), the National key research and development program of China (Grant no. 2019YFB1704100).
The appendix section includes Tables 4-8 and Fig. 9.
https://www.alibabacloud.com/zh/product/baas
https://technode.com/2021/08/03/tencent-launches-nft-platform-a-local-chinese-court-builds-judicial-blockchain-blockheads/