


The actors and components of an entrepreneurial ecosystem coexist and interact continuously, leading to many mutual relationships. Existing studies favour a static approach to the investigation of innovation ecosystems, frequently neglecting the chains of connections between ecosystem domains and business results. This study attempts to fill this gap by studying the causality connections within innovation ecosystems, with a specific focus on the mutual causal links between ecosystem domains and entrepreneurial outcomes. Our empirical analysis is grounded in ecosystem archetypes centred on the entrepreneur, thus emphasising the centrality of the entrepreneur and their capability to absorb, capture, and exploit the surrounding ecosystem. Econometric models attempt to cope with the endogeneity issue and are estimated using the PSED II dataset. We find that ecosystem domains can be placed on a spectrum. This ranges from those with a direct influence on the desirable target of transforming a nascent entrepreneur into a new firm or on the decision to quit business projects to those exerting an indirect influence on the transition to a new firm in the form of higher-order connections among domains.
The surge in policy interest in entrepreneurship has supported the idea of the entrepreneurial ecosystem as an archetype for designing entrepreneurship strategies, particularly for new technology-oriented ventures (Alkharafi, 2024). Several authors (Cohen, 2006; Vogel, 2013) have suggested that the environment contributes significantly to the decision-making process in establishing new firms. The ecosystem surrounding entrepreneurs considerably affects the survival, growth, and success of new ventures (Corvello et al., 2023; Saddle Primario et al., 2024; Suresh & Ramraj, 2012).
Nevertheless, despite the emergence of innovation ecosystems as a popular concept to explain the dynamics of entrepreneurship within regions, issues related to the effective governance of ecosystems and the relationships among the different agents involved are still underdeveloped (Moradi et al., 2024). To date, researchers who study innovation ecosystems are inclined to focus on identifying ecosystems and their primary attributes. Previous studies (Acs et al., 2014; Isenberg, 2011; Spigel, 2015; Stam, 2015) have sought to isolate the key factors in creating and sustaining an entrepreneurial ecosystem. These include highly skilled workers, early-stage investments from angel investors, follow-up investments from venture capitalists, professional and infrastructural services, formal (government policies) and informal (cultural support) institutions that enable entrepreneurship, and access to customers in domestic and foreign countries. Conversely, we know comparatively less about how different ecosystem domains influence entrepreneurial outcomes and how, in turn, the success (or lack thereof) of entrepreneurial outcomes may shape ecosystem evolution (Primario et al., 2024). Indeed, without a clear understanding of the interplay between elements of ecosystem and business results, innovation ecosystems risk being considered a conceptual ‘box’ embracing a variety of different perspectives on the geography of entrepreneurship rather than a coherent theory (Spigel, 2015). Moreover, the lack of evidence on the causality nexus between ecosystems and entrepreneurial outcomes weakens the opportunities to efficiently govern innovation ecosystems themselves (Haki et al., 2024; Priyono & Hidayat, 2024; Zhang et al., 2024).
This study fills this gap by examining the role of innovation ecosystem domains in the evolution of nascent entrepreneurs. The central tenet of our work is that given the inherently endogenous relationship between innovation ecosystems and successful entrepreneurship (Moradi et al., 2024; Stam, 2015), new firm creation and successful nascent entrepreneurs are not only a result of the system but also play a key role in creating and leading the development of the system itself. Accordingly, we propose a pattern to enhance the holistic governance of innovation ecosystems that leverages the knowledge of processes through which ecosystem domains influence entrepreneurial outcomes, either favourably or unfavourably, as well as how entrepreneurial outcomes, over time, feed back into the ecosystem within dynamic interconnections. Specifically, starting from a conceptual archetype of the entrepreneurial ecosystem based on Isenberg (2011), we empirically document which domain causes the evolution of nascent entrepreneurs, either positively, with development into a new firm or negatively, due to the decision to quit the business project. Furthermore, taking inspiration from the endogenous process of co-creation between ecosystem evolution and entrepreneurial outcomes suggested by Zhang et al. (2024), and Sjödin et al. (2024): Stam (2015), we argue that an inverse relationship is also in place and empirically test the effect entrepreneurial outcomes play on the ecosystem.
To disentangle these complex relationships, we conducted an empirical study following two methodological assumptions.
First, recent investigations of entrepreneurial absorptive capacity extend a firm's ability to access and assimilate new external knowledge (Cohen & Levinthal, 1990; Zahra & George, 2002) to individuals’ ability to recognise and exploit opportunities. Specifically, Qian and Acs (2013) define entrepreneurial absorptive capacity as an entrepreneur's ability to understand new knowledge and subsequently commercialise it by creating a new firm. Similarly, the knowledge spillover theory of entrepreneurship (Acs et al., 2009; Audretsch, 1995; Audretsch & Lehmann, 2005; Braunerhjelm et al., 2010; Ghio et al., 2015) indicates the key role of the entrepreneur in exploiting spillover opportunities based on knowledge created from R&D, with particular reference to high-tech ventures. In this sense, the entrepreneur is the missing link between new knowledge creation and its utilisation through new firm creation. Our first methodological assumption generalises the perspective of the literature and adapts it to entrepreneurial ecosystem archetypes centred on the entrepreneur. An inevitable implication is that the list of actors/components (e.g., laws, banks, universities, societal norms, etc.), with their interconnections, objectively exists in an environmental context. Still, they become an entrepreneurial ecosystem owing to the entrepreneur's subjective ability to recognise the value and exploit what is surrounding them and their business activity.
The second methodological assumption relies on the argument that the entrepreneurial capability to acquire and exploit knowledge or resources is path-dependent. Experience and learning on the job influence the development of future acquisition capabilities (Cohen & Levinthal, 1990; Zahra & George, 2002). Therefore, in our empirical study, we adopt a longitudinal perspective to observe the evolution of ecosystem domains over time, as well as to follow entrepreneurial development and outcomes. This intertemporal perspective allows us to disentangle the causality nexus between ecosystem domains and entrepreneurial outcomes, using the innovation ecosystem's history as a valid instrument to account for endogeneity in our econometric models.
The data for the empirical analysis come from the Panel Study of Entrepreneurial Dynamics (PSED II) managed by the University of Michigan, which offers a longitudinal study on 1214 nascent entrepreneurs. We followed the evolution and development of their businesses over four years.
Using the PSED II questionnaire, we designed and scored six main Isenberg domains: Policy, finance, human capital, markets, culture, and support. We designed three econometric models to explain i) which domain and how it affects the probability that a nascent entrepreneur develops into a new firm, ii) which domain and how it influences the decision of the entrepreneur to quit the nascent business, and iii) how entrepreneurial outcomes affect the ecosystem. Our main findings indicate that the transformation of a nascent venture into a new firm is activated by the tendency to formalise the business, the intensity of the use of external financing sources, and the professional support offered by managers, accountants, and lawyers. Conversely, decisions to quit a prospective venture are curbed by the level of nascent entrepreneurs’ education, degree of formalisation of the business, access to external financial sources, and availability of informal capital–capital provided by relatives and friends. The Policy, Finance, and Support domains appear to be strengthened by positive entrepreneurial outcomes (transformation into a new firm), thus showing a reinforcing loop of co-evolution (Alkharafi, 2024).
Our estimations provide evidence of higher-order causality paths between ecosystem domains and entrepreneurial outcomes, identifying the indirect influence each domain may exert on entrepreneurial results through its direct influence on another domain. For example, the targeting of innovative markets or the support offered by owners stimulates the entrepreneur to hire professionals with technical skills, which, in turn, has been proven to stimulate the transition to a new firm (Alkharafi, 2024). In addition, the support offered by owners stimulates the tendency to formalise the business, which has been proven to be particularly beneficial for the evolution of a nascent venture, as it supports the transition into a new firm and reduces decisions to quit.
This study makes two primary contributions to address these issues. First, it shifts the focus of ecosystem studies from a predominantly macro-level analysis to a micro-level perspective that centres on the entrepreneur. While prior research has largely emphasised identifying the key factors of ecosystems, it has often overlooked how entrepreneurs engage with and utilise the resources and opportunities available within their ecosystems. Aligning with the entrepreneurship literature and the biological metaphor of ecosystems, this study highlights that the mere existence of external resources holds limited value unless entrepreneurs are aware of these resources and actively choose to exploit them. This approach enables the formulation and assessment of targeted policy interventions to enhance entrepreneurial outcomes.
Second, while previous studies of innovation ecosystems have primarily concentrated on identifying the essential components and attributes of successful ecosystems, they often lack a clear analysis of the interactions among ecosystem constituents and the relationships between these components and entrepreneurial outcomes. This study advances the literature by examining these causal pathways and addressing their endogenous relationships. Considering both the direct (first-order) and indirect (higher-order) effects of ecosystem domains on entrepreneurial outcomes, we advocate a holistic approach to ecosystem governance. This approach facilitated the evaluation of policy measures within a systemic framework. For instance, investing in educational programs to enhance the skills of supporting professionals (e.g., managers, lawyers, and accountants) may yield dual benefits. These not only provide high-quality support for entrepreneurs transitioning to new ventures but also foster improved access to external financing, another critical component of the ecosystem that accelerates the process of new firm creation.
The remainder of this paper is organised as follows. In the next section, we provide a conceptual background of the literature and develop the research questions. Section 3 defines the methodology, including a description of the data, presentation of methodological assumptions, and variables. Section 4 presents the econometric specifications of the models. Section 5 presents the findings obtained from the estimations, and Section 6 discusses them from the perspective of governance. Section 7 concludes.
Conceptual backgroundThe term ‘innovation ecosystem’ has gained increasing scholarly interest over the past years; however, the understanding of its structure and importance for adequate governance mechanisms is still limited (Ferreira & Teixeira, 2019).
James Moore originally coined the term ‘ecosystem’ in an influential article in the Harvard Business Review published during the 1990s. He claimed that businesses do not evolve in a ‘vacuum’ and noted the relationally embedded nature of how firms interact with suppliers, customers, and financiers (Moore, 1993). More recently, an entrepreneurial ecosystem has been defined as ‘an interactive community within a geographic region, composed of varied, inter-dependent, and interconnected actors both potential and existing (e.g., entrepreneurs, institutions, and organisations) and factors (e.g., markets, regulatory framework, support setting, entrepreneurial culture), which evolves over time and whose actors and factors coexist and formally and informally interact to promote new venture creation within the local entrepreneurial environment’ (Vogel, 2013, p. 446). Van de Ven (1993) defined innovation ecosystems as a set of interdependent components which interact to generate new ventures over time. In dynamic innovation ecosystems, new firms have better opportunities to grow and create employment than firms in other locations (Rosted, 2012). Prahalad (2005) defined an entrepreneurial ecosystem as one which enables individuals, firms, and society to combine effectively to generate economic wealth and prosperity. Bernardez (2009) defines the entrepreneurial ecosystem as the ‘engine’ behind all fast-growing economies, characterised by small, nimble, and innovative firms. Frequently, start-ups or large firm spinoffs create innovation and bring it to the market quickly and efficiently. Others (Iansiti & Levien, 2004; Spilling, 1996) suggest that innovation ecosystems represent a diverse set of interdependent actors within a geographic region that influences the formation and eventual trajectory of the entire group of actors and, potentially, the economy as a whole. From this literature, we understand that many authors theorise the concept of an entrepreneurial ecosystem as something geographically concentrated in specific regions, cities, neighbourhoods, and even buildings. The main reason for this is that resources tend to be concentrated locally and attract each other: Humans, capital, information, and markets tend to gravitate to one another. This is especially true for knowledge-based firms, where knowledge spillovers are stronger at the local level (Audretsch & Lehmann, 2005). Bonaccorsi et al. (2014) argue that prospective entrepreneurs’ ability to incorporate and transform codified university knowledge into new ventures is negatively affected by the distance from the universities producing it. Similarly, Ghio et al. (2016) pointed out that geographical proximity shapes the impact of university knowledge on the creation of innovative start-ups. Similarly, the regional innovation systems (RIS) literature emphasises the role of localised systemic factors in facilitating knowledge development in local firms (Asheim & Coenen, 2005; Cooke, 2001; Cooke & Morgan, 1998; Lundvall, 1992). Much of the new work on innovation ecosystems strongly corresponds with the RIS literature, especially focusing on the relational elements within regions which govern innovation and entrepreneurship (Bathelt et al., 2004). Although the shortest path for creating this virtuous cycle has been conceived and addressed for a geographically concentrated ecosystem, this approach is likely to restrict the point of observation. The boundaries of a system of business enterprises are represented by the boundaries of the resources and competence networks that are activated (Dagnino, 1999) and are likely not always locally embedded. Related to this issue, innovation ecosystems have been treated so far as ‘exogenous’ entities that provide equal benefits to all entrepreneurs regardless of their specific characteristics, capabilities and embeddedness within the region. This implies that the ecosystem itself is a sufficient condition for successful enterprises in a region. However, previous research in areas such as knowledge spillover suggests that the background of entrepreneurs and the attributes of their businesses may influence how they engage with opportunities provided by the environment. Firms must have an adequate ‘absorptive capacity’ to capture and deploy knowledge from external sources (Cohen & Levinthal, 1990; Zahra & George, 2002). In the specific case of university knowledge, Colombo et al. (2010) show that universities producing high-quality scientific research have a positive impact on the growth of local firms only if these firms are able to detect, absorb, and use this knowledge. More recently, Qian and Acs (2013, p. 191) extend the application of absorptive capacity to entrepreneurs as an entrepreneur's ability to understand new knowledge, recognise its value, and subsequently commercialise it by creating a new firm. We adopt this concept theorised for knowledge-based firms and extend it to nascent entrepreneurship in both the high-tech and low-tech sectors. Therefore, absorptive capacity is interpreted as the skill of a nascent entrepreneur in capturing opportunities derived from their entrepreneurial ecosystem. In our entrepreneurial ecosystem approach, the entrepreneur rather than the enterprise is the focal point (Acs et al., 2014; Spigel, 2015; Stam, 2015).
Moreover, we analyse the connection between innovation, governance, and causality within ecosystems. We consider it to be a multifaceted and deeply intertwined field, reflecting how these factors shape and influence each other in complex environments such as businesses, societies, and natural systems (Zen et al., 2024). Innovation refers to the development of new ideas, products, processes, and models to enhance functionality, efficiency, and value. In ecosystems (whether biological, technological, or organisational), innovation often emerges as a response to challenges or opportunities, fostering growth and adaptability. For example, in ecosystems, innovation can take the form of new symbiotic relationships in natural systems, collaborative strategies or technologies in business ecosystems, and policies or mechanisms driving resource efficiency (Primario et al., 2024). Besides, it is important to highlight that governance refers to the frameworks, policies, and systems that guide behaviour, decision-making, and resource allocation within an ecosystem. It sets rules for collaboration, competition, and conflict resolution among ecosystem participants. In ecosystems, governance ensures a balance between the exploitation of resources and sustainability, fair distribution of benefits and responsibilities, transparency and accountability in decision-making processes, etc. Causality explores the relationships between causes and effects within an ecosystem (Wang et al., 2024). Understanding causality is essential to identify how specific factors (such as policies, innovations, and environmental changes) affect outcomes across interconnected systems (Baldwin et al., 2024). In ecosystems, causality manifests as feedback loops that involve positive feedback amplifying change (e.g., innovation spurring further innovations). In contrast, negative feedback stabilises systems (e.g., governance curbing excesses) and interdependencies, which are based on actions or changes in one part of the system that affect others (e.g., policy changes influencing market dynamics or environmental health). Therefore, the links among innovation, governance, and causality within ecosystems create a dynamic cycle of change and adaptation (Moradi et al., 2024; Sjödin et al., 2024; Zhang et al., 2024). Together, they shape the evolution of ecosystems by fostering growth, ensuring stability, and enabling informed responses to various challenges. To maintain resilience and sustainability, ecosystems must effectively balance these elements.
Drawing on these concepts, we propose a comprehensive conceptual framework that illustrates the direct (first-order) and indirect (higher-order) effects of ecosystem domains on entrepreneurial outcomes. Direct effects refer to the influence exerted by specific ecosystem domains on entrepreneurial outcomes. In contrast, indirect effects are associated with reciprocal interactions between the various ecosystem domains, which, in turn, impact entrepreneurial outcomes. Additionally, the model considers a potential feedback loop in which entrepreneurial outcomes may exert a retroactive influence on the ecosystem itself. A simplified graphical representation of these multifaceted effects and their interconnections is shown in Fig. 1.

We innovate on a previous perspective on innovation ecosystems by measuring the dimensions of each ecosystem domain based on the subjective/individual exploitation realised by the entrepreneur. The use of information on the environment surrounding a nascent entrepreneur, as provided by the entrepreneur, complements and enriches traditional metrics proposed to measure ecosystem domains that are essentially based on the view of the ecosystem as external (non-entrepreneur-specific). This makes it easier to identify bottlenecks and weaknesses that may prevent the success of new businesses. Moreover, the development of metrics centred on the entrepreneur allows for flexibility and comparability in assessing the specific domains of innovation ecosystems, as well as the possibility of longitudinally following their progression through data collection periods.
Based on these premises, our conceptual framework and methodological assumptions allowed us to set the first two research questions for our empirical analyses.
RQ1
Among the ecosystem domains, which one, and how, causes a nascent entrepreneur to become a new firm?
RQ2: Among the ecosystem domains, which one causes a nascent entrepreneur to decide to quit their business project, and how?
Empirical studies on these issues are still in the nascent stages. Quantitative approaches, such as Acs et al. (2014) and Guzman and Stern (2015), focus on linking outcomes, such as the number of high-growth firms or firm survival, with specific inputs, such as economic structures or particular support policies. Qualitative approaches, such as Spigel (2015), employ in-depth interviews with entrepreneurs to outline the process through which innovation ecosystems develop and support entrepreneurs. However, the influence that the outcome of entrepreneurship, either positive or negative, may have on the evolution of the surrounding environment is often neglected at both theoretical and empirical levels. This suggests that an entrepreneurial ecosystem is not a monolithic entity but a dynamic system of relationships that affects but is also affected by the entrepreneurial path of development.
Therefore, based on the above discussion, we set the third research question:
RQ3
What effect do entrepreneurial outcomes subsequently play on the ecosystem itself?
MethodologyDataThe data for the empirical analysis comes from the Panel Study of Entrepreneurial Dynamics (PSED) managed by the University of Michigan in the recent cohort PSED II. The PSED dataset and related codebooks are publicly available on the consortium website. PSED satisfies a set of requirements necessary for our empirical analysis: i) information on the environment surrounding a nascent entrepreneur is provided by the entrepreneur, consistent with our assumption that the entrepreneurial ecosystem is shaped by their awareness/exploitation of ecosystem domains; ii) nascent entrepreneurs are interviewed across time, meaning that it is possible to observe the exploitation of ecosystem across time, as well as the development of the nascent venture; iii) sampled interviewees share acceptable cultural proximity and a common regulatory/financial framework (the U.S. environment); however, simultaneously, the sample size is large enough to control for some heterogeneity of entrepreneurs.
A total of 1214 nascent entrepreneurs were identified for this longitudinal study and followed up at approximately one-year intervals to investigate the current status of their entrepreneurial efforts and update information about their venture. The 1214 nascent entrepreneurs are a unique subset of the entrepreneurial population characterised by their early stage, limited resources, and exploratory focus. Although they may be more prone to challenges and failures, they also represent the dynamic, innovative, and risk-taking aspects of entrepreneurship. The analysis of this dataset highlights the evolution of entrepreneurs as they gain experience, resources, and market traction. In addition, the selection of 1214 nascent entrepreneurs for this study can be considered the basis for developing exploratory research because it aims to uncover patterns, insights, and foundational knowledge in an area that may lack comprehensive prior studies.
To strengthen the study, three follow-up waves are considered in our analysis in order to balance a sufficiently long period to depict the evolution of the ecosystem across time, preserving an adequate number of entrepreneurs successfully contacted for additional interviews.
Methodological assumptionsAny ideal archetype for innovation ecosystems appears incomplete or inadequate to universally describe the multiple varieties of agents and elements surrounding an entrepreneur, interacting in complex ways and differently fitting into diverse geographic areas. For this reason, our analysis relies on a simplified representation of Isenberg (2011), who identified six domains within the entrepreneurial system: Conducive culture, enabling policies and leadership, availability of appropriate financing, quality human capital, venture-friendly markets for products, and a range of institutional and infrastructural support. Each ‘basic’ domain comprises hundreds of elements interacting in a highly complex and idiosyncratic way.
To disentangle causality nexuses among elements constituting an entrepreneurial ecosystem, we need to state an initial assumption: In a given ‘space-time’ condition, the list of agents/elements (e.g., laws, banks, universities, societal norms, etc.), with their interconnections, objectively exist as the environmental context in which any entrepreneur blooms. Nevertheless, this multifaceted entity becomes an entrepreneurial ecosystem thanks to the entrepreneur's subjective understanding and exploitation of what is surrounding them and their business activities. Briefly, the entrepreneurial ecosystem is individually captured and exploited by each entrepreneur based on their capability to identify and incorporate external resources; the same environment may be transformed into a strong or weak entrepreneurial ecosystem according to the subjective/individual ability to take advantage of each component of the ecosystem itself. Fig. 2 offers a simple representation of this assumption based on the six basic domains suggested by Isenberg (2011). The dimensions, quality, and efficacy of the ecosystem originate from the entrepreneur's knowledge and exploitation of the constituents of the IE.

As shown in Fig. 2, the knowledge and exploitation of each domain are expected to affect the entrepreneurial outcome (incoming black arrows). Still, it is also likely to be influenced by the evolution of the nascent business (outgoing black arrows). Moreover, we envisage that nascent entrepreneurs’ exploitation of the innovation ecosystem's resources is path-dependent, as prior experience in a domain (in t0) is likely to influence the assimilation and exploration of the same domain in the subsequent period (in t1). This intertemporal representation of the entrepreneurial ecosystem allows us to empirically disentangle the causal connections between ecosystem constituents and entrepreneurial outcomes, as well as among the elements of the innovation ecosystem.
VariablesFrom the PSED II archive, we selected specific pieces of information that describe the features of each of the six domains suggested by Isenberg (2011) and depicted in Fig. 2 as experienced by the interviewed nascent entrepreneur. Appendix 1 describes the specific items, scoring, and computation methods used to derive the variables employed in the empirical analysis. For the Human Capital Domain, we selected the Human Capital Domain (HC1) dimension to indicate the intensity of the use of skilled managerial devices as well as the availability of managerial capital, as deduced by dependency on existing businesses to which the nascent entrepreneur is related. The second dimension, the Human Capital Domain (HC2), indicates the level of education of the nascent entrepreneur and all other people involved in the business, such as other owners, key non-owners, and helpers. The Policy Domain here is intended as the degree of regulation of the business; therefore, we create a variable, Policy Domain (P), which is related to the level of institutional formalisation of the business as derived by the legal form of the business and entry into firm registries. The Finance Domain is observed along three dimensions: i) the intensity of external financial support provided by financial institutions or other professionals (Finance Domain, F1); ii) the amount of informal financial capital raised by the nascent entrepreneur, such as personal savings and personal loans from relatives, friends, employers, and colleagues (Finance Domain, F2); and iii) the amount of formal financial capital, that is, the financial capital raised by the nascent entrepreneur with the involvement of financial/banking debt instruments (Finance Domain, F3). The Supports Domain is divided into two dimensions: on the one hand, supports directly provided by owners in the form of financial assistance/advice, physical resources and business services (Supports Domain - S1); however, the presence of supporting professionals, such as managers, accountants or lawyers (Supports Domain - S2). The Markets Domain is considered, on the one side, as the degree of innovation of the product/service that the nascent entrepreneur believes is going to be perceived by their potential customers (Markets Domain - M1); on the other side, as the ‘inclination to local’ of the expected marketplace (Markets Domain - M2). Finally, the cultural domain is articulated in three sub-indicators: i) the presence of social norms favourable to entrepreneurship (Cultural Domain - C1); ii) the presence of personal motivation towards entrepreneurship as a source of freedom (Cultural Domain - C2); and iii) the presence of personal motivation towards entrepreneurship as a source of wealth (Cultural Domain - C3). Overall, the scoring procedure for ecosystem components resulted in 13 domain variables.
Most domain values/scores have been normalised within a 0–1 range, with the purpose of indicating, for each of them, a low (0) or high (1) intensity in the relative exploitation by the entrepreneur. F2 and F3 are dollar values transformed into logs in the multivariate analyses.
Investigating the causality nexus between the ecosystem and entrepreneurial outcomes requires the identification of business result typologies. The PSED II dataset indicates two alternative entrepreneurial states as a result of the initial condition of nascent entrepreneurs: Having completed the seeding period as a nascent venture, resulting in a well-defined new firm, and having abandoned involvement in the business, resulting in quitting the entrepreneurial venture. Thus, we define two typologies of business outcomes, positive and negative, which are assessed using binomial variables. In line with Hechavarria et al. (2011), we use nascent entrepreneur status as a referent category and compare this condition to those who successfully finalise their venture, and to those who give up the entrepreneurial initiative. Coherently, a positive entrepreneurial outcome is indicated by the variable NEW_FIRM, which is 1 for entrepreneurs who transformed their business into a new firm and 0 for those still living in a nascent entrepreneurship phase. The negative entrepreneurial outcome is assessed by the QUIT variable, which is 1 for those declaring to quit the business and 0 for those remaining.
A comprehensive list of eleven control variables was identified for inclusion in our multivariate analyses to address the inevitable heterogeneity of entrepreneurs. These controls comprise some personality traits of the nascent entrepreneur interviewed: PT1 is a dummy variable indicating a favourable attitude towards socialisation (PT1=1), or not (PT1=0); PT2 is a dummy variable indicating an emotional and extrovert attitude (PT2=1), or not (PT2=0); PT3 is a dummy variable indicating a reflective inclination (PT3=1), or not (PT3=0); PT4 is a dummy variable indicating an ambiguity propensity (PT4=1), or not (PT4=0); PT5 is a dummy variable indicating a tendency to generous and enthusiastic behaviours (PT5=1), or not (PT5=0). Moreover, we included information about the ‘micro-network’ of each nascent entrepreneur in terms of the number of contacts (other owners, key, not owners and helpers) involved in the new business (Net-Size), as well as in relation to the level of openness provided by the network as proxied by the number of businesses each owner owns or helped to start (Openness). Business typology and expected dimensions are also considered as controls: Retail cons-B is a dummy equal to 1 if the business is a retail consumer business and 0 otherwise; high-RD-B is a dummy with a value of 1 if the venture is a business with a priority in research and development and 0 otherwise; IT-B is a dummy equal to 1 if the business is an IT business and 0 otherwise. Finally, the region is a categorical variable for the geographical residence of interviewees, expressed in PSED II as four wide US regions (North-Center, South, West and East; the latter works as a reference category). Analysing regions while studying the innovation ecosystems exploited by nascent entrepreneurs is essential because regional factors define the opportunities, resources, and challenges available to them (Cunningham et al., 2024). A regionally informed approach provides actionable insights for policymakers, investors, and support organisations by fostering tailored strategies to nurture innovation and entrepreneurial success (Audretsch et al., 2024).
Econometric modelsWe empirically test the links between ecosystem domains and entrepreneurial outcomes to shed light on their mutual interconnections. Using econometric models, we design the evolution of both innovation ecosystem domains and business outcomes across time, considering the endogenous nature of their relationships.
In the sequence of models, we first explore how ecosystem domains affect both positive and negative entrepreneurial outcomes. We then explore the inverse relationship, that is, how entrepreneurial outcomes affect ecosystem domains. All models follow a panel structure jointly considering a cross-sectional comparison among individuals (i = 1–1214) within the time series of responses included in the follow-up waves of the PSED II (years, t = 1–4). We run a test for multicollinearity among variables before including them in the econometric models.
Note that when it is technically feasible, we privilege modelling simultaneous interconnections, which means observing entrepreneurial outcomes at the same time as features of ecosystem domains. Nevertheless, when entrepreneurs decide to quit a business project, we miss information on their updated evaluations of domains and are forced to use a different timeframe layout.
Modelling the role of ecosystem domains on positive entrepreneurial outcomeWe need to specify that nine out of 13 domain variables (D), described in Section 3.3, raise an endogeneity concern (endogenous domains, Dend), in the sense that they may affect, but also be affected by, the entrepreneurial outcome, while the remaining four can be considered exogenous (exogenous domains, Dexo) due to their nature and our observation timespan. Precisely, we consider exogenous the Education Domain (HC2) and the three variables related to the Culture Domain, i.e. social norms (C1) and entrepreneur motivation, for either ‘necessity for freedom’ (C2) or ‘expectation for wealth’ (C3). Given the yearly timeframe of the PSED II waves, we assume that these variables may influence outcomes as well as the remaining domains but are not likely to be influenced, in turn, within our four years of observation.
A 4-year time frame is sufficient to capture meaningful ecosystem evolution for several reasons, especially considering the dynamic and fast-paced features of entrepreneurial ecosystems. First, it helps to understand the rapid changes in technology and market trends. Technological advancements and market trends have evolved rapidly, often within a few years (Tula et al., 2024). For instance, the rise of green technologies can transform entrepreneurial opportunities within a short period. Second, entrepreneurs and start-ups tend to swiftly adapt to these changes, leading to noticeable shifts in ecosystems. Third, this framework is useful for analysing policy and institutional impacts. Governments and institutions often implement relationship-focused policies and funding programs with timelines of 2–5 years. Examples include startup accelerators, grants, tax incentives, and changes in regulations, which can lead to significant ecosystem changes within a 4-year period (Beyhan et al., 2024). These interventions often aim to stimulate activity, attract investment, or address ecosystem gaps. Lastly, the 4-year time frame clearly reflects the startup lifecycle; the lifecycle of a startup typically unfolds within a few years, from ideation and early growth to scaling, exiting, or quitting. Observing startups for over four years provides insights into ecosystem dynamics, such as support systems, funding availability, and market receptivity (Haki et al., 2024).
Indeed, a change in the educational background of entrepreneurs or a change in societal and cultural norms or motivations is likely to occur over a longer period.
For the positive outcome NEW_FIRM, we apply an instrumental variable (IV) model that preserves the simultaneous observation of the dependent and independent variables. To cope with the endogeneity dilemma, we implement a two-step estimation procedure. In the first step, we estimate the nine endogenous variables (Dendit) as explained by four exogenous variables (Dexoit), 11 controls (Cit), and instruments (Iit=Dendit- Dendit-1). To increase the stationarity of our instruments, we use the first difference (i.e. the period-to-period change) of the selected endogenous variables. In the second step, we set a probit model, where the binomial variable NEW_FIRM is explained by the vector of nine residuals (DRendit) of the first-step estimations and the same set of exogenous variables and controls. This model, reported in [1], explains how ecosystem domains affect the probability that a nascent entrepreneur will succeed in transforming into a new firm, taking into account the endogeneity problem.
Here, NEW_FIRMit is a binomial variable that, for each nascent entrepreneur at time t, is equal to 1 if the nascent venture is developed into a new firm and 0 if it is still a nascent venture; DRendit is the vector of the nine residuals resulting from estimations in the previous step; Dexoxt is the vector of four exogenous domain variables; Cit is the vector of 11 control variables, including personality traits, network size, openness, business typology, expected dimension, and region.Because of the estimation formalisation, all explanatory variables of [1] are included in a comprehensive vector M, and model [1] can be presented as follows:
Where Pr denotes probability, and Φ is the cumulative distribution function of a standard normal distribution. Parameters, indicated by the vector ρ, are estimated by maximum likelihood.Modelling the role of innovation ecosystem domains on the negative entrepreneurial outcomeAs anticipated, the relationship between ecosystem domains and the decision to quit cannot be explored simultaneously because of a lack of information on the innovation ecosystem's exploitation updated in the year in which the nascent entrepreneur decided to quit the business. To compensate for this absence, we model the effect of ecosystem domains on the likely decision to quit as follows.
Where QUITit is the binomial variable that, for each nascent entrepreneur at time t, is equal to 1 if the nascent entrepreneur has declared to have quit the business, and 0 if still in the nascent venture; Dit-1 and Cit-1 are the vectors including all 13 domain variables and 11 controls, evaluated at time t-1.As in [1bis], all the explanatory variables of [2] are included in a comprehensive vector N, and model [2] can be presented as follows:
Where Pr denotes probability, and Φ is the cumulative distribution function of a standard normal distribution. Parameters, indicated by the vector η, are estimated by maximum likelihood.Model [2] offers a simple solution to the causality issue because it relies on the reasonable assumption that what is ‘before’ causes what happens ‘afterwards’. The understandable lack of information on how entrepreneurs exploit ecosystems when abandoning a business induces us to design, with model [2], the influence of a preceding ecosystem, timet-1, on the probability that the entrepreneur will decide to quit the business in the following year, at timet.
Modelling the inverse influence of entrepreneurial outcomes on ecosystem domainsAt this stage, we must tighten the overall issue of causal paths and consider the inverse effects of entrepreneurial outcomes on ecosystem domains. As anticipated, these loops are reasonable for endogenous domain variables but not for exogenous ones, which are assumed to follow a long-term developmental process. Thus, we model how an entrepreneurial outcome affects a given endogenous domain variable, considering other ecosystem domains. Notably, by including the remaining ecosystem domains in the estimation, we obtain an ancillary but still critical empirical result that depicts any mutual interconnection among the ecosystem domains themselves. All these relationships need to be investigated simultaneously. Consequently, we can consider only the NEW_FIRM outcome and omit the QUIT case. Formally, there are j models with the following specifications:
Here, DDendit is the vector of nine endogenous domain variables used as the dependent variable (being explained) for nascent entrepreneur i at time t; Dendit is the vector of the remaining eight endogenous domain variables used as explanatory variables, i.e., all except the one being explained,; Dexoit and Cit are the exogenous and control variables used in [1]; α and ε are constant and error term, respectively.
The presence of endogeneity among the dependent and independent variables is managed by applying a two-step IV approach, similar to that described in model [1], and the second step is the regression of a continuous dependent variable. The evolution of endogenous domains–that is, their period-to-period change–works as an instrument (Iit) for the current realisation of the components of an innovation ecosystem, in line with the specifications of [1].
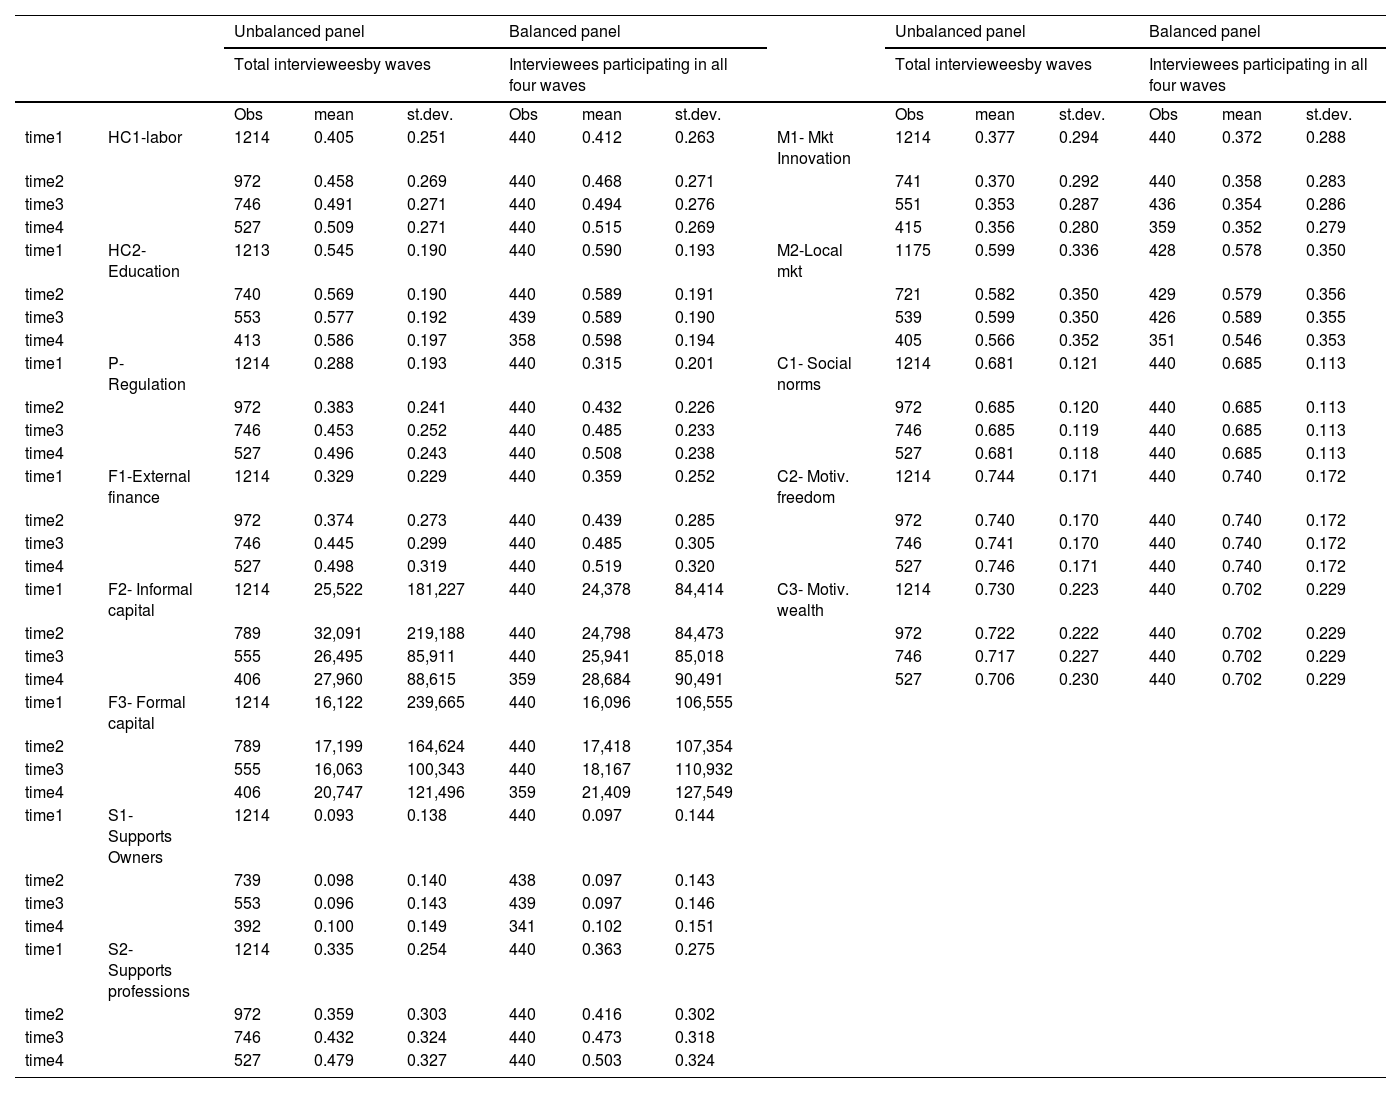
ResultsWhat causes a nascent enterprise to either bloom or quit?The summary statistics of our domain scores are shown in Table 1
Summary statistics of innovation ecosystem domain variables.
| Unbalanced panel | Balanced panel | Unbalanced panel | Balanced panel | |||||||||||
|---|---|---|---|---|---|---|---|---|---|---|---|---|---|---|
| Total intervieweesby waves | Interviewees participating in all four waves | Total intervieweesby waves | Interviewees participating in all four waves | |||||||||||
| Obs | mean | st.dev. | Obs | mean | st.dev. | Obs | mean | st.dev. | Obs | mean | st.dev. | |||
| time1 | HC1-labor | 1214 | 0.405 | 0.251 | 440 | 0.412 | 0.263 | M1- Mkt Innovation | 1214 | 0.377 | 0.294 | 440 | 0.372 | 0.288 |
| time2 | 972 | 0.458 | 0.269 | 440 | 0.468 | 0.271 | 741 | 0.370 | 0.292 | 440 | 0.358 | 0.283 | ||
| time3 | 746 | 0.491 | 0.271 | 440 | 0.494 | 0.276 | 551 | 0.353 | 0.287 | 436 | 0.354 | 0.286 | ||
| time4 | 527 | 0.509 | 0.271 | 440 | 0.515 | 0.269 | 415 | 0.356 | 0.280 | 359 | 0.352 | 0.279 | ||
| time1 | HC2-Education | 1213 | 0.545 | 0.190 | 440 | 0.590 | 0.193 | M2-Local mkt | 1175 | 0.599 | 0.336 | 428 | 0.578 | 0.350 |
| time2 | 740 | 0.569 | 0.190 | 440 | 0.589 | 0.191 | 721 | 0.582 | 0.350 | 429 | 0.579 | 0.356 | ||
| time3 | 553 | 0.577 | 0.192 | 439 | 0.589 | 0.190 | 539 | 0.599 | 0.350 | 426 | 0.589 | 0.355 | ||
| time4 | 413 | 0.586 | 0.197 | 358 | 0.598 | 0.194 | 405 | 0.566 | 0.352 | 351 | 0.546 | 0.353 | ||
| time1 | P-Regulation | 1214 | 0.288 | 0.193 | 440 | 0.315 | 0.201 | C1- Social norms | 1214 | 0.681 | 0.121 | 440 | 0.685 | 0.113 |
| time2 | 972 | 0.383 | 0.241 | 440 | 0.432 | 0.226 | 972 | 0.685 | 0.120 | 440 | 0.685 | 0.113 | ||
| time3 | 746 | 0.453 | 0.252 | 440 | 0.485 | 0.233 | 746 | 0.685 | 0.119 | 440 | 0.685 | 0.113 | ||
| time4 | 527 | 0.496 | 0.243 | 440 | 0.508 | 0.238 | 527 | 0.681 | 0.118 | 440 | 0.685 | 0.113 | ||
| time1 | F1-External finance | 1214 | 0.329 | 0.229 | 440 | 0.359 | 0.252 | C2- Motiv. freedom | 1214 | 0.744 | 0.171 | 440 | 0.740 | 0.172 |
| time2 | 972 | 0.374 | 0.273 | 440 | 0.439 | 0.285 | 972 | 0.740 | 0.170 | 440 | 0.740 | 0.172 | ||
| time3 | 746 | 0.445 | 0.299 | 440 | 0.485 | 0.305 | 746 | 0.741 | 0.170 | 440 | 0.740 | 0.172 | ||
| time4 | 527 | 0.498 | 0.319 | 440 | 0.519 | 0.320 | 527 | 0.746 | 0.171 | 440 | 0.740 | 0.172 | ||
| time1 | F2- Informal capital | 1214 | 25,522 | 181,227 | 440 | 24,378 | 84,414 | C3- Motiv. wealth | 1214 | 0.730 | 0.223 | 440 | 0.702 | 0.229 |
| time2 | 789 | 32,091 | 219,188 | 440 | 24,798 | 84,473 | 972 | 0.722 | 0.222 | 440 | 0.702 | 0.229 | ||
| time3 | 555 | 26,495 | 85,911 | 440 | 25,941 | 85,018 | 746 | 0.717 | 0.227 | 440 | 0.702 | 0.229 | ||
| time4 | 406 | 27,960 | 88,615 | 359 | 28,684 | 90,491 | 527 | 0.706 | 0.230 | 440 | 0.702 | 0.229 | ||
| time1 | F3- Formal capital | 1214 | 16,122 | 239,665 | 440 | 16,096 | 106,555 | |||||||
| time2 | 789 | 17,199 | 164,624 | 440 | 17,418 | 107,354 | ||||||||
| time3 | 555 | 16,063 | 100,343 | 440 | 18,167 | 110,932 | ||||||||
| time4 | 406 | 20,747 | 121,496 | 359 | 21,409 | 127,549 | ||||||||
| time1 | S1-Supports Owners | 1214 | 0.093 | 0.138 | 440 | 0.097 | 0.144 | |||||||
| time2 | 739 | 0.098 | 0.140 | 438 | 0.097 | 0.143 | ||||||||
| time3 | 553 | 0.096 | 0.143 | 439 | 0.097 | 0.146 | ||||||||
| time4 | 392 | 0.100 | 0.149 | 341 | 0.102 | 0.151 | ||||||||
| time1 | S2-Supports professions | 1214 | 0.335 | 0.254 | 440 | 0.363 | 0.275 | |||||||
| time2 | 972 | 0.359 | 0.303 | 440 | 0.416 | 0.302 | ||||||||
| time3 | 746 | 0.432 | 0.324 | 440 | 0.473 | 0.318 | ||||||||
| time4 | 527 | 0.479 | 0.327 | 440 | 0.503 | 0.324 | ||||||||
Note: This table reports the summary statistics of the ecosystem domain scores by comparing the two panels of survey participants. The first set of columns refers to the panel of interviewees (unbalanced panel) participating in each of the four waves without considering whether they skipped some of the waves over time. The second set of columns refers to the panel of interviewees (balanced panels) who regularly participated in all four waivers considered in our study. All ecosystem domain scores were normalised within a 0–1 range, except for F2–informal capital and F3–formal capital, which are dollar values. In the following estimations, these two variables are transformed into logs of their values.
Even if we offer statistics for both balanced and unbalanced panels of interviewees, in our estimations, we mainly focus on the balanced dataset, which is based on responses offered by subjects who regularly participated in the PSED II questionnaires over time. Table 1 shows that interviewees increasingly exploited some domains over time. Some domains seem to be producing this absorptive process, such as the P-Regulation, Finance, and Support domains, with a specific reference to the support offered by professionals, and finally, the Human Capital domain related to the labour component (HC1). As expected, both the education component (HC2) and the culture domain remained steady over time; this appears to be completely consistent with our decision to consider these domains as exogenous variables under the assumption that their development requires a period longer than the timeframe of our analysis.
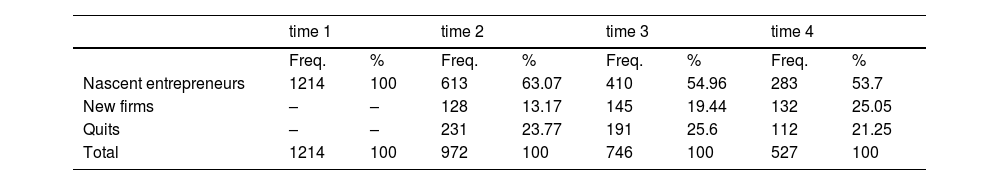
Entrepreneurial outcomes are briefly depicted in Table 2, which reasonably indicates a decreasing number of nascent entrepreneurs from the first year of observation (Time 1) to the last year (Time 4) as they either develop into a new firm or quit the project. If, after one year of observation (Time 2), decisions to quit appear dominant compared to the transition to a new firm in the last period (Time 4), the opposite becomes true.
The summary statistics of Tables 1 and 2 reveal the dynamicity of both the entrepreneurial ecosystem and outcomes, supporting the idea that the entrepreneurial ecosystem develops itself as a result of the entrepreneur's ability to capture and assimilate, over time, the innovation ecosystem's resources. Nevertheless, this evidence is insufficient to understand the direction of causality, which is consistent with the endogeneity problem proposed by Stam (2015) and Spigel (2015). Estimations of models [1], [2], and [3], as shown in Tables 3, 4, and 5, respectively, elucidate the causal paths between entrepreneurial outcomes and ecosystem domains.
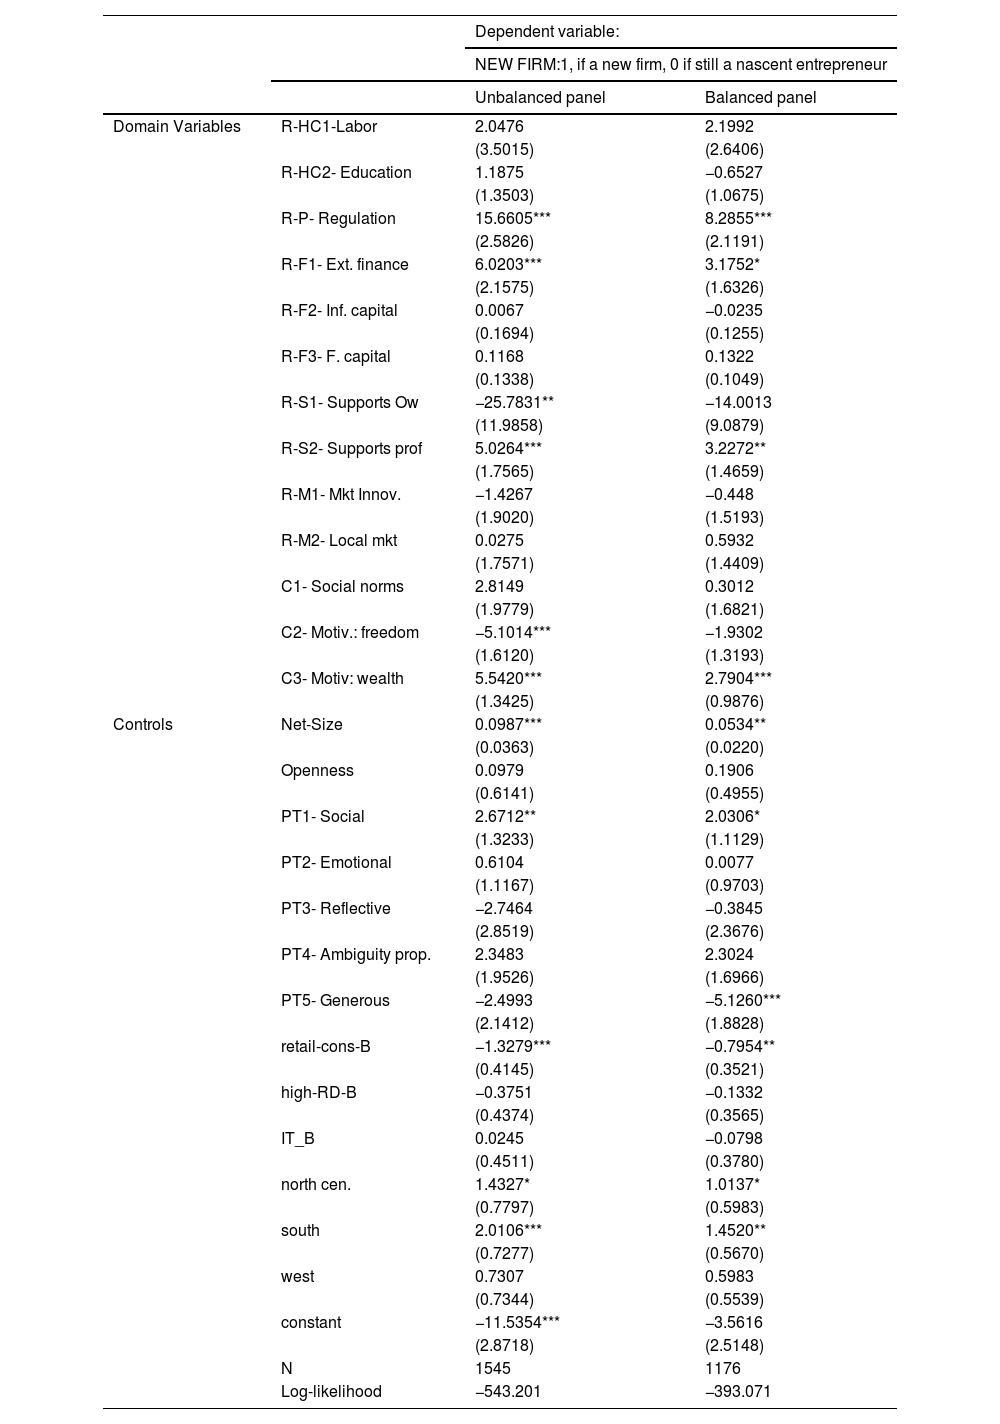
Probit estimations of Model [1].
| Dependent variable: | |||
|---|---|---|---|
| NEW FIRM:1, if a new firm, 0 if still a nascent entrepreneur | |||
| Unbalanced panel | Balanced panel | ||
| Domain Variables | R-HC1-Labor | 2.0476 | 2.1992 |
| (3.5015) | (2.6406) | ||
| R-HC2- Education | 1.1875 | −0.6527 | |
| (1.3503) | (1.0675) | ||
| R-P- Regulation | 15.6605*** | 8.2855*** | |
| (2.5826) | (2.1191) | ||
| R-F1- Ext. finance | 6.0203*** | 3.1752* | |
| (2.1575) | (1.6326) | ||
| R-F2- Inf. capital | 0.0067 | −0.0235 | |
| (0.1694) | (0.1255) | ||
| R-F3- F. capital | 0.1168 | 0.1322 | |
| (0.1338) | (0.1049) | ||
| R-S1- Supports Ow | −25.7831** | −14.0013 | |
| (11.9858) | (9.0879) | ||
| R-S2- Supports prof | 5.0264*** | 3.2272** | |
| (1.7565) | (1.4659) | ||
| R-M1- Mkt Innov. | −1.4267 | −0.448 | |
| (1.9020) | (1.5193) | ||
| R-M2- Local mkt | 0.0275 | 0.5932 | |
| (1.7571) | (1.4409) | ||
| C1- Social norms | 2.8149 | 0.3012 | |
| (1.9779) | (1.6821) | ||
| C2- Motiv.: freedom | −5.1014*** | −1.9302 | |
| (1.6120) | (1.3193) | ||
| C3- Motiv: wealth | 5.5420*** | 2.7904*** | |
| (1.3425) | (0.9876) | ||
| Controls | Net-Size | 0.0987*** | 0.0534** |
| (0.0363) | (0.0220) | ||
| Openness | 0.0979 | 0.1906 | |
| (0.6141) | (0.4955) | ||
| PT1- Social | 2.6712** | 2.0306* | |
| (1.3233) | (1.1129) | ||
| PT2- Emotional | 0.6104 | 0.0077 | |
| (1.1167) | (0.9703) | ||
| PT3- Reflective | −2.7464 | −0.3845 | |
| (2.8519) | (2.3676) | ||
| PT4- Ambiguity prop. | 2.3483 | 2.3024 | |
| (1.9526) | (1.6966) | ||
| PT5- Generous | −2.4993 | −5.1260*** | |
| (2.1412) | (1.8828) | ||
| retail-cons-B | −1.3279*** | −0.7954** | |
| (0.4145) | (0.3521) | ||
| high-RD-B | −0.3751 | −0.1332 | |
| (0.4374) | (0.3565) | ||
| IT_B | 0.0245 | −0.0798 | |
| (0.4511) | (0.3780) | ||
| north cen. | 1.4327* | 1.0137* | |
| (0.7797) | (0.5983) | ||
| south | 2.0106*** | 1.4520** | |
| (0.7277) | (0.5670) | ||
| west | 0.7307 | 0.5983 | |
| (0.7344) | (0.5539) | ||
| constant | −11.5354*** | −3.5616 | |
| (2.8718) | (2.5148) | ||
| N | 1545 | 1176 | |
| Log-likelihood | −543.201 | −393.071 | |
Note: This table reports the coefficients of probit regressions as the second step of our instrumental variable (IV) approach described in Model [1]. We followed a two-step estimation. In the first step, we estimated each endogenous variable (HC1-Labor, P-Regulation, F1-Ext. Finance, F2– Inf capital, F3– Formal capital, S1-Supports owners, S2-Supports prof, M1-Mkt innovation, M2-Local mkt) in relation to exogenous variables (HC2, Education; C1, Social norms; C2, Motiv.-freedom; C3, Motiv-wealth) and controls, plus the variables that we used as instruments: the first difference (period-to-period change) for each endogenous domain. The second step, which is shown in this table, is a probit (panel) estimation, where the dependent variable is NEW FIRM that is regressed against exogenous variables, controls and residual from the first step estimation. The first-stage estimations are omitted because they are instrumental in the second stage. The prefix R- before each domain variable (i.e., R-HC1-Labor) indicates that it is the residual from the first-step estimation. Detailed variable definitions are provided in the Appendix. ***, ** and * denote significance at the 1 %, 5 %, and 10 % level, respectively.
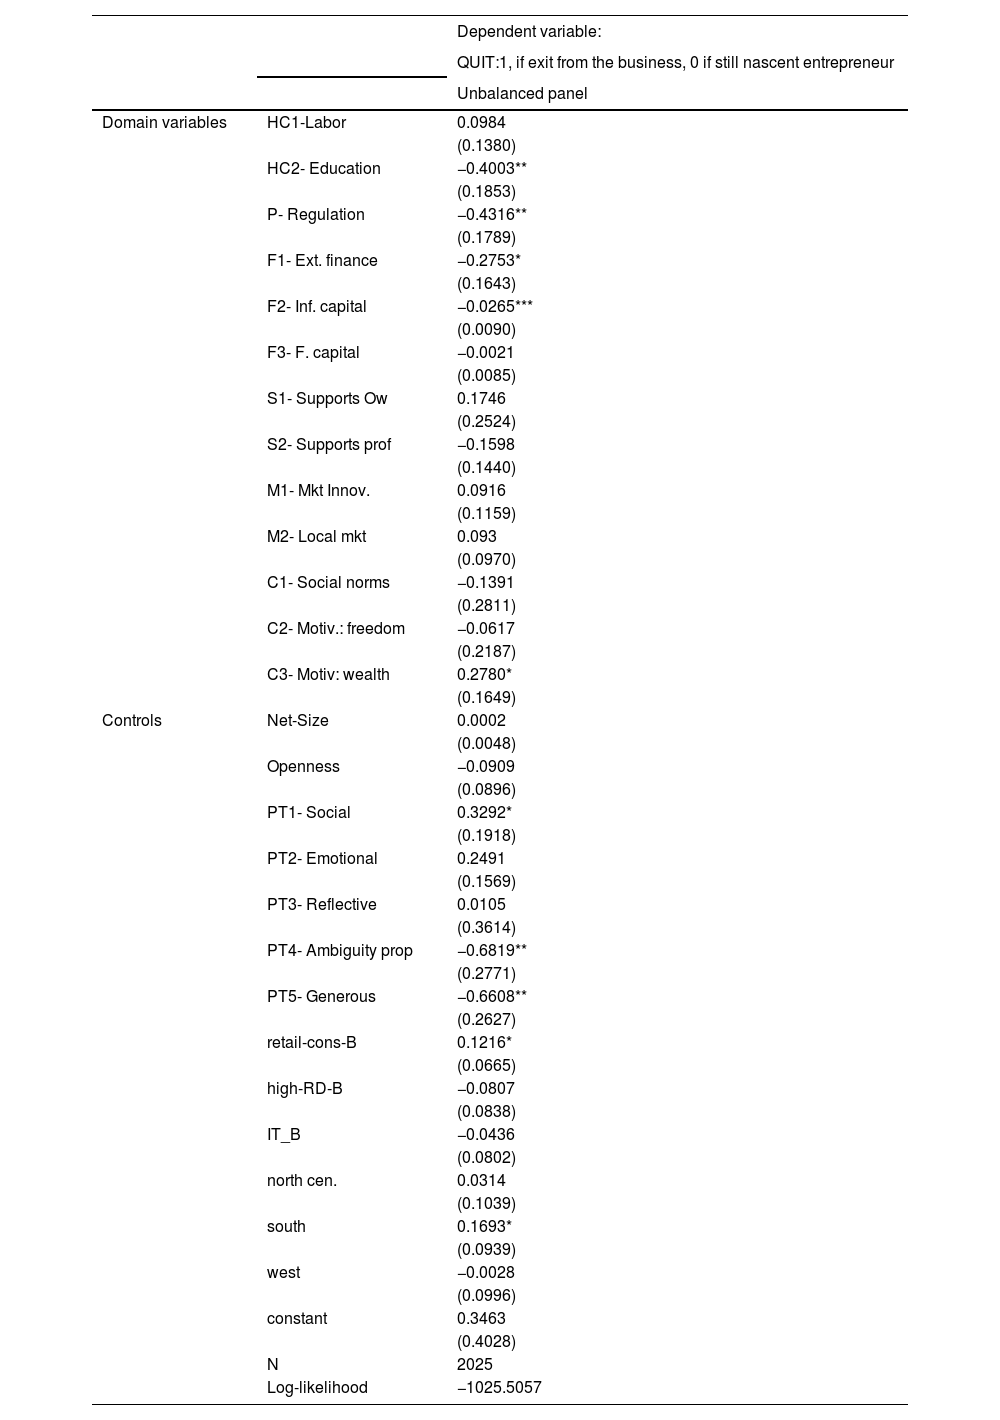
Probit estimations of model [2].
| Dependent variable: | ||
|---|---|---|
| QUIT:1, if exit from the business, 0 if still nascent entrepreneur | ||
| Unbalanced panel | ||
| Domain variables | HC1-Labor | 0.0984 |
| (0.1380) | ||
| HC2- Education | −0.4003** | |
| (0.1853) | ||
| P- Regulation | −0.4316** | |
| (0.1789) | ||
| F1- Ext. finance | −0.2753* | |
| (0.1643) | ||
| F2- Inf. capital | −0.0265*** | |
| (0.0090) | ||
| F3- F. capital | −0.0021 | |
| (0.0085) | ||
| S1- Supports Ow | 0.1746 | |
| (0.2524) | ||
| S2- Supports prof | −0.1598 | |
| (0.1440) | ||
| M1- Mkt Innov. | 0.0916 | |
| (0.1159) | ||
| M2- Local mkt | 0.093 | |
| (0.0970) | ||
| C1- Social norms | −0.1391 | |
| (0.2811) | ||
| C2- Motiv.: freedom | −0.0617 | |
| (0.2187) | ||
| C3- Motiv: wealth | 0.2780* | |
| (0.1649) | ||
| Controls | Net-Size | 0.0002 |
| (0.0048) | ||
| Openness | −0.0909 | |
| (0.0896) | ||
| PT1- Social | 0.3292* | |
| (0.1918) | ||
| PT2- Emotional | 0.2491 | |
| (0.1569) | ||
| PT3- Reflective | 0.0105 | |
| (0.3614) | ||
| PT4- Ambiguity prop | −0.6819** | |
| (0.2771) | ||
| PT5- Generous | −0.6608** | |
| (0.2627) | ||
| retail-cons-B | 0.1216* | |
| (0.0665) | ||
| high-RD-B | −0.0807 | |
| (0.0838) | ||
| IT_B | −0.0436 | |
| (0.0802) | ||
| north cen. | 0.0314 | |
| (0.1039) | ||
| south | 0.1693* | |
| (0.0939) | ||
| west | −0.0028 | |
| (0.0996) | ||
| constant | 0.3463 | |
| (0.4028) | ||
| N | 2025 | |
| Log-likelihood | −1025.5057 |
Note: This table reports the coefficients of a probit regression investigating the effect of ecosystem domain variables on the decision to quit an entrepreneurial project. The reference category is ‘nascent venture continues’. Note that the nature of the dependent variable makes it unreasonable to estimate Model [2] within a balanced panel structure to manifest survivorship bias. All variables are lagged by one year. Detailed variable definitions are provided in the Appendix. ***, ** and * denote significance at the 1, 5, and 10 % level, respectively.
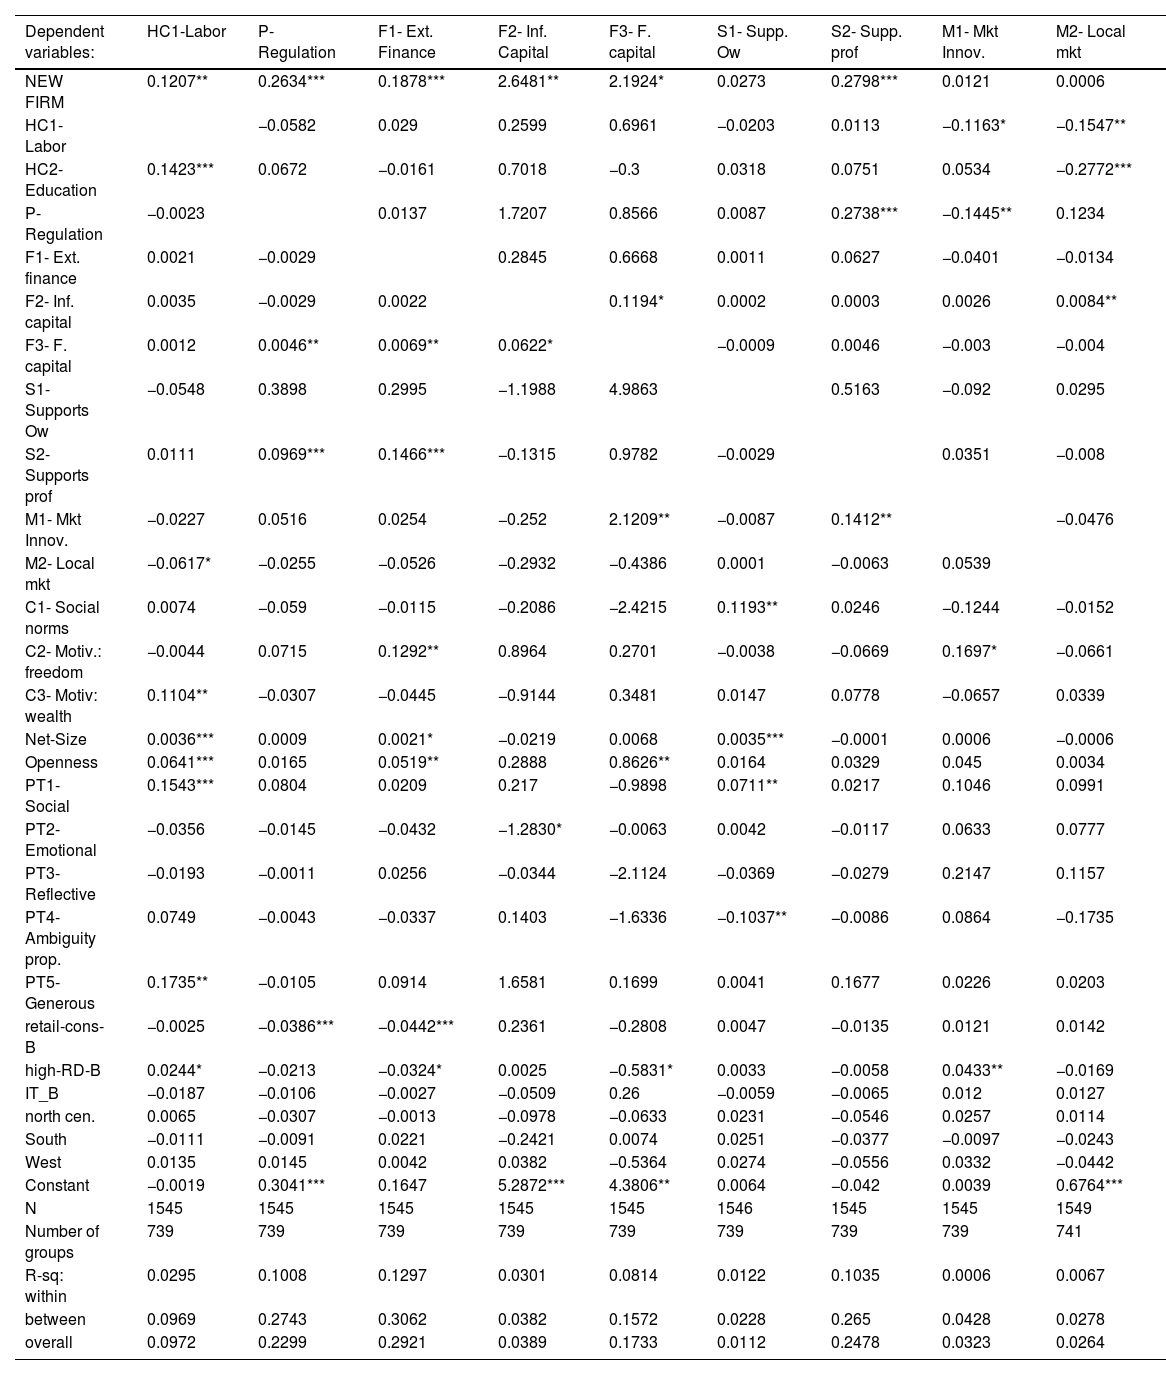
G2SLS random-effects IV estimations of Model [3] results for an unbalanced panel of observations.
| Dependent variables: | HC1-Labor | P- Regulation | F1- Ext. Finance | F2- Inf. Capital | F3- F. capital | S1- Supp. Ow | S2- Supp. prof | M1- Mkt Innov. | M2- Local mkt |
|---|---|---|---|---|---|---|---|---|---|
| NEW FIRM | 0.1207** | 0.2634*** | 0.1878*** | 2.6481** | 2.1924* | 0.0273 | 0.2798*** | 0.0121 | 0.0006 |
| HC1-Labor | −0.0582 | 0.029 | 0.2599 | 0.6961 | −0.0203 | 0.0113 | −0.1163* | −0.1547** | |
| HC2- Education | 0.1423*** | 0.0672 | −0.0161 | 0.7018 | −0.3 | 0.0318 | 0.0751 | 0.0534 | −0.2772*** |
| P- Regulation | −0.0023 | 0.0137 | 1.7207 | 0.8566 | 0.0087 | 0.2738*** | −0.1445** | 0.1234 | |
| F1- Ext. finance | 0.0021 | −0.0029 | 0.2845 | 0.6668 | 0.0011 | 0.0627 | −0.0401 | −0.0134 | |
| F2- Inf. capital | 0.0035 | −0.0029 | 0.0022 | 0.1194* | 0.0002 | 0.0003 | 0.0026 | 0.0084** | |
| F3- F. capital | 0.0012 | 0.0046** | 0.0069** | 0.0622* | −0.0009 | 0.0046 | −0.003 | −0.004 | |
| S1- Supports Ow | −0.0548 | 0.3898 | 0.2995 | −1.1988 | 4.9863 | 0.5163 | −0.092 | 0.0295 | |
| S2- Supports prof | 0.0111 | 0.0969*** | 0.1466*** | −0.1315 | 0.9782 | −0.0029 | 0.0351 | −0.008 | |
| M1- Mkt Innov. | −0.0227 | 0.0516 | 0.0254 | −0.252 | 2.1209** | −0.0087 | 0.1412** | −0.0476 | |
| M2- Local mkt | −0.0617* | −0.0255 | −0.0526 | −0.2932 | −0.4386 | 0.0001 | −0.0063 | 0.0539 | |
| C1- Social norms | 0.0074 | −0.059 | −0.0115 | −0.2086 | −2.4215 | 0.1193** | 0.0246 | −0.1244 | −0.0152 |
| C2- Motiv.: freedom | −0.0044 | 0.0715 | 0.1292** | 0.8964 | 0.2701 | −0.0038 | −0.0669 | 0.1697* | −0.0661 |
| C3- Motiv: wealth | 0.1104** | −0.0307 | −0.0445 | −0.9144 | 0.3481 | 0.0147 | 0.0778 | −0.0657 | 0.0339 |
| Net-Size | 0.0036*** | 0.0009 | 0.0021* | −0.0219 | 0.0068 | 0.0035*** | −0.0001 | 0.0006 | −0.0006 |
| Openness | 0.0641*** | 0.0165 | 0.0519** | 0.2888 | 0.8626** | 0.0164 | 0.0329 | 0.045 | 0.0034 |
| PT1- Social | 0.1543*** | 0.0804 | 0.0209 | 0.217 | −0.9898 | 0.0711** | 0.0217 | 0.1046 | 0.0991 |
| PT2- Emotional | −0.0356 | −0.0145 | −0.0432 | −1.2830* | −0.0063 | 0.0042 | −0.0117 | 0.0633 | 0.0777 |
| PT3- Reflective | −0.0193 | −0.0011 | 0.0256 | −0.0344 | −2.1124 | −0.0369 | −0.0279 | 0.2147 | 0.1157 |
| PT4- Ambiguity prop. | 0.0749 | −0.0043 | −0.0337 | 0.1403 | −1.6336 | −0.1037** | −0.0086 | 0.0864 | −0.1735 |
| PT5- Generous | 0.1735** | −0.0105 | 0.0914 | 1.6581 | 0.1699 | 0.0041 | 0.1677 | 0.0226 | 0.0203 |
| retail-cons-B | −0.0025 | −0.0386*** | −0.0442*** | 0.2361 | −0.2808 | 0.0047 | −0.0135 | 0.0121 | 0.0142 |
| high-RD-B | 0.0244* | −0.0213 | −0.0324* | 0.0025 | −0.5831* | 0.0033 | −0.0058 | 0.0433** | −0.0169 |
| IT_B | −0.0187 | −0.0106 | −0.0027 | −0.0509 | 0.26 | −0.0059 | −0.0065 | 0.012 | 0.0127 |
| north cen. | 0.0065 | −0.0307 | −0.0013 | −0.0978 | −0.0633 | 0.0231 | −0.0546 | 0.0257 | 0.0114 |
| South | −0.0111 | −0.0091 | 0.0221 | −0.2421 | 0.0074 | 0.0251 | −0.0377 | −0.0097 | −0.0243 |
| West | 0.0135 | 0.0145 | 0.0042 | 0.0382 | −0.5364 | 0.0274 | −0.0556 | 0.0332 | −0.0442 |
| Constant | −0.0019 | 0.3041*** | 0.1647 | 5.2872*** | 4.3806** | 0.0064 | −0.042 | 0.0039 | 0.6764*** |
| N | 1545 | 1545 | 1545 | 1545 | 1545 | 1546 | 1545 | 1545 | 1549 |
| Number of groups | 739 | 739 | 739 | 739 | 739 | 739 | 739 | 739 | 741 |
| R-sq: within | 0.0295 | 0.1008 | 0.1297 | 0.0301 | 0.0814 | 0.0122 | 0.1035 | 0.0006 | 0.0067 |
| between | 0.0969 | 0.2743 | 0.3062 | 0.0382 | 0.1572 | 0.0228 | 0.265 | 0.0428 | 0.0278 |
| overall | 0.0972 | 0.2299 | 0.2921 | 0.0389 | 0.1733 | 0.0112 | 0.2478 | 0.0323 | 0.0264 |
Note: This table reports the coefficients of the unbalanced panel regressions with random effects, where each ecosystem domain is regressed against the other domains and entrepreneurial outcomes, including a set of control variables. Endogenous domain variables (HC1-Labor, P-Regulation, F1-Ext. finance, F2: Inf capital, F3: Formal capital, S1-Supports owners, S2-Supports prof, M1-Mkt innovation, M2-Local mkt) were instrumented, and the first difference (period-to-period change) for each endogenous domain was used as an instrument. Detailed variable definitions are provided in the Appendix. ***, ** and * denote significance at the 1, 5, and 10 % level, respectively.
When commenting on the estimations of Model [1], which unfolds what leads a nascent entrepreneur to become a new firm, we focus on the balanced panel framework because it is likely to report more reliable information from interviewees who regularly took part in the survey over time. Nevertheless, as shown in Table 3, the results of the unbalanced panel estimations were mostly consistent.
Conversely, when estimating Model [2], which reveals what leads a nascent entrepreneur to quit the business project (Table 4), we are forced to use the unbalanced panel framework uniquely because the balanced one is affected by a manifest survivorship bias, which impedes observations of those exiting the survey one year after the other. An unbalanced panel provides a more accurate representation of the evolution of an entrepreneurial ecosystem by capturing its inherent dynamism and volatility (Gaies et al., 2025). In fact, it helps capture the exit dynamics. Entrepreneurial ecosystems are defined not only by successful firms but also by those that exit, quit, or pivot. The balanced panel overlooks this critical component. Moreover, it highlights a realistic analysis of trends, ensuring that the dataset reflects the natural volatility of the ecosystem and includes the churn and movement of firms. It also reflects the inclusion of new entrants and provides insights into growth and innovation trends. Finally, it avoids the skewed policy implications. Policies based on survivorship-biased data may overemphasise the support of already successful entities and neglect the needs of early-stage startups or struggling firms.
Which ecosystem domains cause nascent entrepreneurs to become new firms? This is our first research question, and the estimations presented in Table 3 provide the responses. We find that four of the 13 domain variables show a significant relationship with the probability that a nascent enterprise will develop into a new firm, and all of them manifest a positive sign. We find that this evolution is triggered by a tendency to formalise the business (P-Regulation, p < 0.01, coeff. =8.2855) and makes it recognisable, for example, by registering the legal form with an appropriate government agency, the ability to access external finance (F1-Ext. finance, p < 0.1, coeff.=3.1752); professional support offered by managers, accountants, and lawyers (S2-Support prof, p < 0.05, coeff. =3.2272) and, finally, a cultural attitude to use business in order to increase personal wealth (C3-Motiv. wealth, p < 0.01, coeff.=2.7904). Among the controls, we believe that the significance and positive sign were related to the net size (p < 0.05, coeff. =0.0534), which indicates the number of entrepreneur connections among other owners, key non-owners, and business helpers. This suggests that the larger the nascent entrepreneur's network, the higher the probability of achieving a positive outcome.
Which ecosystem domains cause nascent entrepreneurs to quit business projects? Responses to the second research question were found in the estimations reported in Table 4. Most of the relationships between the ecosystem domains and negative outcomes were negative. The decision to quit a nascent venture appears to be hindered by the level of education of nascent entrepreneurs (HC2, p < 0.05, coeff. = −0.4003), degree of business formalisation (p < 0.05, coeff. = −0.4316), the access to external financial sources (F1, p < 0.1, coeff. =−0.2753), and the availability of informal capital, that is, capital provided by relatives and friends (F2, p < 0.01, coeff. = −0.0265). Conversely, the decision to quit was positively affected by a cultural inclination to make business to increase personal wealth (C3, p < 0.1, coeff. = 0.2780). This last result, coupled with the positive sign of the C3 variable upon the odds of becoming a new firm, previously revealed, suggests that the presence of ‘a personal motivation towards entrepreneurship as a source of wealth’ underpins a ‘win or lose’ strategy of individuals, that reduces the tendency to persist with likely unsatisfactory projects.
Empirical causal paths among ecosystem domains and outcomes: reinforcing loopsOur econometric models allowed us to answer the following research question: How do entrepreneurial outcomes affect the ecosystem? Fig. 3 graphically summarises our results and provides an answer by showing the significant pairwise links between entrepreneurial outcomes and ecosystem domains. We also report the statistically significant coefficients estimated in the preceding models to emphasise the mutual relationship between ecosystem domains and entrepreneurial outcomes. The incoming bold arrows indicate a significant causal influence of ecosystem domains on entrepreneurial outcomes, as described in the previous paragraph and as a result of the IV probit estimation in Table 3. The outgoing dotted arrows indicate the significant causal influence of entrepreneurial outcomes on ecosystem domains and are derived by estimations of the Model [3], as reported in Table 6.
 Note: Figure 3 indicates significant causal paths that link ecosystem domains to outcomes and vice versa, which refers to a specific outcome–having become a new firm against still being a nascent entrepreneur.")
Empirical causal paths between entrepreneurial outcomes and innovation ecosystem domains. Results for a balanced panel of observations (N = 1176)
Note: Figure 3 indicates significant causal paths that link ecosystem domains to outcomes and vice versa, which refers to a specific outcome–having become a new firm against still being a nascent entrepreneur.
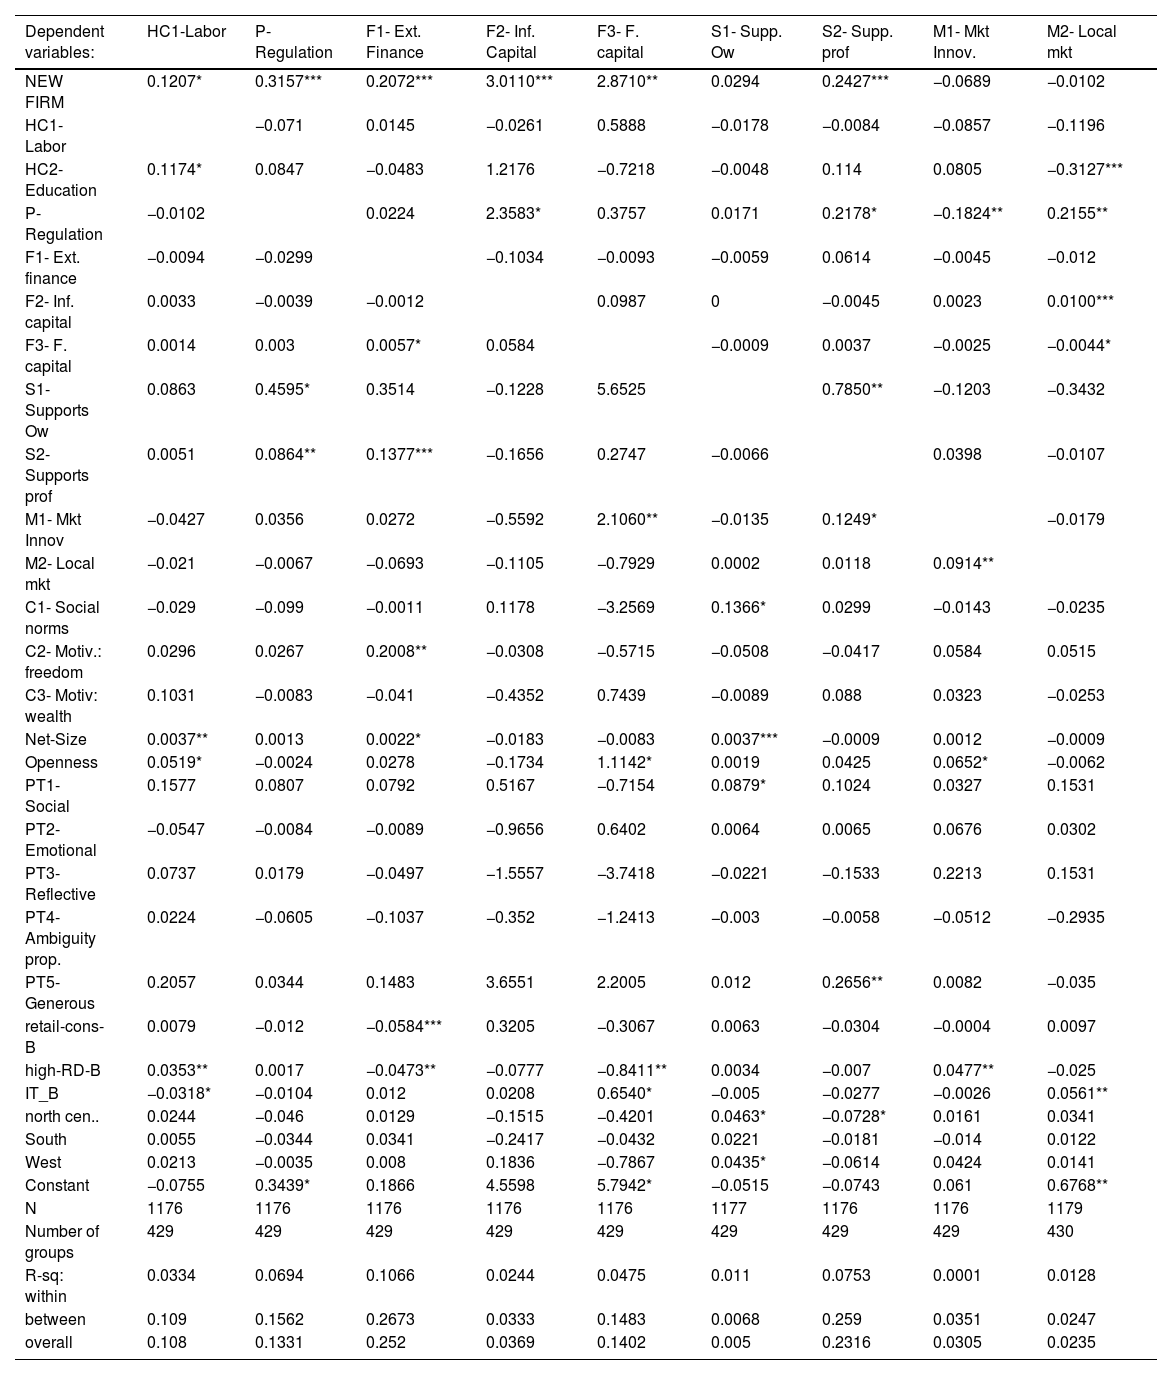
G2SLS random-effects IV of Model [3] results for a balanced panel of observations.
| Dependent variables: | HC1-Labor | P- Regulation | F1- Ext. Finance | F2- Inf. Capital | F3- F. capital | S1- Supp. Ow | S2- Supp. prof | M1- Mkt Innov. | M2- Local mkt |
|---|---|---|---|---|---|---|---|---|---|
| NEW FIRM | 0.1207* | 0.3157*** | 0.2072*** | 3.0110*** | 2.8710** | 0.0294 | 0.2427*** | −0.0689 | −0.0102 |
| HC1-Labor | −0.071 | 0.0145 | −0.0261 | 0.5888 | −0.0178 | −0.0084 | −0.0857 | −0.1196 | |
| HC2- Education | 0.1174* | 0.0847 | −0.0483 | 1.2176 | −0.7218 | −0.0048 | 0.114 | 0.0805 | −0.3127*** |
| P- Regulation | −0.0102 | 0.0224 | 2.3583* | 0.3757 | 0.0171 | 0.2178* | −0.1824** | 0.2155** | |
| F1- Ext. finance | −0.0094 | −0.0299 | −0.1034 | −0.0093 | −0.0059 | 0.0614 | −0.0045 | −0.012 | |
| F2- Inf. capital | 0.0033 | −0.0039 | −0.0012 | 0.0987 | 0 | −0.0045 | 0.0023 | 0.0100*** | |
| F3- F. capital | 0.0014 | 0.003 | 0.0057* | 0.0584 | −0.0009 | 0.0037 | −0.0025 | −0.0044* | |
| S1- Supports Ow | 0.0863 | 0.4595* | 0.3514 | −0.1228 | 5.6525 | 0.7850** | −0.1203 | −0.3432 | |
| S2- Supports prof | 0.0051 | 0.0864** | 0.1377*** | −0.1656 | 0.2747 | −0.0066 | 0.0398 | −0.0107 | |
| M1- Mkt Innov | −0.0427 | 0.0356 | 0.0272 | −0.5592 | 2.1060** | −0.0135 | 0.1249* | −0.0179 | |
| M2- Local mkt | −0.021 | −0.0067 | −0.0693 | −0.1105 | −0.7929 | 0.0002 | 0.0118 | 0.0914** | |
| C1- Social norms | −0.029 | −0.099 | −0.0011 | 0.1178 | −3.2569 | 0.1366* | 0.0299 | −0.0143 | −0.0235 |
| C2- Motiv.: freedom | 0.0296 | 0.0267 | 0.2008** | −0.0308 | −0.5715 | −0.0508 | −0.0417 | 0.0584 | 0.0515 |
| C3- Motiv: wealth | 0.1031 | −0.0083 | −0.041 | −0.4352 | 0.7439 | −0.0089 | 0.088 | 0.0323 | −0.0253 |
| Net-Size | 0.0037** | 0.0013 | 0.0022* | −0.0183 | −0.0083 | 0.0037*** | −0.0009 | 0.0012 | −0.0009 |
| Openness | 0.0519* | −0.0024 | 0.0278 | −0.1734 | 1.1142* | 0.0019 | 0.0425 | 0.0652* | −0.0062 |
| PT1- Social | 0.1577 | 0.0807 | 0.0792 | 0.5167 | −0.7154 | 0.0879* | 0.1024 | 0.0327 | 0.1531 |
| PT2- Emotional | −0.0547 | −0.0084 | −0.0089 | −0.9656 | 0.6402 | 0.0064 | 0.0065 | 0.0676 | 0.0302 |
| PT3- Reflective | 0.0737 | 0.0179 | −0.0497 | −1.5557 | −3.7418 | −0.0221 | −0.1533 | 0.2213 | 0.1531 |
| PT4- Ambiguity prop. | 0.0224 | −0.0605 | −0.1037 | −0.352 | −1.2413 | −0.003 | −0.0058 | −0.0512 | −0.2935 |
| PT5- Generous | 0.2057 | 0.0344 | 0.1483 | 3.6551 | 2.2005 | 0.012 | 0.2656** | 0.0082 | −0.035 |
| retail-cons-B | 0.0079 | −0.012 | −0.0584*** | 0.3205 | −0.3067 | 0.0063 | −0.0304 | −0.0004 | 0.0097 |
| high-RD-B | 0.0353** | 0.0017 | −0.0473** | −0.0777 | −0.8411** | 0.0034 | −0.007 | 0.0477** | −0.025 |
| IT_B | −0.0318* | −0.0104 | 0.012 | 0.0208 | 0.6540* | −0.005 | −0.0277 | −0.0026 | 0.0561** |
| north cen.. | 0.0244 | −0.046 | 0.0129 | −0.1515 | −0.4201 | 0.0463* | −0.0728* | 0.0161 | 0.0341 |
| South | 0.0055 | −0.0344 | 0.0341 | −0.2417 | −0.0432 | 0.0221 | −0.0181 | −0.014 | 0.0122 |
| West | 0.0213 | −0.0035 | 0.008 | 0.1836 | −0.7867 | 0.0435* | −0.0614 | 0.0424 | 0.0141 |
| Constant | −0.0755 | 0.3439* | 0.1866 | 4.5598 | 5.7942* | −0.0515 | −0.0743 | 0.061 | 0.6768** |
| N | 1176 | 1176 | 1176 | 1176 | 1176 | 1177 | 1176 | 1176 | 1179 |
| Number of groups | 429 | 429 | 429 | 429 | 429 | 429 | 429 | 429 | 430 |
| R-sq: within | 0.0334 | 0.0694 | 0.1066 | 0.0244 | 0.0475 | 0.011 | 0.0753 | 0.0001 | 0.0128 |
| between | 0.109 | 0.1562 | 0.2673 | 0.0333 | 0.1483 | 0.0068 | 0.259 | 0.0351 | 0.0247 |
| overall | 0.108 | 0.1331 | 0.252 | 0.0369 | 0.1402 | 0.005 | 0.2316 | 0.0305 | 0.0235 |
Note: This table reports the coefficients of the balanced panel regressions with random effects, where each ecosystem domain is regressed against the other domains and entrepreneurial outcomes, including a set of control variables. Endogenous domain variables (HC1-Labor, P-Regulation, F1-Ext. Finance, F2– Inf capital, F3– Formal capital, S1-Supports owners, S2-Supports prof, M1-Mkt innovation, and M2-Local mkt) were instrumented, and the first difference (period-to-period change) for each endogenous domain was used as an instrument. Detailed variable definitions are provided in the Appendix. ***, ** and * denote significance at the 1, 5, and 10 % level, respectively.
Fig. 3 shows that the three ecosystem domains activated a significant reinforcing loop with entrepreneurial outcomes. Joint consideration of estimations from [1] and [3] indicates a positive interconnection between NEW_FIRM and P-Regulation (p < 0.01): The condition of formalising the business, as a sign of engagement in the venture, for example by registering the legal form with the appropriate government agency, or by filling specific business-related applications/payments, positively affects the probability to become a new firm; and, in turn, a new firm, compared to a nascent enterprise, tends to increase the degree of business identification and formalisation (coeff. 0.3157). The same evidence was offered by the F1-Ext Finance (p < 0.01) and S2-Support Prof (p < 0.01) domains. As far as F1-Ext Finance is concerned, the greater the intensity of the exploitation of external finance channels, the higher the probability of becoming a new firm. However, transforming into a new firm leads entrepreneurs to strengthen external finance channels (coeff. =0.2072). In the second case (S2-Support prof), the greater the intensity of the use of professionals, such as managers, accountants, and lawyers, the higher the probability of becoming a new firm. In turn, transforming into a new firm induces the entrepreneur to recruit qualified professionals (coeff. =0.2427).
The remaining significant connections between NEW_FIRM and the domains shown in Table 6 are one-way, indicating a causal influence of entrepreneurial outcomes on ecosystems without a documented link back. It is reasonable that new firms need to invest more in human capital (HC1-Labor, p < 0.1, coeff. =0.1207) and increase the amount of money invested in the business from both informal (F2-$Inf. Cap, p < 0.01, coeff.=3.0110) and formal sources (F3-$F. Cap, p < 0.05, coeff. =2.8710).
Empirical causal paths among ecosystem domains and outcomes: higher-order interactionsThe design of Model [3] offers ancillary but equally critical evidence of causality paths among ecosystem domains towards one another. Results of estimations shown in Table 6 can be observed on a pairwise frame either by raw, i.e. ‘affecting’ domains or by columns, i.e. ‘affected’ domains. A graphical representation of all significant causal paths among ecosystem domains appears to be overly complex, with the risk of losing efficacy. Therefore, we opted for a partial representation (Fig. 4) of casual connections within a selected subsample of domains.
![Empirical higher-order connections between innovation ecosystem domains and outcomes Results for a balanced panel of observations (N = 1176) Note: Fig. 4 adds significant causal paths to Fig. 3 that link ecosystem domains to the remaining ones, resulting in an additional finding from model estimation [3]. The connections are pairwise, and the direction of the arrows, given the design of Model [3], is the direction of causality. For all significant connections, the signs of the relationships were positive. Fig. 4 focuses exclusively on the domains (in grey) that significantly influence the three endogenous domains (P, F1, and S2) that, from the estimation of Model [1], have been proven to trigger the probability of developing into a new firm (red bold arrows).](https://static.elsevier.es/multimedia/2444569X/0000001000000003/v18_202504250514/S2444569X25000460/v18_202504250514/en/main.assets/gr4.jpeg?xkr=ue/ImdikoIMrsJoerZ+w997EogCnBdOOD93cPFbanNcX6PcOHo8VDqRKrp6xHZ/NjGl+HoFhtirvOB9i8+d5tkFgcTtSURsbI/fkeYct/RfVqJpiQXvfXct4OZW8cwslSd42+pmA1PX3IyLBOJp9yGGk73GNxXyufTLGdaGeK9QttaCgdNE8vQP+k9ZPjUR6mVSrz8FtVZr9eG5DuAafSzyvA07KK+99r0WNAeESa48Cs1KhFArPK4zRkwVH7HrbwQAPvdGs99kr2K7Iyt831KD4o8aIK0d96q6HF80Vqm+5znVsANcqgkuQPmnCf5uqpVUGvX1mXg0IxPFroyOTVA== "Empirical higher-order connections between innovation ecosystem domains and outcomes Results for a balanced panel of observations (N = 1176) Note: Fig. 4 adds significant causal paths to Fig. 3 that link ecosystem domains to the remaining ones, resulting in an additional finding from model estimation [3]. The connections are pairwise, and the direction of the arrows, given the design of Model [3], is the direction of causality. For all significant connections, the signs of the relationships were positive. Fig. 4 focuses exclusively on the domains (in grey) that significantly influence the three endogenous domains (P, F1, and S2) that, from the estimation of Model [1], have been proven to trigger the probability of developing into a new firm (red bold arrows).")
Empirical higher-order connections between innovation ecosystem domains and outcomes Results for a balanced panel of observations (N = 1176)
Note: Fig. 4 adds significant causal paths to Fig. 3 that link ecosystem domains to the remaining ones, resulting in an additional finding from model estimation [3]. The connections are pairwise, and the direction of the arrows, given the design of Model [3], is the direction of causality. For all significant connections, the signs of the relationships were positive. Fig. 4 focuses exclusively on the domains (in grey) that significantly influence the three endogenous domains (P, F1, and S2) that, from the estimation of Model [1], have been proven to trigger the probability of developing into a new firm (red bold arrows).
Fig. 4 exclusively adds inter-domain links for the three ecosystem components that we found to trigger the probability of developing into a new firm: Domains P, F1, and S2. In particular, from Table 6, we derive the following positive inter-domain relations: P-regulation is reinforced by strong exploitation of support offered by owners (S1-Owners) and professionals (S2-Support platform); the S2 domain is reinforced by P-regulation and S1-Owners, but also by the exploitation of innovative markets, the M1-Innovation domain. Finally, access to external finance, F1-Ext. Fin was supported by the presence of professionals (S2) and the amount of money formally involved in the project (F3).
Discussion of findings: a set of challenges for the governance of innovation ecosystemsCreating and supporting innovative ecosystems poses various challenges for policymakers. Based on previous results, general principles can be suggested.
First, policy interventions must follow a holistic approach because initiatives are likely to be ineffective if introduced in isolation. This motivates our pattern of governance to be based on the comprehensive control of the entire ecosystem and its components. We definitively believe in the instruments of holistic governance of the ecosystem and suggest that any entrepreneurship development policy should address many factors simultaneously because innovation ecosystems are dynamic and complex organisms. As Vogel (2013) has argued, ‘If we do not measure the effectiveness of the various components in an ecosystem as well as the ecosystem as a whole, we will not be able to improve existing programmes and put in place new and complementary sources’ (Vogel, 2013, p. 447).
Second, appropriate forms of intervention need to carefully consider both the direct and indirect effects produced by each action, that is, to be assessed and monitored over time to ensure effectiveness. Our empirical findings suggest that all ecosystem domains can be placed on a spectrum. This ranges from those with a direct influence (positive) on desirable entrepreneurial outcomes (such as regulation, access to external financing, support of professionals) or negative influence on undesirable ones (again, regulation, access to external and informal financing, education), up to those exerting an indirect influence on the transition to a new firm, in the form of higher-order connections with other ecosystem domains (besides the already quoted, market domain, and support from owners). This involves certain domains (e.g., supportive regulations, access to external finance, and professional support) that actively promote favourable entrepreneurial outcomes by directly addressing entrepreneurs’ needs. For instance, simplified regulatory frameworks or accessible funding mechanisms lower the barriers to entry and growth. Conversely, factors such as overregulation or reliance on informal financing can directly impede entrepreneurship by introducing risks, uncertainties, or inefficiencies. Nonetheless, it seems clear that managers and policymakers must identify the ecosystem domains that most directly impact entrepreneurial outcomes within their specific contexts. Strategies should focus on amplifying positive influences (e.g., lobbying for supportive regulations or improving access to funding) while mitigating negative ones (e.g., reducing bureaucratic hurdles or addressing informal finance risks).
Moreover, the taxonomy presented in this paper, even if not rigid, can help policymakers prioritise investments in domains based on their direct and indirect influences on business venture success. It can also verify the extent to which entrepreneurial growth can be attributed to a program in a specific domain. For example, investing in entrepreneurial education at universities may exert a direct effect both in supporting nascent ventures to develop into new firms and in reducing decisions to abandon business ideas. Moreover, specific educational programs that concern the qualification of supporting professionals (such as managers, lawyers, and accountants) may also generate a further indirect influence on entrepreneurial outcomes, as they may stimulate a positive attitude towards the formalisation of the business and trigger access to external financing. These are two additional domains that have been proven to accelerate the new firm creation process.
Third, appropriate forms of intervention should be related to the maturity of the entities exploiting and living in the ecosystem, as these entities are dynamic, and their evolution is likely to shape their understanding and exploitation of the surrounding environment. Our findings suggest that ecosystem domains and entrepreneurial outcomes are tied together through a co-evolution process. Therefore, the transition towards stable entrepreneurial conditions may trigger an increase in the exploitation of specific parts of a system. From the perspective of policy measures, this implies that, for example, at the emergence stage, emphasis may be placed on the domains that support the development of a new firm. In the subsequent phase of a stable entrepreneurial status, firms likely increase requests for organisational development, human capital development, and access to growth capital, thus influencing the evolution of the surrounding environment and definitively asking for advanced support policies.
Moreover, a holistic policy approach is essential. Isolated interventions are less effective than integrated strategies that address multiple domains simultaneously. For example, improving infrastructure might support regulations (ease of compliance) and markets (enhanced logistics). In contrast, tax incentives for startups could be paired with regulatory reforms to ensure that startups survive beyond their initial stages.
Similarly, governments should establish mechanisms for monitoring entrepreneurial ecosystems and adjust policies based on feedback and evolving conditions. This could include (i) regular ecosystem health assessments, (ii) public-private partnerships to identify and address gaps, and (iii) iterative policy designs that incorporate stakeholder inputs.
ConclusionsThe causality nexus that links entrepreneurial ecosystem components and targeted outcomes represents policymakers’ concerns. In this study, we elucidate the causal paths linking ecosystem domains and business outcomes. Our approach allows us to investigate both the direct and indirect relationships between ecosystem constituents and business success. Specifically, our findings reveal direct connections in terms of which domain positively affects the desired outcome of new firm creation and which domain breaks the undesired outcome of abandoning nascent ventures. In addition, our empirical evidence reveals indirect (higher-order) connections in the form of which domain most affects the critical components of the ecosystem that are found to facilitate the primary objective of new firm creation.
This study relies on two methodological assumptions. First, we emphasise the micro-foundation of innovation ecosystems, which focuses on how nascent entrepreneurs interact with and gain resources from the surrounding environment and how this knowledge and exploitation affect entrepreneurial outcomes. Second, we adopt an intertemporal approach to identify clear reasoning for the cause-and-effect relationship between the ecosystem and entrepreneurial outcomes to solve their inherently endogenous relationship. Such an approach provides clues for identifying the ecosystem domains that mostly foster the transformation of nascent businesses into new firms as well as those that overcome bottlenecks that prevent the success of new ventures (Acs et al., 2014).
Overall, our findings suggest a pattern for holistic governance of innovation ecosystems based on comprehensive control of their components and their interlinks. The underlying idea is that several policy interventions must be addressed simultaneously, consistent with the natural complexity of the ecosystem itself.
Limitations and future researchWe acknowledge the limitations of this study, which are implicitly identified by definition, with the statement complementing theoretical studies on entrepreneurship ecosystems using an empirical approach. We were inevitably asked to give ‘numbers/scores’ to dimensions that are frequently intangible and multifaceted, such as the subjective exploitation of a resource. However, this approach appears hardly practical by nature.
Additionally, our empirical approach faces several inherent challenges.
First, we highlight the fact that assigning scores to intangible dimensions may reflect subjective judgments that vary across respondents, contexts, and times. This variability may reduce the consistency and generalisability of the findings.
Secondly, entrepreneurship ecosystems are highly context-dependent. Therefore, our findings may not fully account for variations across regions, industries, or stages of economic development, thus limiting the transferability of the results.
Additionally, by quantifying multifaceted dimensions, we may oversimplify the intricate interdependencies within ecosystems, potentially overlooking the qualitative nuances that are critical for understanding these dynamics.
Finally, as stated before, we are aware that ecosystems evolve over time, and our study provides a static snapshot rather than capturing the dynamic and temporal shifts that are intrinsic to entrepreneurial ecosystems.
Nevertheless, the results are valuable for equipping policymakers and entrepreneurs with a better understanding of how innovation ecosystems work to enhance interventions and programmes to support successful entrepreneurship. Future research could address these limitations by employing longitudinal studies, qualitative methods, and more inclusive data-collection methods to enrich our understanding of entrepreneurial ecosystems.
“Compliance with ethical standards”Research involving Human Participants and/or Animals: this research does not involve Human Participants and/or Animals
Informed consentN/A.
The datasets used and/or analysed during the current study available from the corresponding author on reasonable request.
Participants/humans are not directly involved in the study.
FoundingPRIN 2022 - Entrepreneurial ecosystem and business registration during the COVID-19-pandemic: a focus on female entrepreneur, CUP I53D23002480006.
CRediT authorship contribution statementCaterina Lucarelli: Data curation, Conceptualization. Nicoletta Marinelli: Methodology, Formal analysis, Data curation, Conceptualization. Alessandra Micozzi: Writing – original draft, Investigation, Funding acquisition. Maria Zifaro: Writing – review & editing. Maria Palazzo: Writing – original draft, Validation, Methodology, Investigation. Antonella Ferri: Supervision.