


Accurate demand forecasting is important for automotive manufacturing and sales planning because it allows firms to minimize costs and improve their effectiveness. Based on the limitations of existing literature, this paper seeks to establish a novel machine learning-assisted hybrid-input automobile demand forecast model by focusing on the research gaps in input data, methodology, and the scope of demand forecast. To achieve the research aim, the firm-level forecasting performance of the machine learning algorithms based on the hybrid micro-/firm-level (endogenous) and macro-level (exogenous) factors were analyzed to present the optimal approach. The study collected and used monthly vehicle sales and related firm-level data from South Korea from 2011 to 2020. Linear regression, neural network, random forest, stochastic gradient descent, and ensemble learning were used to build the models and verify significant input features using the RReliefF algorithm. The paper presents significant theoretical and managerial contributions that advance the methodological frameworks in the auto demand forecasting literature based on the ML-assisted hybrid-input model, highlighting less well-known endogenous factors that affect company precision to enhance businesses' practical operations.
Using company and external data can lead to acquiring, exchanging, and creating new knowledge (Scuotto et al., 2017). Enhanced knowledge, such as advancement in demand forecasting capability, which develops from the synergistic interplay between the business processes and new analytical techniques, can be a source of competitive advantage (Ferraris et al., 2019). New knowledge can offer industries new forms of innovation. The core of innovation is recreating reality based on pursuing an ideal situation, and in this sense, creating new knowledge affects the business organization's effectiveness through self-renewal (Nonaka & Takeuchi, 2007). From this perspective, scrutinizing data analysis methodology that can improve predictive capability by utilizing data inside and outside a firm can add value by improving managerial effectiveness and be viewed as knowledge innovation.
The automotive sector is a major industry that relies on complex strategic partnerships that impact the upstream and downstream processes. The sector makes enormous contributions to the global economy (Sun et al., 2015) by creating tax revenues while encouraging economic development and technological advancements (Mathur & Kidambi, 2012). Today, it is the largest sector in terms of total retail spending in the US (Palandrani, 2020) and creates numerous jobs within the economy (ACEA, 2019; NADA, 2019).
Predicting sales is critical for modern business intelligence (Efendigil et al., 2009; Mentzer & Moon, 2004), and this applies to the automotive sector. Demand forecasting in the automotive industry is especially crucial for precise manufacturing and sales planning (Arslankaya & Öz, 2018), where production and R&D take a relatively long lead time (Danese & Kalchschmidt, 2011). Furthermore, fluctuations in demand can impact the industry's supply chain of parts and components (Dwaikat et al., 2018). Accurate demand forecasting allows automakers to minimize cost and time, optimize resources, and improve business effectiveness (Aslam et al., 2021; Gao et al., 2017; Jha et al., 2017). On the other hand, an inaccurate forecast can result in negative consequences, such as excess inventory, a lack of production supply, high labor costs, and the loss of reputation (Gao et al., 2017).
Researchers have adopted various methods to achieve better predictive capabilities in demand forecasting, and many factors are known to affect automobile sales (Gao et al., 2017). In addition to using traditional multiple regression or time-series data analyses, researchers have begun to test relatively unprecedented methods, such as web searches and social network analyses, for auto demand forecasting (Yang & Zhang, 2020). Recently, machine learning (ML) has become more popular than ever in business research (Kaya et al., 2019). Even though social scientists have been reluctant to integrate machine learning data analytics, they are now required to combine such computational methodology with their practices (Chen et al., 2018).
Businesses may also try to find and apply new techniques, such as ML, to upgrade demand and supply practices and improve their supply chain management's effectiveness (Török et al., 2019). Traditional statistical methods have known limitations (Xie, 2011) and are only applicable in environments where the relationships among the data are stable. On the other hand, ML simultaneously embraces new learners that have evolved from traditional methods and offers the advantage of comparing models that produce optimal results (Acharya et al., 2019; Ao et al., 2019; Yuchi et al., 2019). ML can also be deployed for various tasks requiring flexibility and scalability (Ngiam & Khor, 2019). ML's advantages cannot be obtained from traditional mathematical modeling.
Auto demand forecast literature has relied on traditional predictive models for a long time. However, now that ML's merits have been recognized, it has been applied more frequently in the auto demand forecast domain since 2015 (e.g., Bottani et al., 2021; Farahani et al., 2016; Kaya et al., 2022; Qu et al., 2022). However, these studies also reveal some limitations and call for further research, including a thorough evaluation of ML models and their feasibility for real-world application and an extensive viewpoint in choosing model data.
Three substantial research gaps are found in the literature that deals with domain knowledge. First, limited data has been used to build prediction models. Most researchers have focused on exogenous or macro-level data to explain how the demand is created (e.g., Fantazzini & Toktamysova, 2015; Kitapci et al., 2014). Second, previous methodological approaches have depended on traditional statistical models (e.g., Lee & Kang, 2015; Wang & Choi, 2013). Third, the existing literature strives to bring an excessively generalized illustration of a market demand focusing on the market/country/regional level (e.g., Gao et al., 2017; Tang & Wu, 2015) but neglects business organizations' practical needs for realizing firm-level precision forecast, which is critical to sustainability.
To further promote the creation of new knowledge for precision auto demand forecasting, the paper seeks to innovate the domain knowledge by suggesting a machine-learning-assisted hybrid-input automobile demand forecast model, focusing on the three research gaps surrounding a) limitations in the usage of model data, b) limitations in data analytics methodology, and c) limitations in the forecast scope of a predictive model.
In light of the above, the contribution of this study is three-fold. First, different from prior studies, it examines lesser-known, under-explored factors that may bring more explanation power, focusing on hybrid-input data. Second, the paper advances the methodological frameworks in automobile demand forecast literature by applying multiple ML techniques and comparison results. Third, the study uniquely presents a firm-level prediction model scarcely proposed in prior studies, expediting the research feasibility for the automotive retail and business applicability in the real world.
In summary, this study seeks to build an automobile demand forecast model at a firm level and identifies the importance of demand-determining factors, confirming the possibility of applying ML methodology in business research. The study also aims to provide primary data to support future business decision-making. Ultimately, this paper presents the following research question: How could internal process data/external environmental data and machine learning analytical techniques be integrated to suggest a practical demand forecasting model with higher predictability at the firm level?
The rest of the paper is constructed as follows. Section 2 reviews the theoretical foundations. Section 3 displays the research design and data collection, while Section 4 deals with the results. The findings are discussed in Section 5. Sections 6 and 7 deal with the conclusion, limitations, and suggestions for future research.
Literature reviewThree literature streams are related to the study. This section covers the auto demand forecast, ML application in social science, and theoretical backgrounds for ML algorithms used in this study.
Demand forecast research in the automotive sectorInnovation in automotive demand forecasting has been particularly crucial since it is a matter that directly connects to the optimization of production issues and preparation of sales schemes (Arslankaya & Öz, 2018), which require tremendous firm resources and efforts. It also impacts product R&D, which needs a relatively long timeframe (Danese & Kalchschmidt, 2011). Improved demand forecast capability is often believed to deliver a competitive advantage in controlling demand fluctuations in the supply chain of parts and components (Dwaikat et al., 2018), minimizing the 'bullwhip effect'—a phenomenon in which a small error in estimating consumer demand leads to an amplified chain reaction in the entire supply chain—indispensable in the auto industry (i.e., Chiang et al., 2016).
There are two main methodological approaches in demand forecasting: qualitative and quantitative (Arslankaya & Öz, 2018). The qualitative approach includes market research, Delphi (a technique that relies on a panel of experts to reach a mutual agreement or consensus), and expert opinions subjective to one's thoughts and experience (Kaya et al., 2022). The qualitative approach is preferred when data is insufficient or contextual inference is preferred. On the other hand, the quantitative approach is applied if numerical data is sufficient to support mathematical models (Kaya et al., 2019). Quantitative methods have two main categories: a) time series analysis (e.g., trend analysis, using moving averages, exponential smoothing), and b) mixed methods (e.g., simple/multiple regression, using AI-based algorithms such as artificial neural networks) (Kaya et al., 2019).
Scholars applied several methodologies to forecast automobile demand in the literature (Gao et al., 2017). As described below (see Table 1), models based on time series or regression methods based on traditional statistics were dominant in the literature for demand forecasting in the automotive sector. However, advances in ML techniques have significantly supplemented the accuracy of predictive models during the last decade, especially since 2015.
Methods used for auto demand forecast in the literature.
| Author | Method used |
|---|---|
| Wetzel & Hoffer (1982) | Regression |
| Kumar et al. (1984) | Regression |
| Arguea et al. (1994) | Regression |
| Abu-Eisheh & Mannering (2002) | Simultaneous equation |
| Lin et al. (2007) | Support vector regression (SVR) |
| Sivak & Tsimhoni (2008) | Regression |
| Shahabuddin (2009) | Regression |
| Brühl et al. (2009) | Time series analysis and data mining |
| Wang et al. (2011) | Adaptive network-based fuzzy inference system (ANFIS) |
| Hülsmann et al. (2012) | Data mining algorithms |
| Sa-ngasoongsong et al. (2012) | Vector Error Correction Model |
| Wang & Choi (2013) | Regression |
| Kitapci et al. (2014) | Regression, Neural network |
| Lee & Kang (2015) | Regression |
| Fantazzini & Toktamysova (2015) | Search engine data analysis |
| Tang & Wu (2015) | BP neural network based on genetic algorithm |
| Farahani et al. (2016) | Artificial neural network, Analytical hierarchy process |
| Gao et al. (2017) | Hybrid particle swarm and ant colony optimization (HEPA) |
| Bottani et al. (2021) | Neural network, Ensemble algorithm |
| Kaya et al. (2022) | Multi-layer perceptron neural network |
| Qu et al. (2022) | Support vector regression (SVR) |
Methodology-wise, several studies were found relevant to this study after a comprehensive literature review, revealing prior researchers' efforts to evaluate the effectiveness of these techniques regarding automotive demand. Recent studies employed various ML techniques, such as artificial neural networks (e.g., Bottani et al., 2021; Farahani et al., 2016; Kaya et al., 2022; Qu et al., 2022), based on model modification or integration efforts.
In summary, the studies above provide evidence of the ML techniques' superior accuracy and robustness in automotive demand forecasting compared to traditional mathematical models. However, the studies reveal the following common limitations: a) a need for a thorough evaluation of the performances of the various ML techniques, b) real-world application of the models, such as prediction at a firm level, and c) further considerations for using hybrid data (endogenous+exogenous).
Besides, extant literature has focused on the demand forecast at a market or country level by identifying decisive factors. Data-wise, the prior studies considered the following significant factors: vehicle/oil price, GDP, population, interest/exchange rate, consumer sentiment index, government policy, advertising expenses, inventory, vehicle registrations, unemployment, poverty rate, holidays, tax, export/import volume, housing price, stock market index, and other leading economic indices (see Table 2). Scholars mainly used macroeconomic data as input to predict the demand at a 'market level.' Little research has been conducted at a firm-level demand forecast that uses endogenous variables such as a firm's internal operation/transaction data.
Factors affecting auto demand.
In summary, the three following gaps are discovered based on the literature review's results for relevant research associated with this paper's primary aim and interest. First, limitations in the usage of model data; most prior researchers focused on exogenous or macro-level data to build their demand forecast model (e.g., Fantazzini & Toktamysova, 2015; Kitapci et al., 2014; Qu et al., 2022). Second, there are methodology limitations; despite recent scholars' efforts in modeling, most prior researchers have depended on traditional mathematical techniques, such as regression, or relied on human intuition, such as the analytical hierarchy process in prioritizing input factors for the ML model, until lately (e.g., Farahani et al., 2016; Lee & Kang, 2015; Wang & Choi, 2013). Third, there are forecast scope limitations, as the existing literature tried to make broadly generalized models focusing on the market or country level (e.g., Gao et al., 2017; Kaya et al., 2022; Tang & Wu, 2015), regardless of emerging business organizations' practical needs to realize firm-level precise forecast models that provide acceptable error levels for real-world operation. To date, research on specific firm-level automobile demand forecast models is hardly found in the literature.
Demand forecasting is generally tricky since models are volatile and sensitive to various factors. However, synthesizing firm-specific factors with exogenous econometric indicators can bring more predictability and explanatory power to the model, thereby benefiting the firm and enabling business (Yasir et al., 2022). Thus, this study hypothesizes that the hybrid input-data forecast model will help establish a precision approach. It also hypothesizes that an ML-assisted model can offer advantages over statistical approaches in terms of accuracy, analytical capabilities (Chowdhury, 2019), and multi-factor data handling (Chen et al., 2018).
The purpose of this study is to explore and describe the capabilities of an ML-assisted hybrid-input automobile demand forecast model. The research does not include hypotheses for testing since testing an underlying theory is not the primary purpose or scope of this paper. Instead, this study focuses on the descriptive nature of quantitative research. Furthermore, it endeavors to answer the research question to verify and compare the ML modeling possibilities based on integrative input data and evaluate the significant factors that affect firm-level automobile demand, which indicate differences from the previous literature.
Ultimately, the paper seeks to combine the use of a firm's internal data and multiple exogenous variables to achieve sophisticated auto demand prediction. Previous studies have focused on causality (i.e., investigating which independent variable had the most significant influence on the dependent variable), and research that compares various predictive methodologies is still limited. In the next steps of this empirical study, the performances of ML-based models are compared while we examine the importance of independent factors that affect firm-level vehicle demand.
Machine learning in social science and relevant domain researchML automates data analysis and helps researchers build analytical models by learning patterns from a given dataset with minimal human intervention based on its foundation in artificial intelligence (SAS, 2021). The mathematical weights learned from the dataset can help predict future events (Flach, 2012). In other words, machine learning is an algorithm that allows a computer to self-learn the properties and patterns in the data.
ML is one of the fastest-growing computer science fields and is being applied to numerous disciplines and research, proving its value in data analytics (Chen et al., 2018). However, despite its advantages, applying ML in social science remains limited. The use of computational methods such as ML in social science has occurred relatively late compared to natural science (Lazer et al., 2009) due to the gaps between computer science and social science (Grimmer, 2015). Moreover, computer science often designs models and draws results directly from raw data, regardless of theoretical backgrounds (Rudin, 2015). Hence, understanding the prevalent gaps in both practices is critical to utilizing ML for social science that profoundly deals with qualitative methods and assumptions (Chen et al., 2018).
There is criticism of applying ML in social science, regarding the cost and additional effort it requires, since traditional statistical approaches are considered "good enough" to solve problems/infer causalities from social issues (Gilliland, 2020). However, researchers and practitioners must bring ML to business research since artificial intelligence (AI) has proved its potential (Brynjolfsson & Mcafee, 2017) and offers a significant advantage over traditional statistical approaches (Chowdhury, 2019). ML also enables social scientists to process large amounts of data with multiple factors to infer unseen relations among constructs buried in data. At the same time, ML also has weaknesses. First, the interpretation of results is complex, and the algorithms are error-susceptible. Further, human judgment is essential in making critical decisions (Schühly et al., 2020), such as fine-tuning learners and adjusting hyperparameters to achieve better prediction accuracy and improved quality in other metrics (Chen et al., 2018). In this regard, utilizing ML in a hybrid and supplemental way, in line with statistical methods, would enable researchers and practitioners to maximize the benefits of both practices (Gilliland, 2020).
Further, AI/ML's application in the automotive sector has expanded recently. The techniques are utilized in highly technical areas, such as manufacturing facility optimization using sensor-based data, automated preventive maintenance of production lines (e.g., Syafrudin et al., 2018; Theissler et al., 2021), or realizing autonomous/connected cars (i.e., Tubaro & Casilli, 2019). They are also applied to process management areas such as logistics optimization (i.e., Chiang et al., 2016) and CS management (i.e., Meinzer et al., 2017). Given its extended application in the automotive sector and significant potential in the relevant research field, it is reasonable to adopt ML in this paper for enhanced demand forecast capability.
Predictive models in machine learningThis study employed five ML algorithms to compare their predictive performance. Neural Network, Ensemble (Stack) model, and regression learners such as Linear Regression, Random Forest, and SGD were considered to build prediction models for automobile demand. For the analytical procedure and model training, the study utilized the Orange machine learning version 3.27.
Linear regressionLinear Regression belongs to statistics and ML and is also one of the most prevalent algorithms used in ML (Brownlee, 2016). Linear regression approaches to model the relationship between a scalar response (dependent variable) and one or more explanatory (independent) variables (Freedman, 2009). Linear regression in ML finds the relationship between input and output in numerical values. There is an argument that sales prediction is closer to a regression problem. Empirical evidence shows that regression approaches often provide better prediction results than time series models (Pavlyshenko, 2019).
Neural networkArtificial Neural Network (ANN) is based on a Perceptron (a unit conducting certain computations to detect features in the input data) inspired by a human neural network (Rosenblatt, 1958). Neural network research has witnessed rapid progress since the introduction of Backpropagation algorithms (see Figure 1) as a learning method for Multi-Layer Perceptrons (MLP) with hidden layers (Rumelhart et al., 1985). MLP is a supervised learning algorithm that learns a function by training on a dataset. It learns a non-linear function approximator in classification and regression problems (Scikit-learn, 2020).
Random forest
Random Forest (RF) is an ML learner used for regression and classification tasks. After its introduction, Breiman (2001) further advanced RF to improve the known limitations of the Decision Tree (a non-parametric supervised learner before RF). RF provides superior predictive performance, even with multiple input variables, and offers stability. It is also free from overfitting (an undesirable ML behavior providing accurate predictions for trained dataset but not for new dataset) problems based on the law of large numbers (the frequencies of events with the same likelihood even out) resulting from randomness (Breiman, 2001). It is required for researchers to find optimal hyperparameter settings through trial and error (Heaton, 2008).
SGDStochastic Gradient Descent (SGD) is a popular algorithm and is widely used for various ML models, such as logistic regression, support vector machines (SVM), and graphical models (Finkel et al., 2008). The SGD algorithm has been considered for linear regression learner training, and with the backpropagation algorithm, it is also applied to artificial neural networks (LeCun et al., 2012). SGD learner in Orange machine learning 3.27 uses a stochastic approximation of gradient descent to minimize a loss function with a linear function. It approximates an actual gradient by considering samples one by one and updating the model based on the loss function gradient. SGD is helpful for sparse datasets, especially in regression problems.
Ensemble (Stack)Ensemble methods are techniques found in both statistics and ML. They combine multiple ML models to improve prediction performance (Opitz & Maclin, 1999; Polikar, 2006; Rokach, 2010). Supervised ML algorithms search through a possible ground to find a more reasonable hypothesis that will contribute to better prediction results in a particular problem (Blockeel, 2010), consolidating multiple hypotheses. There has been empirical evidence that ensemble learners tend to generate better results if a notable diversity exists between composing models (Kuncheva & Whitaker, 2003; Sollich & Krogh, 1996).
Research designAnalytical procedureThis study proposes a reliable vehicle demand forecast model by examining each ML algorithm's possibilities and identifying the decisive factors of predictive models. The study followed the analytical procedures detailed below.
First, data collection and feature selection: Input/output variables required for the modeling were collected to be processed under two categories: a) Endogenous factors within the organization's operational procedures (firm-level data) and b) Exogenous factors that might affect automobile demand. Second, data preprocessing and sampling: The study considered the adequate data sampling method and adopted the Bootstrap method that assigns accuracy by inferring the sample from the population statistic (Efron & Tibshirani, 1994; Varian, 2005). Bootstrap helps reduce overfitting and strengthens the stability of the ML algorithms (Joshi, 2020), and a sample larger than 100 may lead to reasonably accurate estimation performance (Goodhue et al., 2012). Third, model preparation and the hyperparameter setting: The mathematical characteristics of each algorithm were confirmed, and the parameters of ML algorithms were adjusted accordingly to obtain an optimized result. Fourth, training and validation: The learning results of the five models were compared and evaluated through ten sets of cross-validation processes. Fifth, evaluation of the predictive models: Each model's prediction performance was confirmed by model scores, including MSE, RMSE, MAE, and coefficient of determination (adjusted R2). Sixth, feature evaluation: Features were evaluated by the RReliefF algorithm (Robnik-Šikonja & Kononenko, 1997, 2003) and put in order to investigate their influence on prediction results and performance.
Data collection and feature selectionThis study collected monthly data from a South Korean firm from January 2011 to October 2020 to build a vehicle demand forecast model based on ML. This study focuses on auto demand forecast at the firm level. Thus, selecting an adequate region to analyze the data is critical. The company is a local distributor of the world's largest carmaker. It is one of the few distributors with an independently developed and managed local IT system to provide integrative data. Furthermore, South Korea tops the list of the most innovative economies (Bloomberg, 2021). The country produces 3.5 million cars annually and ranks No. 5 globally (MOTIE, 2021). Because of the above, and to compare the performance of auto demand forecast models while investigating how the predictors influence the modeling process, South Korea was deemed a suitable region for analysis.
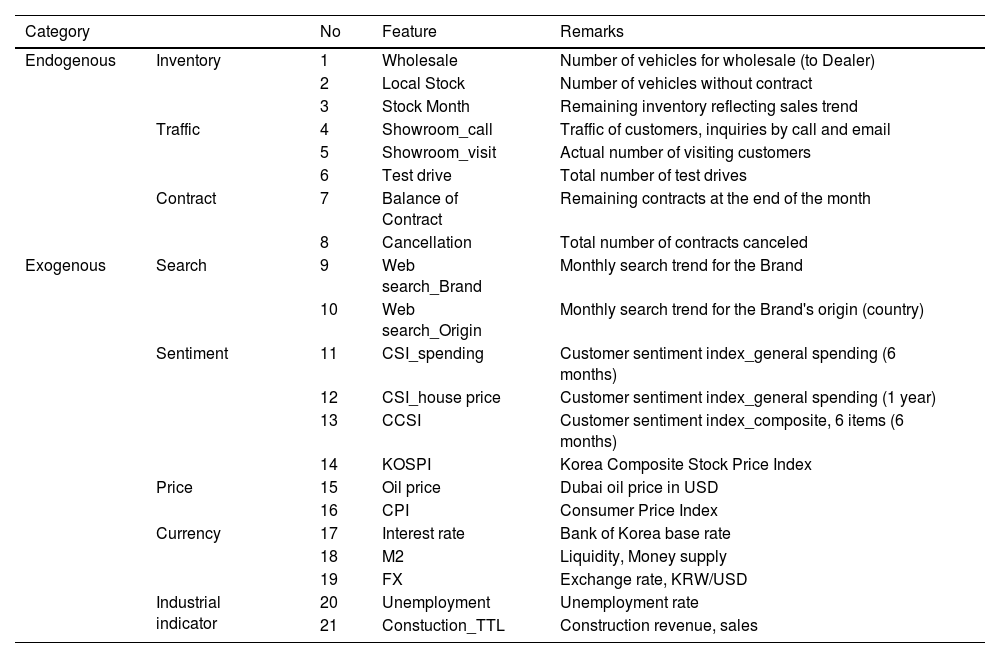
Input data consists of internal factors (endogenous variables), which involve a firm's operational figures, and external factors (exogenous variables), which reflect macroeconomic conditions. Finally, a total of 21 factors were selected. The input data selected for the analysis are shown below (see Table 3). The study utilized the operational data (demand and supply) of a global premium brand imported to the South Korean market as endogenous variables. The brand has international manufacturing bases. However, the sales of the vehicles are a local phenomenon heavily affected by the country's particular socio-economic contexts and environment. This paper thus focuses on the local factors and decides to design ML models based explicitly on the South Korean market to provide higher predictive power. The firm has eight major dealerships across the country with 27 showrooms and 31 service networks. The firm's integrative mission-critical system (DMS, dealer management system) processes all the relevant data required to maintain the business across the country. It connects the global headquarters network, the company, and the local dealers based on real-time data transactions such as vehicle production, logistics, sales, service, parts information, accounting, and human resources, further expanding to other sub-systems. The DMS provides information on the sales processes of the firm, becoming an accurate and reliable data source for analysis.
Selected features and target.
*Endogenous features: Firm data.
*Exogenous features: Economic Statistics System, Bank of Korea / Google trend.
*Period: Month.
*Target: Vehicle registration.
Among relevant data, eight variables (wholesale, stock month, local stock, cancellation, balance of contract, number of customer inquiries, showroom visitors, and test drive) were selected (items 1 through 8). All were deemed closely related and were accepted as endogenous modeling variables. For exogenous variables, 13 factors were chosen. The study referred to the Economic Statistics System (BOK, 2021), which supports reliable government-backed national macroeconomic data, to collect eleven variables (items 11 through 21) and to Google Trends for the keyword search statistics to collect two variables (items 9 and 10). The study excluded price to keep the model's parsimony, eliminating promotional effects. Individual income was also excluded regarding difficulties in data gathering for ML modeling. The year and month were included as metadata. Lastly, as the model's target variable, the brand's retail sales (vehicle registration) data was used from Jan. 2011 to Oct. 2020. The monthly sales result was 714 units on average for the whole period. The lowest number was 181 units in Apr. 2011, and the highest was 1,982 units in Oct. 2018.
ResultModel preparationThis study used the supervised learning technique to generate feasible predictive models. Researchers take optimum models with minimum generalization errors in the ML process through repetitive trials in hyperparameter settings. Each learner's algorithm and the applied hyperparameters are as follows (see Table 4).
Machine learning predictive models.
*Sampling type: Bootstrap, deterministic.
*Data instances: 118.
*Features: 21.
*Meta attributes: year, month.
*Target: Vehicle registration.
After finishing the hyperparameter setting and training on the bootstrap sample, ten-fold cross-validation for five predictive learners was conducted on the original dataset. The cross-validation algorithm divides the data into a certain number of folds and tests models using examples from the first fold. The process repeats until all folds are tested and validated (Orange, 2016). The actual target variable values and the prediction results derived by learning algorithms were validated to evaluate each model's predictive performance. This study adopted multiple evaluation criteria to determine the most reliable model with the highest prediction accuracy. Finally, four metrics—MSE, RMSE, MAE, and R2—were selected (Botchkarev, 2019).
MSE (mean squared error) measures an estimator's quality and always has non-negative values that are not zero (Lehmann & Casella, 1998). The smaller the value, the more reliable the regression model. It displays an average deviation or error squared values between the actual and estimated values. Squared error loss is a broadly applied loss function due to its mathematical convenience in loss calculation. It has advantages and mathematical benefits in a linear regression model's performance analysis, explaining the variance identified by the model and randomness. Despite its weaknesses in applying to particular functions, MSE is usually suitable for approximating a loss function (Berger, 1985).
RMSE (root mean square error) is a widely accepted accuracy measure of the differences between values predicted by an estimator (a model) and the observed values, which aggregates the magnitudes of the predictions' errors. It compares multiple models' predictive errors for a dataset (Hyndman & Koehler, 2006). These deviations are residuals (estimation sample) and prediction errors in out-of-sample cases. It always has non-negative values, and smaller values (close to zero) indicate a better fit for the data.
MAE (mean absolute error) indicates how close the predictions are to an event's outcomes. It measures errors between predicted versus observed data and is a popular measure in time series analysis (Hyndman & Koehler, 2006), explained by the average absolute distance between X and Y. MAE is conceptually more straightforward than RMSE when calculating. Usually, RMSE has larger values than MAE (Pontius et al., 2008).
R2 (r-squared, coefficient of determination) is the proportion of the variance in the dependent variable predicted from the input variable. It is used for statistical models that test hypotheses or predict future outcomes. R2 explains how well the observed data is replicated by the model based on the total variance of outcomes (Draper & Smith, 1988; Glantz & Slinker, 1990; Steel & Torrie, 1960). In essence, R2 represents a regression model's goodness of fit, examining the residual sum of squares (SSR) with the total sum of squares (SST). The closer the R2 value is to 1, the better the model is fitted.
The predictive performance of five ML models was evaluated using the four metrics. The result confirmed that Stack, the ensemble learner, showed the lowest error in three error metrics (MSE=13853.536, RMSE=117.701, MAE=76.688, R2=0.901). Linear Regression showed the second-highest performance next to Stack (MSE=13868.963, RMSE=117.767, MAE=78.772, R2=0.901), and SGD was the third (MSE=15299.848, RMSE=123.693, MAE=89.075, R2=0.891). When measuring prediction errors, Random Forest (MSE=16160.398, RMSE=127.124, MAE=85.476, R2=0.885) and Neural Network (MSE=20398.813, RMSE=142.824, MAE=107.683, R2=0.854) followed the other models. Also, the Stack learner showed the best explanatory power among all five learners (R2=.901). R2 was higher than SGD (R2=.891), RF (R2=.885), and Neural Network (R2=.854) and equal to Linear Regression (R2=.901). The evaluation result revealed that the Stack learner's performance in predicting automobile retail demand was superior to the other four models. Evaluation results are shown below (see Table 5).
Model scores.
* Sampling type: Stratified 10-fold Cross-validation.
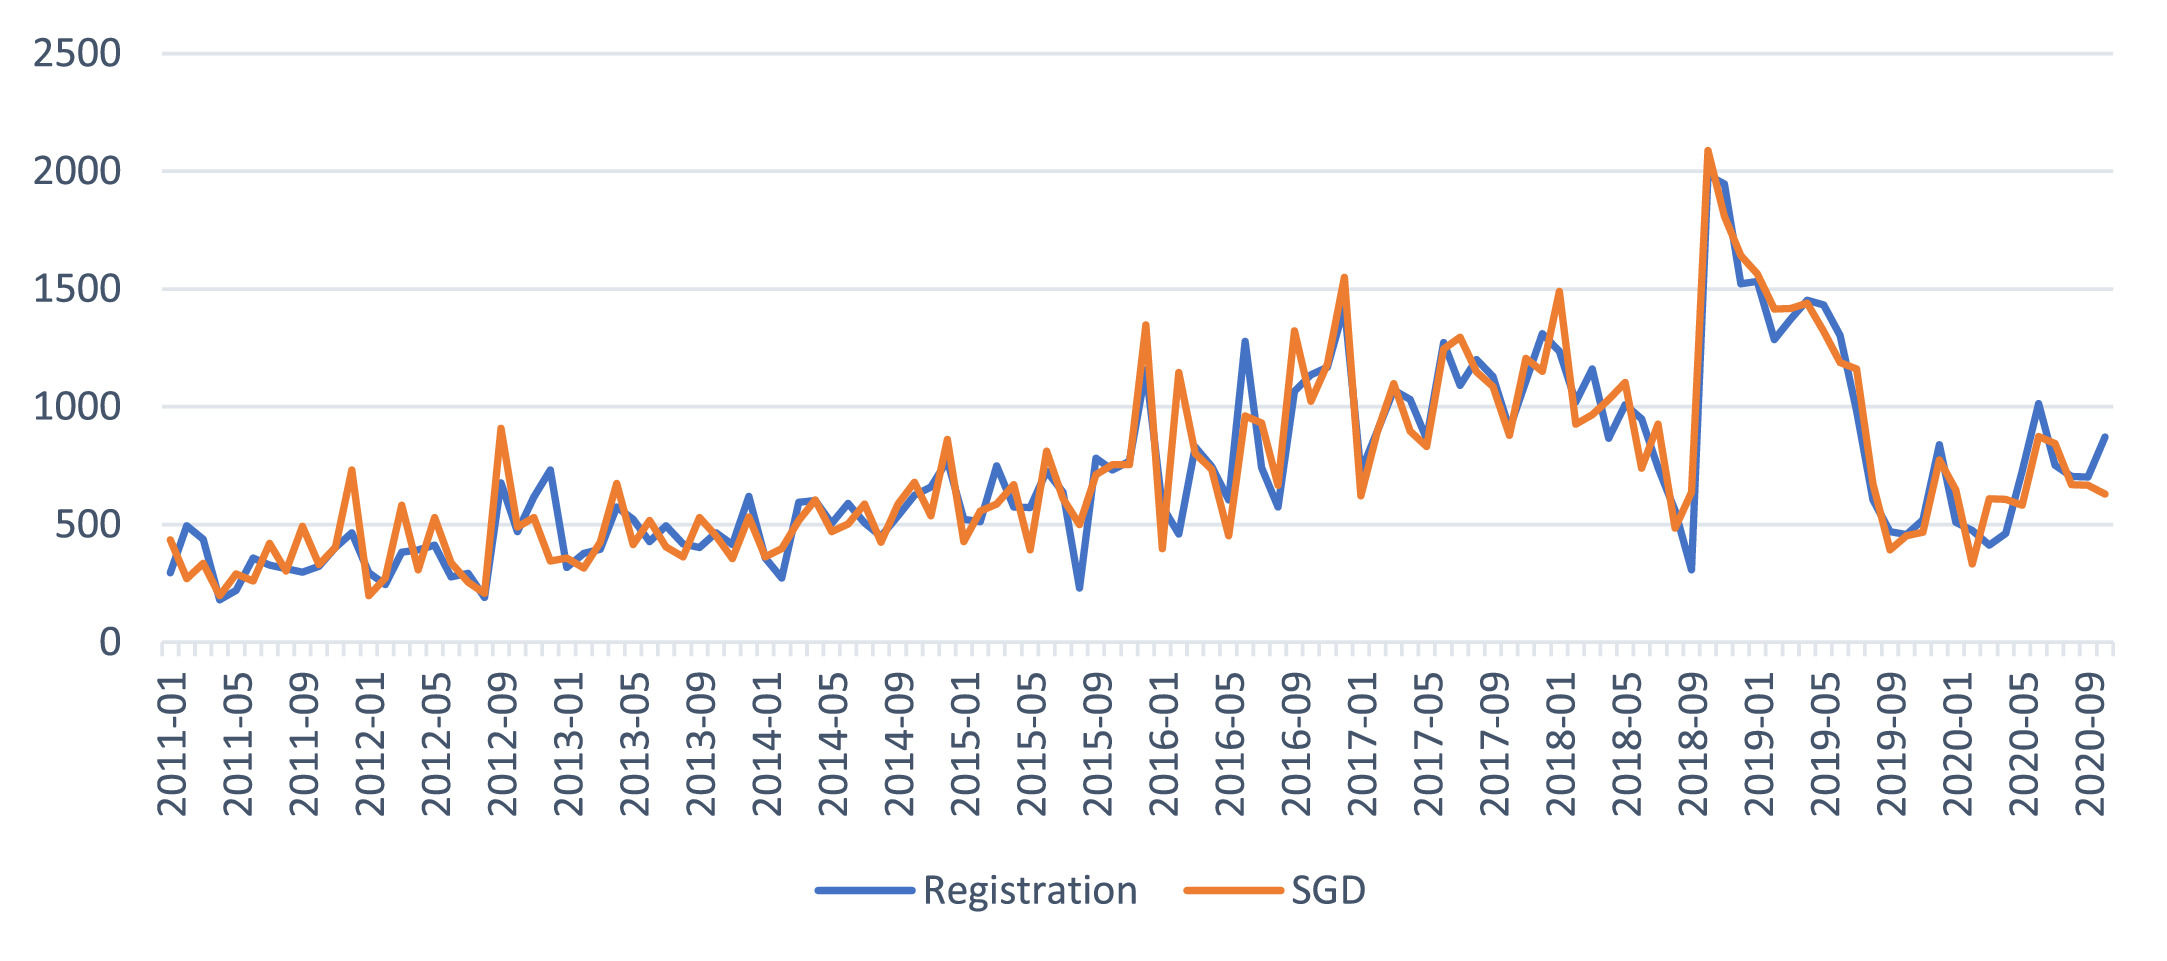
The graphs comparing the actual vehicle demand for the past ten years and forecast values derived by each ML learner through supervised learning are presented below. As explained, the Stack learner presented the trends most similar to the actual demand (See Figs. 2–6).


The RMSE matrix below compares the model performance (see Table 6). The number means the probability that the model anchoring to the row is better than the model corresponding to the column. The matrix indicates that Stack is superior to other models in prediction error.
Model comparison by RMSE.
* Table shows probabilities that the score for the model in the row is higher than that of the model in the column
The study also analyzed which variable contains the required information quality for automobile retail demand. RReliefF was adopted as a metric for the factor analysis. RReliefF is noise-tolerant, robust, and suitable for feature selection (Pernek et al., 2012) and can be utilized in various settings, such as data preprocessing, regression tree learning, and weighting in inductive programming (Robnik-Šikonja & Kononenko, 1997). From the ML standpoint, the factors reflected in predictive model construction are not equally important (Yang et al., 2008). A larger value means a more significant influence on the regression (Son et al., 2015), and its value is always greater than zero (Robnik-Šikonja & Kononenko, 2003).
The RReliefF result revealed that Wholesale had the most significant influence among endogenous factors (21.6%). Also, the top 5 factors included CSI house price (20.8%), Stock Month (17.6%), KOSPI (17.3%), and FX (16.8%), indicating that these factors have a close relationship with the prediction result. Among the top 10 factors, there were five endogenous variables: wholesale, stock month, test drive, showroom call, and balance of contracts. There were five exogenous variables: CSI house price, KOSPI, FX, web search origin, and M2. RReliefF result was as follows (see Figure 7). In summary, it is understood that endogenous variables can also contribute significantly to complex demand forecasting.
Discussions
The results of the study are summarized as follows: First, ML models provide firms with adaptability options for different situations based on model availability. Firms can choose the most suitable ML models for optimal performance regarding the conditions such as the field/industry characteristics, the data occurrence cycle, and the size of the available dataset. Comparing various learners' performances confirmed that there might be differences in forecast capabilities, despite the same input data. Apart from algorithm differences, the dataset size and training method may have affected the performance. While Ensemble (Stack) displayed best-in-class performance, the gaps in explanatory power among other ML models were relatively insignificant and showed moderately consistent performance. The Stack model showed the least error compared to the actual data and displayed the highest R2 index, transforming relatively weak learners into one single combined, stronger learner. The independent learner with the highest performance was Linear Regression. Linear Regression indicated little difference in variance explanation and showed low error indices. The third was SGD, and the fourth was Random Forest. However, in error evaluation by MAE, RF indicated a better result than SGD. The neural network showed the lowest predictive performance. The poor performance of the neural network could be attributed to the size of the dataset. Despite 10-year sales data input, the learner might have needed more training (monthly data, 118 instances, 2011 ∼ 2020). The bootstrap-aggregated sample inferred from the conceivable population statistic (Efron & Tibshirani, 1994; Varian, 2005) might not have been satisfactory during the preprocessing. The neural network might be eligible for higher performance if the sample size could be increased, i.e., using daily or weekly sales data.
Second, adopting endogenous/exogenous variables revealed the priorities in predicting automobile demand and helped to achieve a more robust and solid demand accuracy, thus highlighting the effectiveness of hybrid input data. Firms can consider various forms of macro data when planning business activities and can formulate new strategies by reflecting the local economy's unique features and contextual factors while utilizing operational/transactional data within the company. Exogenous factors such as consumers' perceptions of house prices, the stock market situation, the exchange/interest rate, web search results, the money supply, construction sales, CPI, unemployment, and oil prices significantly influence auto demand. Increasing GDP or household income positively affects commercial and passenger vehicle sales (Patra, 2017). This study's results are consistent with previous research in this domain.
Interestingly, the study indicates that a rise in house prices and the stock market are two of the exogenous variables that significantly influence consumers' car purchase decisions. Rising house and securities prices could mean an increase in disposable household income. Previous researchers have argued with empirical data that the housing wealth effect might directly connect to consumption, such as new car purchases, which are reasonable indicators and a proxy for consumer sentiment (Gillitzer & Wang, 2015). In South Korea, real estate accounts for 76% of household assets (Baek, 2020). Therefore, the increased value of real estate (disposable income) might stimulate the sale of durable goods such as automobiles. Furthermore, capital gains and dividend payments from stocks are known to have a linear relationship with household consumption (Di Maggio et al., 2020). In this regard, a bullish stock market could lead to higher auto demand. The influence of other exogenous variables was also consistent with the results of previous literature. FX and web search results (brand origin) also affect auto demand. The brand analyzed in the study is an imported car brand that is susceptible to changes in the exchange rate. The country in which the brand originates has a delicate geopolitical relationship with South Korea, and boycotts are likely to occur when political issues arise. Hence, it is understood that online search results could also be a useful indicator (i.e., Fantazzini & Toktamysova, 2015).
Among the operational/transactional data used as endogenous variables, the wholesale data appeared to have a strong relationship with auto demand. Moreover, test drive, stock month, showroom traffic (call, visit), and contract balance indicated a close relationship with sales. In conclusion, the result suggests that it is essential to integrate the firm internal data and macroeconomic, exogenous variables to build a more solid demand forecast model of more practical applications.
ConclusionThis paper answered the research question to verify and compare the ML modeling possibilities based on integrative and synthesized input data and evaluated the significant factors affecting the firm's automobile demand, which are apparent differentiation from the recent literature, contributing to the knowledge innovation of the automotive sector. This study presents theoretical contributions as follows. First, hybrid data utilization for firm-level precision; the study expands the domain of knowledge by utilizing the hybrid input data while examining less-introduced factors influencing auto demand. The findings can help understand factors affecting consumers' car purchases in an economic context. Also, incorporating data within a company as endogenous variables could improve precision at the firm level. A considerable error might lower a predictive model's applicability if it is based solely on market data. Second, methodological advancement in ML application for auto demand forecast; in the literature, most of the existing auto demand forecast studies have relied on traditional methods. These studies have focused on explanation-oriented parametric models to identify determinants and marginal effects, leading to the reliability issues of demand forecasting. Further, relatively new ML-adopting studies since 2015 also presented shortcomings (e.g., Bottani et al., 2021; Farahani et al., 2016; Kaya et al., 2022; Qu et al., 2022), calling for an academic need for a thorough comparison of ML performances that connects to real-world applicability. This study displayed the optimal building process of ML demand forecast models free from the limitations above. Five predictive algorithms' applicability was examined through performance evaluation, further contributing to the theoretical expansion of the related research field. The managerial implications are presented as follows. The study highlighted the significant business needs for company-level ML demand prediction. Scholarly studies dealing with auto demand forecasting at the firm level still need to be expanded. Artificial intelligence could intensify business operations, supplementing human experience or intuition. Since demand forecasting in the automotive sector is strategically vital, managers may not want to depend on a single method in making decisions. Managers can integrate machine accuracy and human intuition, supporting better decision-making and playing a critical role in letting ML collaborate more effectively in field operations.
Limitations and future researchThis study has several limitations. First, more regional/industrial characteristics should be considered. Future researchers may consider expanding the same research to other industries, cultures, and markets. The model presented in this study is inherently subject to specificities in the South Korean auto market. Future researchers may consider tuning their ML models to avoid bias when the internationality of the product-specific factors (i.e., specifications, options, grades) or market-specific factors such as consumers' preferences over the products persist. Second, the size of the dataset was limited. This study used monthly sales data for ten years of a particular imported car brand. To maximize ML potential, inputting more data instances may be considered. An ML algorithm's training effectiveness for non-linear learners, such as Neural Network, could be reinforced, leading to better accuracy with big data. This study trained models based on bootstrap-aggregated samples followed by ten-fold cross-validation for performance evaluation. A separate test set was not prepared. Researchers can consider additional tests to avoid issues such as overfitting when sufficient data is secured.
This study presents suggestions for future research as follows. First, most of the existing literature dealing with ML prediction has focused on comparing models' performance (Kok et al., 2017). Future researchers may want to explore new independent variables in their models. Since consumer behavior is rapidly expanding online and via mobile, it would be valuable to examine digital leads or digital traces as input data for accurate demand forecast models for business at a firm level. Second, as Gilliland (2020) suggested, ML research can be developed in a hybrid form with traditional statistical models. Future researchers will be able to enhance the effectiveness of business research by combining the advantages of both worlds.