


This study uses biform game models to examine firms’ patent deployment strategies that involve a choice between appropriating a patented technology to gain a unique competitive advantage or licensing the technology to a competitor in the product market. It addresses the question of under what circumstances firms use a patent appropriation strategy over a licensing strategy, or vice versa. By incorporating competitive and cooperative settings, this study develops theory and propositions to illustrate the mechanisms by which patent deployment strategies are chosen by an innovator or follower in a product market as a function of the characteristics of innovation, transaction costs, bargaining power, strategic interactions, and other market conditions. This study contributes to the literature by distinguishing between patent appropriability and value appropriation in a transactional network under rivalry. The model and its extensions provide new insights into appropriation strategies for patent portfolios, which are important intellectual assets in a knowledge-based economy.
In knowledge-based economic settings, patenting strategies have become essential parts for above average firm performance (Huang & Li, 2019; Savage et al., 2020). A critical strategic choice for a firm's leverage of patent portfolios relates to which domains to focus management efforts and attention. At a high level, a firm may seek to maximize patent value either by sustaining an inimitable strategic position based on the exclusivity value patented innovation creates, or by licensing its patents to increase cooperative profits in an industrial network (Hall et al., 2014; Trigeorgis et al., 2022). In this context, appropriation strategies encompass creating unique competitive advantages through aggressive knowledge isolations, emphasizing the differentiated ability to lower costs or provide value (Ernst et al., 2016; James et al., 2013; Somaya, 2012). Licensing strategies may involve cooperative profits and transaction costs in terms of negotiation costs, contract formation, and contract fulfillment (Kani & Motohashi, 2012). For example, Apple and Samsung use an appropriation strategy to deter their competitors through patent protection. Simultaneously, they license their patents to competitors (including cross-licensing). How do firms then choose their patent deployment strategies (appropriation or licensing)?
Despite the rich understanding of patent deployment strategies in the literature, primarily from the perspectives of resources, complementarity, ability, and appropriation regime (Sun & Zhai, 2018), our knowledge of patent deployment strategies does not extend far beyond supply-side factors, as prior research has not revealed how appropriation potential, such as patent portfolios, helps firms create and capture value in a transaction structure (Hurmelinna-Laukkanen & Yang, 2022; Trigeorgis et al., 2022). Theoretically, a patent deployment strategy should include the protection of, and profit from, patented innovation. However, previous studies have mainly focused on a protection approach based on the analysis of supply-side factors and have therefore ignored the mechanisms underlying strategic decisions of profiting approaches and outcomes (e.g., Ahuja et al., 2013; Hurmelinna-Laukkanen & Yang, 2022; Teece, 1986). As a result, the patent appropriability puzzle—how to leverage patents to realize their appropriability potential and generate profits in a transaction structure—persists (e.g., Fisher & Oberholzer-Gee, 2013; Yang et al., 2021; Somaya, 2012). This study aims to advance the literature by examining how to choose different patent deployment strategies to create and capture value from patents in a transaction network.
Specifically, by focusing on the factors that impact firms’ patent deployment strategies, we draw insights from existing research and propose several propositions that we examine and extend in our biform models. These testable propositions involve the value of patented innovation, bargaining power, costs of patent deployment strategies, licensing fees, complementary patents, the threat of substitution, and constraints on production capacity (Arora et al., 2001; Bouet, 2015; Ceccagnoli, 2009; Hall & Ziedonis, 2001; Polidoro & Toh, 2011). By incorporating competitive and cooperative perspectives, this study seeks to deepen our understanding of how these factors influence firms’ patent deployment strategies.
We developed a formal model to highlight the theoretical tensions between the appropriation and licensing of patents. The biform game model is suitable for solving the current dilemma and systematically developing the theoretical landscape of appropriability strategies (Hannah et al., 2021; Hurmelinna-Laukkanen & Yang, 2022; MacDonald & Ryall, 2004). Specifically, biform game theory provides a key theoretical framework and tool for understanding the mechanism of patent value creation and value capture from a coopetition perspective (Brandenburger & Nalebuff, 1996; Hoffmann et al., 2018). In a coopetition setting, we build models that analyze how patent deployment strategies shape a competitive landscape and then affect transaction structures that determine the value creation and capture of market participants. By doing so, we illustrate how patent deployment strategies can be leveraged to create competitive value in collation and bargaining for a greater share of the created value (Gans & Ryall, 2017; Ross, 2018; MacDonald & Ryall, 2018).
This study contributes to the literature in several ways. Our primary contribution is distinguishing between patent appropriability and patent value appropriation (Hurmelinna-Laukkanen & Yang, 2022). We elaborate on how patents can be leveraged to create and capture value in an industrial collation. We treat innovators and followers differently in terms of their technological inventions, positions, strategies, and outcomes. This allows us to overcome the existing empirical research, which assumes that firms face similar competitive circumstances (Ceccagnoli, 2009). Secondly, we highlight how patent deployment strategies may shape a competitive landscape that could influence value distribution among firms and buyers. Under different industrial environments, firms’ combinations of patent deployment strategies can determine market structure collations, which subsequently affect market participants’ value capture (Ross, 2018). Third, we incorporate innovation heterogeneity, technological complementarity, capacity constraints, and transaction costs in a framework that links different theoretical logics and provides new insights into firms’ patent deployment strategies (Hurmelinna-Laukkanen & Yang, 2022; Sun & Zhai, 2018). Finally, this study has the potential to answer the dynamic nature of patent deployment strategies by showing how strategic equilibrium could shift when institutional environments or relative bargaining power change.
Literature reviewThe literature on appropriability strategy has primarily focused on appropriability mechanisms against competitors, that is, how to protect innovation from competitors’ misappropriation (Hurmelinna-Laukkanen & Puumalainen, 2007; Sharapov & MacAulay, 2022; Teece, 1986). These mechanisms involve formal appropriation strategies (e.g., patents, copyrights, trademarks, and design rights) and informal appropriation strategies (e.g., secrecy, confidentiality agreements, design, lead time, and complexity) (Arundel, 2001; Sharapov & MacAulay, 2022). Following the paradigm of innovation management, researchers have mainly studied the topic empirically (Arora, 1997; Brockhoff et al., 1999; Gambardella et al., 2007; Levitas & Chi, 2010) and therefore predominantly answered the research questions from the supply side (Trigeorgis et al., 2022). Relatively few studies have explored appropriation strategies, which elaborate on how a firm can create and capture value in a transaction context (e.g., Ernst et al., 2016; Fosfuri, 2006).
In terms of patent deployment strategies, as a sub-area of appropriability strategies, this line of research also shares the problem of focusing on the supply side and neglecting the fundamental effects of value creation and capture (Hurmelinna-Laukkanen & Yang, 2022). Here, the key paradox is the balance of appropriation or licensing to competitors (Trigeorgis et al., 2022). The mechanisms and boundaries determining when and why innovators choose to appropriate a patented innovation instead of licensing it to competitors are essential questions in this research topic (Kani & Motohashi, 2012). The literature has provided rich insights into this research topic from the micro, meso, and macro perspectives.
From the micro perspective, the characteristics of firms and their rivals influence patent deployment strategies (Mihm et al., 2015; Reitzig & Puranam, 2009). For a focal firm with patented innovation, it must compare the benefits and costs of different patent deployment strategies based on different dimensions. An exclusivity appropriation strategy protects a firm's proprietary advantage and, therefore, promotes market share and profits. (Ceccagnoli, 2009). Licensing strategy, on the other hand, generates royalty revenue but may also damage the firm's margin, market share, and competitive advantage (Fosfuri, 2006). When a firm is more capable of building its propriety advantage, it may adopt a competitive and exclusive approach. For example, firms with large size, higher market share, or specialized complementary assets are more likely to adopt an exclusive strategy (Arora & Ceccagnoli, 2006; Gambardella et al., 2007). On the rivals’ side, their demands, capabilities, and threats could affect the firm's patent appropriation strategies (Arora & Gambardella, 2010; Fosfuri & Giarratana, 2010; Kani & Motohashi, 2012). For a dyad relationship, transaction costs and the bargaining process between a firm and its rivals should also be considered when evaluating patent deployment strategies. Furthermore, firms’ strategic orientations can influence their patent deployment strategies. For example, patents involved in the development of industry standards are more likely to be licensed, whereas patents related to core competitive strength are less likely to be licensed (Shapiro & Varian, 1999; Somaya, 2003).
From a meso perspective, patent deployment strategies vary across industries based on the heterogeneity in technological characteristics and industrial structures (Arora, 1997). In industries with complex technologies or dense patent thickets, such as the electrical equipment industry, where patents for main products are dispersed among industry incumbents, it is more probable that firms leverage their patents by cross-licensing to avoid the hold-up problem (Cohen, Nelson, & Walsh, 2000; Grindley & Teece, 1997; Hall & Ziedonis, 2001; Kani & Motohashi, 2012). In contrast, in industries with discrete products, where firms can produce products largely based on their own patent portfolios, a defensive appropriation strategy is more likely to be adopted (Reitzig, 2004). Considering the degree of innovation in industries characterized by incremental innovation, an offensive appropriation strategy is more likely to be adopted for higher strength and frequency of competition than in industries exhibiting radical innovation (Ceccagnoli, 2009). Further, the degree of imitability or substitutability of products in a market influences differentiation and competition between firms. Low differentiation enhances the motivation for offensive patent appropriation strategies (Arora & Fosfuri, 2003; Hill, 1992; Polidoro & Toh, 2011). Likewise, in a mature market with a high level of organizational and product isomorphism, intense market competition and long-term equilibrium would increase licensing propensity (Fosfuri, 2006; Gambardella et al., 2007; Kani & Motohashi, 2012; Motohashi, 2008).
From a macro perspective, patent deployment strategies are shaped by institutional factors such as laws, norms, and culture (Hurmelinna-Laukkanen & Yang, 2022; Gans et al., 2008; Gans & Stern, 2003; Somaya, 2012; Teece, 1986). Institutional protection of patent rights provides jurisdictional foundations for the licensing and exclusivity of patent rights (Barros, 2021; Lanjouw & Schankerman, 2001). The institutional enforceability of patent rights and transaction costs determine the trade-off between appropriation strategy and licensing strategy (Arora et al., 2001; Bouet, 2015). All else being equal, an efficient and effective patent infringement remedy will significantly increase the motivation of the appropriation strategy, although it also enhances the probability of licensing (Huang, 2017). High transaction costs and moral risk decrease the motivation for licensing strategies (Kani & Motohashi, 2012). Norms are also important factors that affect patent deployment strategies (Holgersson et al., 2018).
Existing research has shed light on and provided abundant insights into patent deployment strategies. However, there are two theoretical deficiencies. Firstly, it mainly focuses on supply-side factors that form strategic potentials based on self-reflection and experience and, therefore, neglects the transaction structure composed of both supply- and demand- sides of agents and their strategic interplay (Hurmelinna-Laukkanen & Yang, 2022; Trigeorgis et al., 2022). The transaction structure builds a basic framework for understanding agents’ strategic interactions and the micro-foundations of value creation and capture derived from patent deployment strategies (Hoffmann et al., 2018). Secondly, along with increasingly complex business environments, the coopetition relationship, other than pure competition or cooperation, has been less explored in the literature on patent portfolio management (Brandenburger & Stuart, 1996; Gans & Ryall, 2017; Trigeorgis et al., 2022). To improve the theoretical landscape of patent management, the theory of why and when different patent deployment strategies were adopted should be examined from the coopetition perspective. We are aware of the work done by Trigeorgis et al. (2022) studying patent deployment strategies. Our study differs from their research in two respects. Firstly, we emphasize the structural effects of the transaction network formed by the supply and demand sides using a formal biform game model instead of a real option game model. Secondly, we elaborate on the mechanisms of value creation and value capture derived from transaction networks.
By incorporating insights from existing empirical and theoretical research, we summarize and refine several testable propositions that can be examined and extended in our biform models. Firstly, the value of patented innovation is positively related to the adoption of an appropriability strategy (Ceccagnoli, 2009). The more valuable a patented innovation is, the higher the motivation to appropriate it by exclusive institutions in a competitive setting. Secondly, bargaining power is positively related to the use of an appropriability strategy (Gambardella et al., 2007). Firms with asymmetric assets that can support bargaining capability, such as large size and specialized complementary assets, may be more likely to choose an appropriability strategy (Arora & Ceccagnoli, 2006). Third, from a comparative perspective, the relative costs of appropriability and licensing strategies affect the adoption of patent deployment. That is, when the costs of the appropriability strategy are higher than those of the licensing strategy, a focal firm is more likely to use a licensing strategy (Arora et al., 2001; Bouet, 2015). Fourth, licensing fees are positively related to the probability of choosing a licensing strategy (Huang, 2017). Fifth, firms are more likely to use licensing strategies in hold-up situations where rivals possess complementary patents (Hall & Ziedonis, 2001; Kani & Motohashi, 2012). Sixth, the substitution threat of patented innovation may motivate patent owners to use a licensing strategy (Reitzig, 2004). Finally, constraints on production capacity may lead firms with patented innovations to use licensing strategies that can bring them more licensing profits (Polidoro & Toh, 2011). The remainder of this paper is organized as follows. Firstly, we derive the basic insights of our theory via a baseline biform game model. This baseline model provides a basic framework for incorporating firms’ patent deployment strategies, their effects on transaction structure, and the subsequent value creation and value capture outcomes. We then extend the baseline model by setting up a typical interactive context, which provides more insights into the interplay between an innovator and a follower. Finally, we discuss the implications and limitations of our study.
The modelsBaseline modelOur model is built on the framework of the biform game theory, which synthesizes non-cooperative game theory and coalitional game theory (Brandenburger & Stuart, 1996). The biform game model is suitable for our research topic for two reasons. Firstly, analyzing the choice of patent deployment strategies requires the integration of competition and cooperation, which is consistent with the framework of the biform game theory (Feess & Thun, 2014). Secondly, to illustrate the connection between patent deployment strategies and economic outcomes, the biform model provides new insights into the process of value creation and capture.
We begin by setting up a baseline biform game model that specifies players and their possible collations for value creation. The biform game model is formed in two stages: competitive and cooperative (Brandenburger & Stuart, 1996; Gans & Ryall, 2017). The competitive stage involves players’ strategic competition and outcomes, leading to different competitive landscapes (Chatain & Zemsky, 2007). The cooperative stage defines the possibility of value creation through different collations. Depending on a player's added value, degree of being needed to create value in a network, and bargaining power, the value capture of the player can be elaborated by the “core,” representing the value appropriated from the network (MacDonald & Ryall, 2004).
The core is a central concept in the theoretical framework of the biform game theory (Gans & Ryall, 2017). This illustrates the potential arrangement of value distribution among players in a market setting in which no subgroup can be better off by breaking the grand coalition (Almeida Costa & Zemsky, 2021; Jia, 2013). Under the assumptions of feasibility and consistency, the core or the value captured by players is shaped by the opportunity combinations of value creation. The feasibility assumption ensures that the value captured is equal to the value created. The consistency assumption stipulates that agents in a subgroup will not join a coalition if they can create and capture more value on their own (Gans & Ryall, 2017). All potential distributions that meet these two assumptions comprise a core that reflects the competitive landscape of agents from the perspective of strategic management. Specifically, the core indicates that each agent can capture values within the interval [πmin,πmax]. The interval estimate, other than the Shapley value and kernel, among others, is preferable because it provides more insights into agents’ strategic portfolios by incorporating competitive advantages and bargaining power.
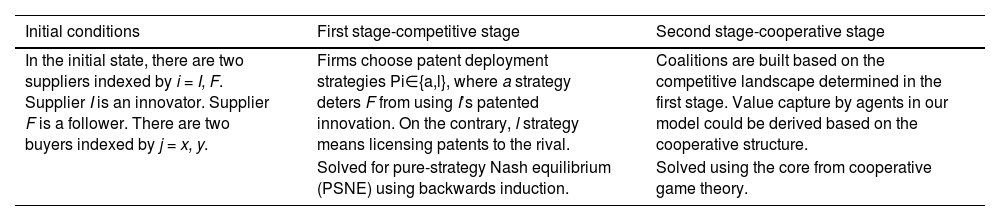
In our baseline model, we first describe the set of players and their possible value creation networks. There are two suppliers indexed by I = I, F. Supplier I is an innovator who initiates a patented innovation and faces the choice of an appropriation or a licensing strategy. Supplier I faces a rival, labeled supplier F for a follower and a potentially disadvantaged supplier. In the market setting, there are two buyers indexed by j = x, y. The suppliers and buyers cannot create value in isolation. That is, a supplier and buyer need to be matched for value creation. Each buyer has demand for one unit of a supplier's product or service; hence, it is to be matched with only one of the two suppliers. Suppliers face capacity constraints. Each supplier can produce only one unit of product or service. Table 1 lists the key activities of the two stages of our model.
Stages and key activities of the baseline model.
| Initial conditions | First stage-competitive stage | Second stage-cooperative stage |
|---|---|---|
| In the initial state, there are two suppliers indexed by i = I, F. Supplier I is an innovator. Supplier F is a follower. There are two buyers indexed by j = x, y. | Firms choose patent deployment strategies Pi∈{a,l}, where a strategy deters F from using I’s patented innovation. On the contrary, l strategy means licensing patents to the rival. | Coalitions are built based on the competitive landscape determined in the first stage. Value capture by agents in our model could be derived based on the cooperative structure. |
| Solved for pure-strategy Nash equilibrium (PSNE) using backwards induction. | Solved using the core from cooperative game theory. |
In the first stage, supplier I decides whether to use appropriation strategy (a) by preventing supplier F from imitating the innovation or using licensing strategy (l) through negotiation of licensing fees. An appropriation strategy entails deterring the effects of patent institutions. Supplier I gains competitive advantage from patented innovation by preventing supplier F’ imitation through an intellectual property protection system. It requires costs ca when monitoring markets and enforcing patent rights. In contrast, the licensing strategy eliminates competitive advantages but incurs licensing fees γ paid by supplier F to supplier I. There are extra transaction costs cl during negotiation of the licensing contract, in addition to the costs of ca to prevent imitation. Thus, the set of feasible patent strategies available to supplier I in the first stage is

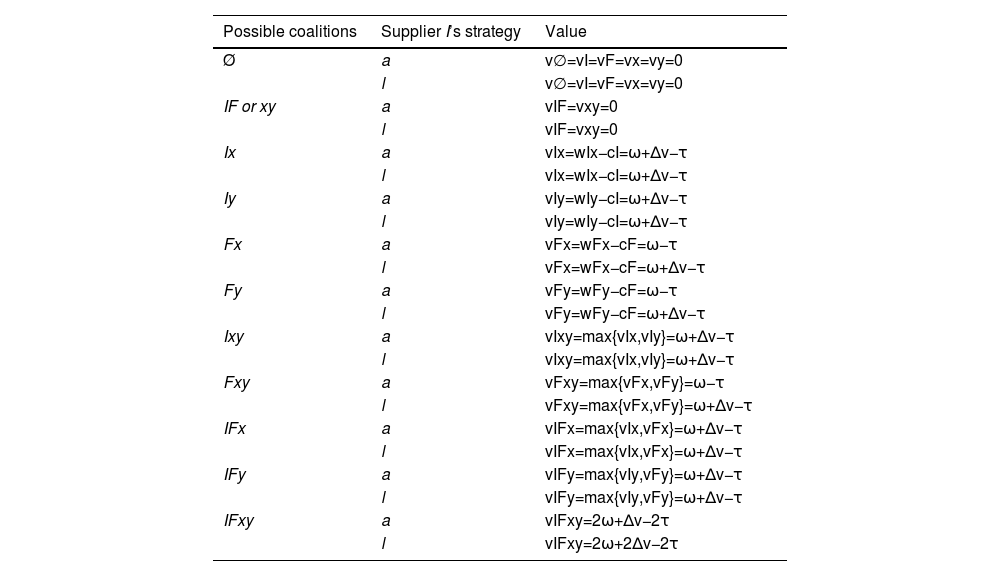
In the second stage, the characteristic function is determined by the value-creation structure of the collation networks (Jia, 2013). We assume that the willingness to pay for the generic product is ω. Buyers have a higher willingness to pay for the innovative product ω + Δv. We constrain our analysis by assuming that Δv≥ca+cl, which indicates that the profits of the innovation exceed transaction costs of patent enforcement.1 Moreover, it is assumed that the product is indivisible during both the production and the transaction stages. Suppliers I and F can produce a unit of product at constant marginal costs of cI = cF = τ, where the subscript denotes the supplier's label. When analyzing the formation of a possible coalition structure, the principle is that no subset of agents can do better by switching to an alternative coalition. Each agent could capture a share of its core πisin a market setting depending on its bargaining power, where πis represents supplier i's profit under a specific scenario S. In our model, no economies/diseconomies of scale are considered in our analysis, therefore externalities are beyond our discussion. The core exists, suggesting that suppliers gain a part of value, and the remainder goes to buyers (Chatain & Zemsky, 2007; Stuart, 2004). Besides, bargaining complementarities is not our concern, indicating that the participation of other agents will not affect a focal agent's added value. The parameter of bargaining power α should be a consistent measure for a supplier's non-competitive capability of appropriating value from a coalition (Chatain & Zemsky, 2007). For simplicity, we assume that α indicates the bargaining power of suppliers over buyers in an industry. A supplier's anticipated value appropriation is calculated as πis=απimax(s)+(1−α)πimin(s)+δ, where δ is the costs or returns of patent strategies in the first stage. Given the strategy of supplier I in the first stage, a buyer prefers a supplier with a higher willingness to pay. The value created by a possible coalition equals the difference in total willingness to pay and total costs. The value created by every possible coalition is presented in Table 2.
Value created by all possible coalitions.
| Possible coalitions | Supplier I’s strategy | Value |
|---|---|---|
| Ø | a | v∅=vI=vF=vx=vy=0 |
| l | v∅=vI=vF=vx=vy=0 | |
| IF or xy | a | vIF=vxy=0 |
| l | vIF=vxy=0 | |
| Ix | a | vIx=wIx−cI=ω+Δv−τ |
| l | vIx=wIx−cI=ω+Δv−τ | |
| Iy | a | vIy=wIy−cI=ω+Δv−τ |
| l | vIy=wIy−cI=ω+Δv−τ | |
| Fx | a | vFx=wFx−cF=ω−τ |
| l | vFx=wFx−cF=ω+Δv−τ | |
| Fy | a | vFy=wFy−cF=ω−τ |
| l | vFy=wFy−cF=ω+Δv−τ | |
| Ixy | a | vIxy=max{vIx,vIy}=ω+Δv−τ |
| l | vIxy=max{vIx,vIy}=ω+Δv−τ | |
| Fxy | a | vFxy=max{vFx,vFy}=ω−τ |
| l | vFxy=max{vFx,vFy}=ω+Δv−τ | |
| IFx | a | vIFx=max{vIx,vFx}=ω+Δv−τ |
| l | vIFx=max{vIx,vFx}=ω+Δv−τ | |
| IFy | a | vIFy=max{vIy,vFy}=ω+Δv−τ |
| l | vIFy=max{vIy,vFy}=ω+Δv−τ | |
| IFxy | a | vIFxy=2ω+Δv−2τ |
| l | vIFxy=2ω+2Δv−2τ |
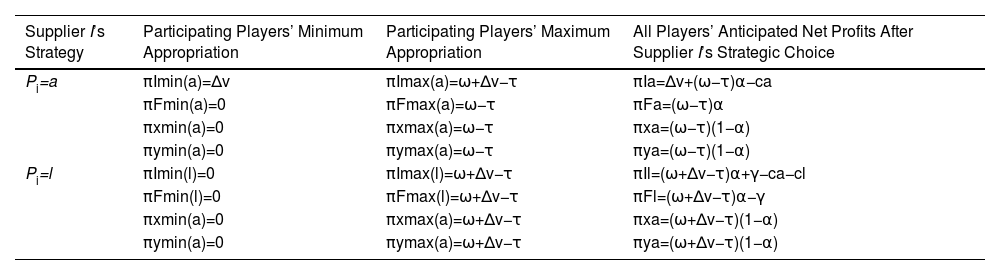
Let πIPIand πFPI indicate supplier I and supplier F’s captured value in the second stage, given supplier I’s first-stage choice of patent strategy, respectively. Let [πImin(PI),πImax(PI)] and [πFmin(PI),πFmax(PI)] be the suppliers’ ranges of possible payoffs that are consistent with insights of the core. . Because the properties of our model conform to constant marginal utility, constant marginal cost, no product complementarities, and no network economies, the added value of any supplier can be computed by the added value in all transactions with the buyers. Based on the possible value creation of coalitions in Table 2, the minimum and maximum amounts of value that each supplier can be derived, as shown in Table 3. Further, the suppliers’ anticipated net profits under the different scenarios are listed in Table 3.
Minimum, maximum, and anticipated payoffs in second-stage game under various market participation scenarios.
| Supplier I’s Strategy | Participating Players’ Minimum Appropriation | Participating Players’ Maximum Appropriation | All Players’ Anticipated Net Profits After Supplier I’s Strategic Choice |
|---|---|---|---|
| Pi=a | πImin(a)=Δv | πImax(a)=ω+Δv−τ | πIa=Δv+(ω−τ)α−ca |
| πFmin(a)=0 | πFmax(a)=ω−τ | πFa=(ω−τ)α | |
| πxmin(a)=0 | πxmax(a)=ω−τ | πxa=(ω−τ)(1−α) | |
| πymin(a)=0 | πymax(a)=ω−τ | πya=(ω−τ)(1−α) | |
| Pi=l | πImin(l)=0 | πImax(l)=ω+Δv−τ | πIl=(ω+Δv−τ)α+γ−ca−cl |
| πFmin(l)=0 | πFmax(l)=ω+Δv−τ | πFl=(ω+Δv−τ)α−γ | |
| πxmin(a)=0 | πxmax(a)=ω+Δv−τ | πxa=(ω+Δv−τ)(1−α) | |
| πymin(a)=0 | πymax(a)=ω+Δv−τ | πya=(ω+Δv−τ)(1−α) |
In the second stage, if PI = a, supplier I's minimum appropriated value is Δv. As πFmax(a)<πImax(a), supplier F's maximum appropriated value is less than supplier I's maximum appropriated value. This reveals that the appropriation strategy gives supplier I competitive advantage and guarantees minimum return from joining transactions. The appropriation strategy also provides supplier I more added value to the transaction network. In our model, the value of innovation is appropriated by the innovator, supplier I in our model. If PI = l, more value is created, and there is no competitive advantage for supplier I. Supplier I’s minimum value appropriation decreases to 0. Both suppliers can receive values from 0 to ω+Δv−τ in the second stage.
EquilibriumThe solution concept for a biform game is a Nash equilibrium in the first stage, with payoffs determined by strategic choices in the first stage and point estimates of the core value in the second stage. Supplier I compares πIa with πIl to determine whether to choose a or l. Supplier F compares πFa and πFl to determine whether to accept a licensing deal. Proposition 1 summarizes the equilibrium.
Proposition 1
At equilibrium, supplier I chooses l ifΔvα≥randr≥Δv+cl−Δvα, and chooses a otherwise.
Considering the choice of appropriating or licensing patented innovation, innovative supplier I may face the following counterbalancing forces in deciding patent strategies. Firstly, the appropriation strategy generates superior value and competitive advantage for supplier I, and as this value is appropriated by supplier I, supplier I may be incentivized to use the appropriation strategy. This effect is stronger in the parameter space in which the value of Δv is higher and the costs of the appropriation strategy are lower, both of which lead to higher net profit for appropriation strategy. The effect is also stronger when the suppliers have fewer bargaining skills (i.e., αis smaller), which makes the appropriated value Δv more attractive for supplier I and thus renders supplier I more likely to adopt the appropriation strategy. Secondly, the license fee constitutes the “opportunity costs” of the appropriation strategy and thus reduces supplier I's incentives to appropriate patented innovation. The second effect is stronger in the parameter space where the license fee is higher, making it more likely for supplier I to adopt the licensing strategy.
Furthermore, if supplier I uses the licensing strategy, it is also required that supplier F is better off. Otherwise, supplier F does not accept the licensing deal. This places more constraints on supplier I’s strategic choices. Integrating the two suppliers’ perspectives, if both suppliers have comprehensive expectations on the payoff of the second stage and the license fee is negotiable (i.e., r is a variable), supplier I chooses the licensing strategy only when α≥Δv+cl2Δv. Although the innovator can create more value by licensing a patented innovation, they will only choose the licensing strategy when it can capture more value in bargaining with buyers.
In addition to the individual supplier's profit, the total surplus of the industry is a central issue when analyzing the equilibrium of a system. It is shown that at equilibrium, when α≥Δv+cl2Δv, supplier I chooses the licensing strategy. The total value created by suppliers and buyers reaches its maximum, 2ω+2Δv−2τ−ca−cl, and all participants obtain more profits, which is socially efficient. However, when α<Δv+cl2Δv, supplier I chooses the appropriation strategy. The total value created by the industry is 2ω+Δv−2τ−ca, which is a suboptimal total surplus. The suboptimal total surplus suggests that institutional factors which intend to reduce transaction costs in patent enforcement will help increase the potential space for a better total industry surplus. Finally, note that the bargaining skills of supplier I’s bargaining skills play a more important role when the supplier chooses a licensing strategy. The appropriated value in the second stage is solely determined by “pure bargaining” factors (MacDonald & Ryall, 2004). Therefore, supplier I’s incentive to use the licensing strategy increases when it has higher bargaining skills.
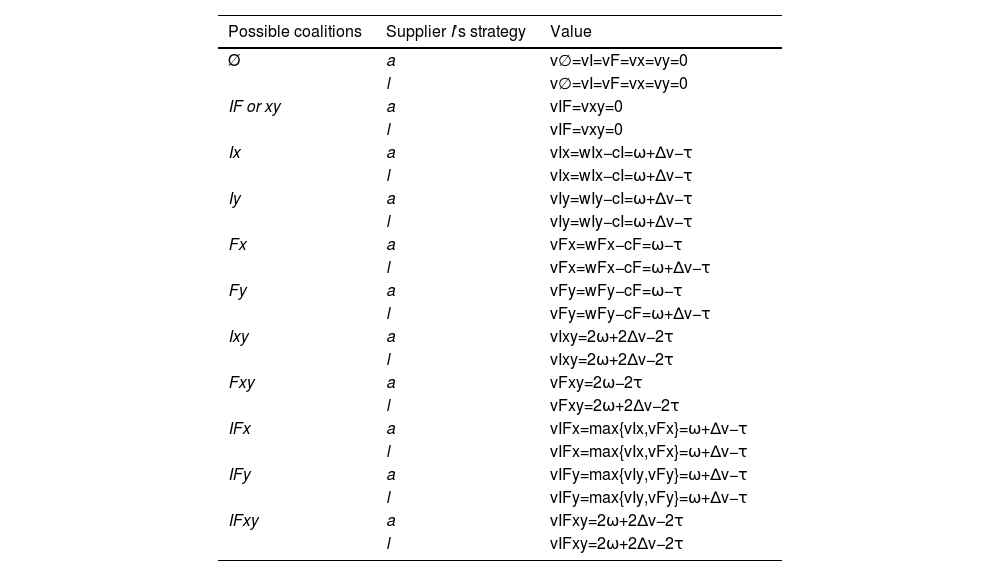
Model extension 1: Without capability constraintsWe now extend the baseline model to release the assumption of capability constraint, which means that suppliers have the capability to provide two units of products or services to buyers in the market with constant marginal costs, as in the case of the B2B software industry (Almeida Costa & Zemsky, 2021). Following the same derivation process, the values created by all possible coalitions are shown in Table 4, and the minimum, maximum, and anticipated payoffs of players are shown in Table 5. We can see that suppliers with capabilities to provide more products actually confront a situation in which suppliers compete for serving buyers, which drives more value to buyers.
Value created by all possible coalitions in Model Extension 1.
| Possible coalitions | Supplier I’s strategy | Value |
|---|---|---|
| Ø | a | v∅=vI=vF=vx=vy=0 |
| l | v∅=vI=vF=vx=vy=0 | |
| IF or xy | a | vIF=vxy=0 |
| l | vIF=vxy=0 | |
| Ix | a | vIx=wIx−cI=ω+Δv−τ |
| l | vIx=wIx−cI=ω+Δv−τ | |
| Iy | a | vIy=wIy−cI=ω+Δv−τ |
| l | vIy=wIy−cI=ω+Δv−τ | |
| Fx | a | vFx=wFx−cF=ω−τ |
| l | vFx=wFx−cF=ω+Δv−τ | |
| Fy | a | vFy=wFy−cF=ω−τ |
| l | vFy=wFy−cF=ω+Δv−τ | |
| Ixy | a | vIxy=2ω+2Δv−2τ |
| l | vIxy=2ω+2Δv−2τ | |
| Fxy | a | vFxy=2ω−2τ |
| l | vFxy=2ω+2Δv−2τ | |
| IFx | a | vIFx=max{vIx,vFx}=ω+Δv−τ |
| l | vIFx=max{vIx,vFx}=ω+Δv−τ | |
| IFy | a | vIFy=max{vIy,vFy}=ω+Δv−τ |
| l | vIFy=max{vIy,vFy}=ω+Δv−τ | |
| IFxy | a | vIFxy=2ω+2Δv−2τ |
| l | vIFxy=2ω+2Δv−2τ |
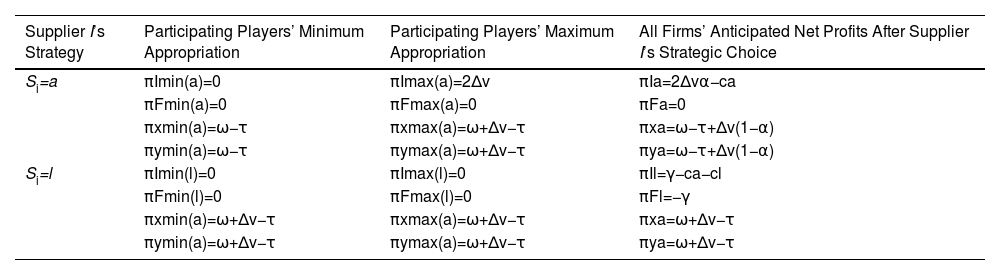
Minimum, maximum, and anticipated payoffs under various scenarios if there is no capacity constraint.
| Supplier I’s Strategy | Participating Players’ Minimum Appropriation | Participating Players’ Maximum Appropriation | All Firms’ Anticipated Net Profits After Supplier I’s Strategic Choice |
|---|---|---|---|
| Si=a | πImin(a)=0 | πImax(a)=2Δv | πIa=2Δvα−ca |
| πFmin(a)=0 | πFmax(a)=0 | πFa=0 | |
| πxmin(a)=ω−τ | πxmax(a)=ω+Δv−τ | πxa=ω−τ+Δv(1−α) | |
| πymin(a)=ω−τ | πymax(a)=ω+Δv−τ | πya=ω−τ+Δv(1−α) | |
| Si=l | πImin(l)=0 | πImax(l)=0 | πIl=γ−ca−cl |
| πFmin(l)=0 | πFmax(l)=0 | πFl=−γ | |
| πxmin(a)=ω+Δv−τ | πxmax(a)=ω+Δv−τ | πxa=ω+Δv−τ | |
| πymin(a)=ω+Δv−τ | πymax(a)=ω+Δv−τ | πya=ω+Δv−τ |
Compared with the range of core payoffs of the baseline model, when supplier I uses the appropriation strategy, the minimum appropriable value for supplier I decreases to 0, which contradicts the expectation that greater production capability for innovators gives a stronger competitive advantage to supplier I. Thus, supplier I may capture less value in an industry without capability constraints. Supplier F cannot capture any value in this situation. When supplier I chooses the licensing strategy, no supplier can capture the value in the second stage. Because no supplier's product provides more value, all values are captured by buyers because of fierce competition for buyers. For supplier F, accepting a license deal is always a suboptimal situation, πFa=0>πFl=−γ. Therefore, in equilibrium, supplier I always chooses the appropriation strategy. We propose the equilibrium in Proposition 2.
Proposition 2
At equilibrium, supplier I always chooses the appropriation strategy
Compared with Proposition 1, the parameter space in which supplier I chooses the licensing strategy is significantly altered by the reshaped industrial structure because of the assumption of no capability constraint. That is, increased competition for serving buyers in the product market drives supplier F to accept the appropriation strategy, except when γ<0. Supplier I will never deal with a negative license fee. Therefore, the equilibrium is an appropriation strategy. Otherwise, buyers capture all values in the licensing strategy. In theory, this is consistent with the explanation that more intense and full competition will increase the probability of an appropriation strategy for larger market share and profits. We elaborate on the explanation that the fundamental force behind these scenes is the competitive and cooperative structure.
Finally, as higher production capability and more intense competition make it more attractive for supplier I to choose the appropriability strategy, the total industry surplus is higher compared with the situation when supplier I makes the same strategic choice in the baseline model. However, the surplus is captured mainly by buyers. Supplier F did not appropriate any value from the industrial setting. This insight has several new implications for the understanding of patent strategies. For example, when suppliers’ bargaining power is sufficiently small, although the total industry surplus is suboptimal, suppliers are better off if they do not expand their production capacity.
Model extension 2: Strategic interactions between two suppliers when supplier F has invented and patented around supplier I's innovationWe now introduce Model Extension 2, in which competition is not indicated by production capacity but rather modeled as an interactive strategy between the two suppliers. In Model Extension 2, we assume that facing a radical innovation initiated by supplier I, supplier F has invented and patented around the innovation. Each supplier can decide whether to license its patent to the competitor with the same transaction costs. That is,

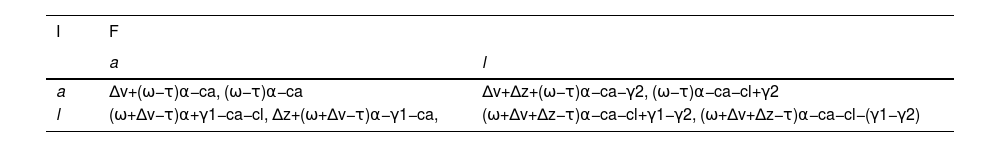
We assume that when both suppliers’ innovations are used by a supplier, the buyers have a willingness to pay for the product ω + △v + △z (the value added by supplier F’s invention around supplier I’s innovation is △z). The buyers have a willingness to pay for the product ω when supplier F is not licensed to use the original innovation (without the supplier I’s radical innovation, the value of supplier F’s invention could not be realized). We also constrain our analysis by assuming that Δz≥ca+cl, which indicates that the value of supplier F’s invention exceeds transaction costs of patent enforcement. In the first stage, the suppliers I and F choose their patent strategies simultaneously. The licensing fee paid by F to I is γ1. The licensing fee paid by I to F is γ2. If either supplier accepts licensing strategy, the premise is that every supplier is better off. We resume all the other assumptions of the baseline model. Following the settings of the baseline model and Model Extension 1, we discuss the models with and without capacity constraint in Model Extensions 2a and 2b, respectively. We need to develop the characteristic functions under four possible combinations of patent strategies, and under each combination, we need to specify the value created by all possible coalitions of players. Based on the characteristic functions, we derive the core of value appropriation and point estimates that are consistent with the core for the suppliers. The point estimates of Model Extension 2a are listed in Table 6. The equilibrium of the game is summarized as follows.
Proposition 3
In Model Extension 2a, at equilibrium,
- (1)
WhenΔv(1−α)+cl≥γ1andcl≥γ2, the equilibrium of the game is {a, a}. That is, in equilibrium, I chooses the appropriation strategy, and F chooses the appropriation strategy.
- (2)
Whencl≤γ2<Δzand(Δv+Δz)(1−α)+cl≥γ1, the equilibrium of the game is {a, l}. That is, in the equilibrium, I chooses the appropriation strategy, and F chooses the licensing strategy.
- (3)
WhenΔz(1−α)+cl≥γ2andΔv(1−α)+cl≤γ1<Δz+Δvα, the equilibrium of the game is {l, a}. That is, in the equilibrium, I chooses the licensing strategy, and F chooses the appropriation strategy.
- (4)
When(Δv+Δz)(1−α)+cl≤γ1<(Δv+Δz)αandΔz(1−α)+cl≤γ2<Δzα, the equilibrium in the game is {l, l}. That is, in the equilibrium, I chooses the licensing strategy, and F chooses the licensing strategy.
In equilibrium, under the condition of Δv(1−α)+cl≥γ1 and cl≥γ2 (i.e., each supplier asks for a sufficiently low license fee, given the other parameters), both suppliers I and F choose the appropriation strategy. However, the total industrial surplus is the lowest in this situation. This is somewhat counterintuitive because it suggests that patent owners should ask for more license fees for better individual profits and social warfare. Under the condition of (Δv+Δz)(1−α)+cl≤γ1<(Δv+Δz)α and Δz(1−α)+cl≤γ2<Δzα, in equilibrium, both suppliers choose the licensing strategy, which leads to the highest total industry surplus.
Furthermore, we see that the license fee is negotiable in the first stage. Compared with the equilibrium of {a, a}, supplier F could always choose the licensing strategy to increase both suppliers’ profits and total surplus, and when α>Δv−Δz+cl2Δv, supplier I would choose the licensing strategy to further increase both suppliers’ profits and total surplus. Both suppliers would choose the licensing strategy simultaneously to achieve the highest profits and total surplus when α>Δz+cl2Δz. This suggests that an increase in suppliers’ bargaining power incentivizes them to use a licensing strategy.
Then, we turn to Model Extension 2b without capacity constraints, retaining all other settings similar to Model Extension 2a. Following the same procedure, we derive the core of value appropriation and point estimates that are consistent with the core of suppliers. The point estimates of Model Extension 2b are presented in Table 7. The equilibrium of the game is summarized as follows:
Proposition 4
In Model Extension 2b, at equilibrium,
- (1)
When2Δvα+cl≥γ1andcl≥γ2, the equilibrium of the game is {a, a}. That is, both suppliers I and F choose the appropriation strategy.
- (2)
When2Δvα+cl≥γ1andcl≤γ2<2Δzα, the equilibrium of the game is {a, l}. That is, supplier I chooses the appropriation strategy, and supplier F chooses the licensing strategy.
- (3)
When2Δvα+cl≤γ1<2Δzαandcl≥γ2, the equilibrium in the game is {l, a}. That is, supplier I chooses the licensing strategy, and supplier F chooses the appropriation strategy.
In the equilibrium, under the condition of 2Δvα+cl≥γ1 and cl≥γ2 (i.e., each supplier asks for a sufficiently low license fee, given the other parameters), both suppliers I and F choose the appropriation strategy. However, the total industrial surplus is the lowest in this situation. This also suggests that patent owners should ask for more license fees to achieve better individual profits and social warfare. Compared with Proposition 3, when only one supplier chooses the licensing strategy, the industry produces the highest total industry surplus. When both suppliers choose the licensing strategy, the total industry surplus is suboptimal.
Furthermore, we assume that the license fee is negotiable in the first stage. Compared to the equilibrium of {a, a}, when α>cl2Δz,supplier F chooses the licensing strategy to increase both suppliers’ profits and total surplus, and when α>cl2(Δz−Δv) supplier I chooses the licensing strategy to increase both suppliers’ profits and total surplus. This situation happens only when the added value of supplier F’s invention is higher than the value of supplier I’s original innovation. This suggests that when the value of the redevelopment of a radical innovation is sufficiently high, the original innovator with high bargaining skills would license its innovation to the follower. For example, operational systems such as Android and OS provide sufficient value for chip manufacturers to license their technologies to Google and Apple.
Model extension 3: Strategic interactions between two suppliers when supplier F could make substitutionFor a follower, such as supplier F in a market, it often cannot invent around the innovation of the first mover, because the first mover has already built a patent thicket. However, supplier F also has the option of producing a substitution product that has a similar value in a niche market. For example, a latecomer in the information communication technology market could use another technological path to provide similar devices and services in a niche market. That is, supplier I could choose a strategy or l strategy, and supplier F could choose the following strategy f and substitution strategy s with substitution costs cs.

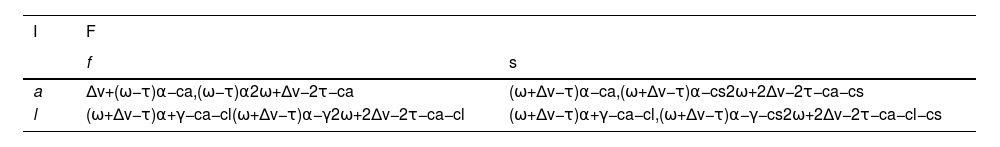
Compared with the settings of the baseline model, Model Extension 3 is a setting in which both suppliers make strategic choices simultaneously. When supplier F uses the following strategy, the structure of the value creation network does not change. When supplier F chooses the substitution strategy and supplier I chooses the appropriation strategy, buyer x has the same willingness to pay ω + △v for supplier F’s product in the niche market. When supplier F chooses the substitution strategy and supplier I chooses the licensing strategy, buyers x and y have the same willingness to pay ω + △v for supplier F’s product. We keep all other assumptions the same with the baseline model. We also discuss the models with and without capacity constraint in Model Extensions 3a and 3b, respectively. We need to develop the characteristic functions under four possible combinations of strategies, and under each combination, we need to specify the value created by all possible coalitions of players. Based on the characteristic functions, we derive the core of value appropriation and the point estimates that are consistent with the core for the suppliers. The point estimates of Model Extension 3a are listed in Table 8. The equilibrium of the game is summarized as follows.
Proposition 5
In Model Extension 3a, at equilibrium,
- (1)
WhenΔv(1−α)+cl≥γandcs≥Δvα, the equilibrium of the game is {a, f}. That is, I chooses the appropriation strategy, and F chooses the following strategy.
- (2)
Whencl≥γ, andcs≤Δvα, the equilibrium of the game is {a, s}. That is, I chooses the appropriation strategy, and F chooses the substitution strategy.
- (3)
WhenΔv(1−α)+cl≤γ<Δvα, the equilibrium of the game is {l, f}. That is, I chooses the licensing strategy, and F chooses the following strategy.
In equilibrium, under the condition of cl≥γ and cs≥Δvα, supplier I chooses the appropriation strategy, and supplier F chooses the following strategy. However, the total industrial surplus is suboptimal in this situation. The highest total industry surplus occurs when the equilibrium is {a, s} or {l, f}, depending on the parameter of csand cl. The strategic combination of {l, s} never occurs in the Model Extension 3a scenario.
Furthermore, we see that the license fee is negotiable in the first stage. If cs
Then, we turn to Model Extension 3b without capacity constraints, retaining all other settings similar to Model Extension 3a. Following the same procedure, we derive the core of value appropriation and point estimates that are consistent with the core of suppliers. The point estimates of Model Extension 3b are presented in Table 9. The equilibrium of the game is summarized as follows:
Proposition 6
In Model Extension 3b, at equilibrium,
- (1)
Supplier I always chooses the appropriation strategy, and supplier F always chooses the following strategy.
In equilibrium, supplier I chooses the appropriation strategy, and supplier F chooses the following strategy when the highest total industry surplus is achieved. In this model, competition to serve buyers drives most of the value created on the buyers’ side. The substitution strategy could not add value to any case. The following strategy is always a better choice for supplier F. {a, f} is the only possible strategic equilibrium portfolio.
Discussion and conclusionsIn this study, we model upstream suppliers’ endogenous choices of patent strategies. In addition, we examine how strategic choices vary in the presence of supplier competition under different scenarios. We find that the equilibrium critically depends on the additional value created by the innovation initiated by suppliers, costs required to enforce patent rights, licensing fees negotiated between suppliers, players’ bargaining skills, and suppliers’ production capabilities. We also find that several results from studies of the model considering suppliers’ strategic interactions are also noteworthy. Below, we discuss the contributions of our study to the literature followed by a conclusion of main findings and future research opportunities.
DiscussionBased on previous literature, this study provides more insights into how firms’ patent deployment strategies are impacted by factors such as the value of patented innovation, bargaining power, costs of patent deployment strategies, licensing fees, complementary patents, the threat of substitution, and constraints on production capacity. The primary enlightenment is that these factors usually entwine together to shape a focal firm's patent deployment strategies in competitive and cooperative activities, where value is created and captured. Statistically, each of these factors influences the probability of a specific patent deployment strategy. In this section, we discuss the impacts of the factors presented by our model to illustrate how our study extends the existing literature.
We find several interesting results that refute previous arguments, and therefore shed new light on the literature. First of all, existing research emphasizes that, due to complementarity, higher bargaining power leads to a higher probability of appropriability strategy (Gambardella et al., 2007). In our models, we show that suppliers are more likely to adopt a licensing strategy when their bargaining power is sufficiently high. The reason is that licensing could make rival suppliers better off when a larger part of increased overall industrial value creation is captured by suppliers, not buyers. This highlights the importance of examining transaction structures in a competitive context when considering patent deployment strategies.
Moreover, when facing hold-up situations and the threat of substitution, previous studies argue that suppliers are more likely to choose a licensing strategy (Huang, 2017; Kani & Motohashi, 2012). In our models, we find that such cognition is far too linear and simple. In other words, the choice of patent deployment strategy is a complex strategic decision that depends on a comprehensive framework that incorporates the benefits and costs of rivals.
Finally, drawing on prior research, constraints on production capacity encourage innovators to use licensing strategies to increase profits (Polidoro & Toh, 2011). Our model provides further details supporting this proposition. Specifically, we find that innovators consistently opt for an appropriation strategy when no capacity constraints are present. To secure a monopoly position, innovators have no incentive to license their patented innovations to their competitors. Consequently, this implies that constraints on production capacity expand the strategic viability of licensing strategies. Our findings complement previous arguments by employing a formal biform game, thus addressing the scarcity of empirical research from the supply side.
ConclusionsThe findings of this study add to our knowledge of patent strategy by examining how patents based on different types of innovation can be leveraged by competing suppliers and considering the implications for financial returns to individual players as well as the whole industry under different competition conditions. The results of our model elaborate how patents can be leveraged to create and capture value in a specific industrial environment (Hurmelinna-Laukkanen & Yang, 2022). The results suggest that, for radical innovation, where followers can innovate but are hard to substitute, nurturing bargaining skills will stimulate suppliers to license complementary patents. For incremental innovation, which is easy to substitute and unnecessary to innovate around, the key factors are cost structure and capacity constraints. When a follower can substitute for innovation, the equilibrium becomes more complicated by considering substitution costs. Without capacity constraints, there is rarely room for licensing and substitution strategies.
In terms of total industry surplus, when a follower can innovate and patent around an innovator's innovation, a hold-up situation occurs when suppliers’ bargaining skills are low, which leads to a suboptimal total industry surplus. The mutual licensing situation, the opposite of the mutual holdup situation, could generate the highest total industry surplus as well as the best individual profits for radical innovation. Higher bargaining skills incentivize suppliers to choose a licensing strategy and increase the total industry surplus because they can capture more value created by the licensing agreement.
Furthermore, the new findings provide more insights to the existing knowledge of cooperation-competition structures in interfirm relationships (Ross, 2018). We show that patent deployment strategies shape a competitive landscape and subsequent value distribution among firms and buyers. The results help us accurately specify the boundary conditions under which competition opposition and licensing agreements are likely to be attained, and if these relationships are likely to influence individual profits and total industry surplus. In addition, because our results point to bargaining power as a scope condition, the bargaining power of suppliers may play a moderating role that strengthens the well-known correlation among patent portfolios, effective patent strategies, and ultimately, economic performance.
The findings of his study present a more comprehensive and systematic perspective of patent strategies that incorporates the perspectives of innovation heterogeneity, technological complementarity, capacity constraints, transaction costs, bargaining power, and market structure (Hurmelinna-Laukkanen & Yang, 2022; Sun & Zhai, 2018). Scholars who consider the choice of patent strategies may gain additional insights beyond the conclusions generated by an analysis of these perspectives alone. Biform game theory provides a great approach for integrating these perspectives (Ross, 2018). This study, in its introduction to the biform game theory, adds to our understanding of patent strategy by revealing that micro-foundations during market transactions are key to further developing patent appropriability strategies (Hannah et al., 2021).
In addition to these results, we believe that this study provides a useful starting point for considering how the features of the biform market structure might affect patent strategies. There are several avenues for future research in this area. For example, although we model a setting in which buyers have sufficient knowledge of suppliers’ products and innovation, in many situations, buyers’ valuations of suppliers involve uncertainties such as brand and personal preferences (Chatain & Zemsky, 2007). Thus, an assumption of variations in buyers’ value estimations might generate new insights that incorporate the effects of market scale in different segmented markets. In addition, we focus on patent assertion entities in the technological area, which is a fundamental and typical case. However, this approach may neglect firms that possess complementary patents (Chen & Wu, 2020). Researchers may wish to consider different combinations of patent strategies for an innovator or the strategic responses of its followers. Adding non-practicing entities to our model may also affect the competitive landscape and strategic equilibrium of market participants. Moreover, from a dynamic perspective, suppliers’ strategic choices may evolve along with the process of competition and mutual learning in the long term (Trigeorgis et al., 2022). Therefore, a static view may limit our insight into the evolution of firms’ patent strategies. The framework of evolutionary game theory and multi-agent simulation may expand our model by considering a dynamic system. Finally, empirical studies can be used to examine and further develop propositions in this line of research (Gans & Ryall, 2017).
Availability of dataData sharing not applicable to this article as no datasets were generated or analysed during the current study.
This research was in part supported by National Natural Science Foundation of China research grants (71902130, 72072124, 72102154, and 72272106), and Fundamental Research Funds for the Central Universities grant B220201060.
In many cases, scholars in patent strategies find that institutional protection for intellectual property is not well enough in some contexts. Transaction costs of patent enforcement, such as patent disputes and negotiations are sufficiently high. However, innovation itself becomes questionable in such contexts if the value created by innovation is less than the costs to enforce the patented innovation.