This study proposes a set of quality indicators for care outcomes in patients with acute cerebral infarction. These indicators are understandable and relevant from a clinical viewpoint, as well as being acceptable and feasible in terms of time required, ease of data capture, and interpretability.
MethodThe method consisted of reaching consensus among doctors after having reviewed the literature on quality indicators in stroke. We then designed and conducted a field study to assess the understandability and feasibility of the set of indicators.
ResultsConsensus yielded 8 structural indicators, 5 process indicators, and 12 result indicators. Additionally, standards of reference were established for each indicator.
ConclusionThis set of indicators can be used to monitor the quality care for stroke patients, identify strengths, and potentially to identify areas needing improvement.
Mediante este estudio se propone un conjunto de indicadores de calidad del resultado en la atención con infarto cerebral agudo. El conjunto de indicadores se caracteriza por ser comprensible, relevante desde el punto de vista clínico-asistencial, aceptable y factible en términos de tiempos de dedicación, facilidad de captura del dato y sencillez de su interpretación.
MétodoTras la revisión de la literatura sobre indicadores de calidad en ictus, se llevó a cabo una metodología de consenso entre profesionales. Posteriormente, se diseñó y ejecutó un estudio de campo para valorar su comprensión y factibilidad.
ResultadosSe han consensuado 8 indicadores de estructura, 5 de proceso y 12 de resultado. Además, se han establecido estándares de referencia para cada uno.
ConclusiónEste conjunto de indicadores permite monitorizar el nivel de calidad de la atención sanitaria, identifican fortalezas y posibilita la identificación de áreas de mejora en la atención a los pacientes con ictus.
The Spanish National Health System's stroke care strategy and the national stroke care plan of the Spanish Society of Neurology's Stroke Study Group have established an organisational model for emergency stroke care.
The effectiveness of reperfusion treatments1–3 is influenced by the narrow risk/benefit margin ( < 4.5h for intravenous fibrinolysis and < 6h for endovascular treatment), requiring reorganisation of healthcare resources and circuits in order to provide care as soon as possible. Code stroke activation has been demonstrated to increase the number of patients benefiting from these specific treatments, since it reduces latency times for in-hospital and pre-hospital care.
In Spain, the QUICK project4 assessed whether response times (from symptom onset to the therapeutic decision in hospitals with a stroke unit) corresponded with those recommended in clinical practice guidelines. The PRACTIC study5 analysed the impact of the specialised neurological care provided by stroke teams or units in reducing mortality rates, in-hospital complications, and the percentage of patients with disability.
Hospitals in the different regional healthcare services vary greatly in the capacity to respond to new stroke cases; place of residence, more than distance to a healthcare centre, conditions access to adequate specialised treatment. For this reason, most care quality indicators for stroke management have focused on process.6–8 In this study, we propose a set of care quality indicators for acute stroke management, which are intended to be understandable and relevant from clinical and healthcare perspectives and acceptable and viable in terms of dedication time; our proposal includes a simple procedure for data collection and interpretation.
MethodsThis study establishes a series of care quality indicators based on the consensus of neurology and healthcare quality specialists. The study was performed from May 2015 to July 2016.
In our study, stroke units are defined as non-intensive acute care units, with a limited number of beds on the neurology ward or pertaining to the neurology department, attending patients with acute stroke exclusively. This management should follow a protocol with pre-established criteria for admission and a specific system for diagnosis and treatment.
Process and outcome indicators were identified in a review of articles published in Spanish and English in the previous 5 years. We used the open-access search engine on the MEDLINE database, with the search terms indicator, stroke, quality assurance, and quality assessment, and combinations thereof. Researchers IN, JJM, and JM selected the articles relevant to the study, and from this selection we drafted an exhaustive list of indicators used in previous studies. From this list, consensus panel members eliminated duplicate articles and ruled out or proposed quality indicators to establish a control panel for these stroke units. In a final session, we agreed a draft set of control, process, and outcome indicators.
Seven neurologists from 6 hospitals subsequently analysed the feasibility (in terms of viability of data recording from current information systems) and the clinical significance of these indicators. Lastly, we conducted a field study to verify the reliability of data in clinical practice, based on the definitions and formulae established for each indicator. For each indicator, we specified: definition, the formula for calculating its value, type of indicator, and acceptable target level (standard).
This study was approved by the research ethics committee of the Universidad Miguel Hernández de Elche (report reference DPF.JJM.03.15).
ResultsWe identified indicators by analysing the titles and abstracts of 48 articles considered potentially relevant. We selected 15 articles, which were the basis for the draft set of indicators to establish a control panel for the monitoring of stroke care quality.
After a debate between working group members, we proposed a series of 8 indicators for control, 5 for process, and 12 for outcome.
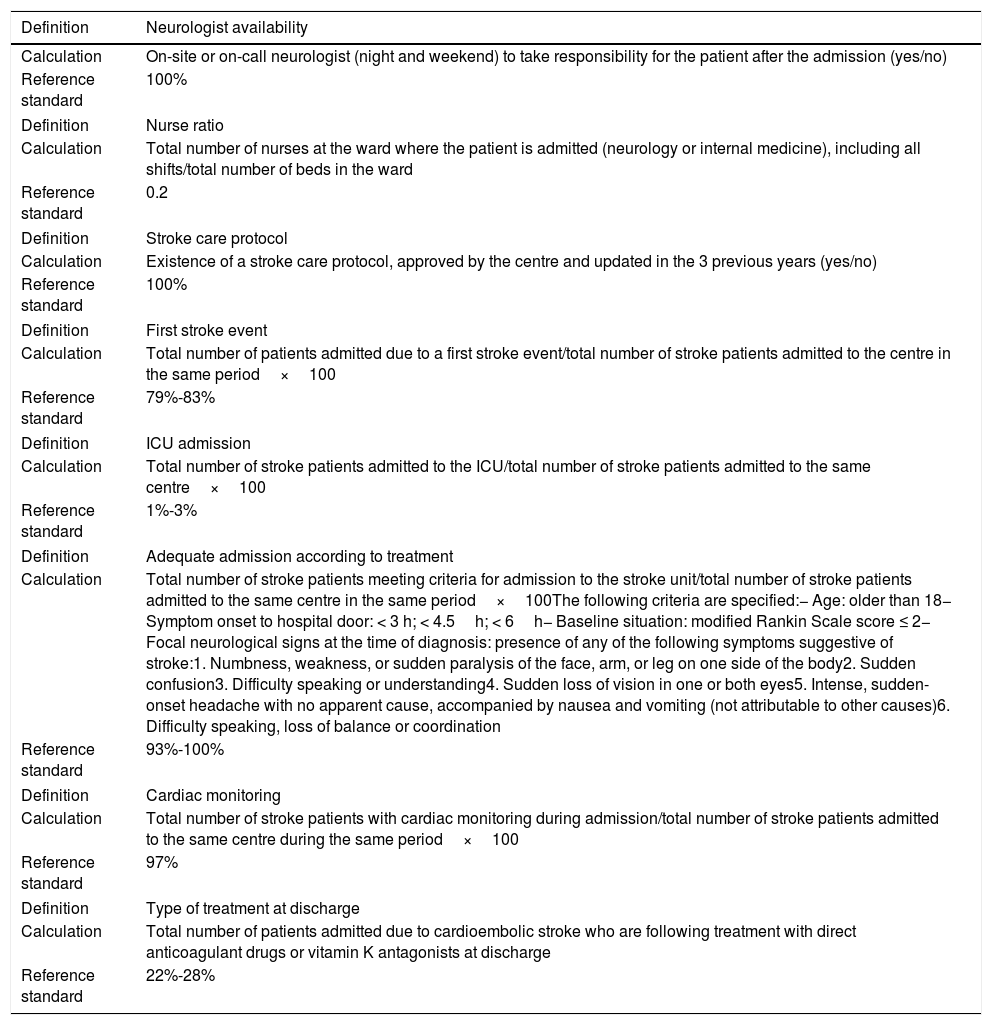
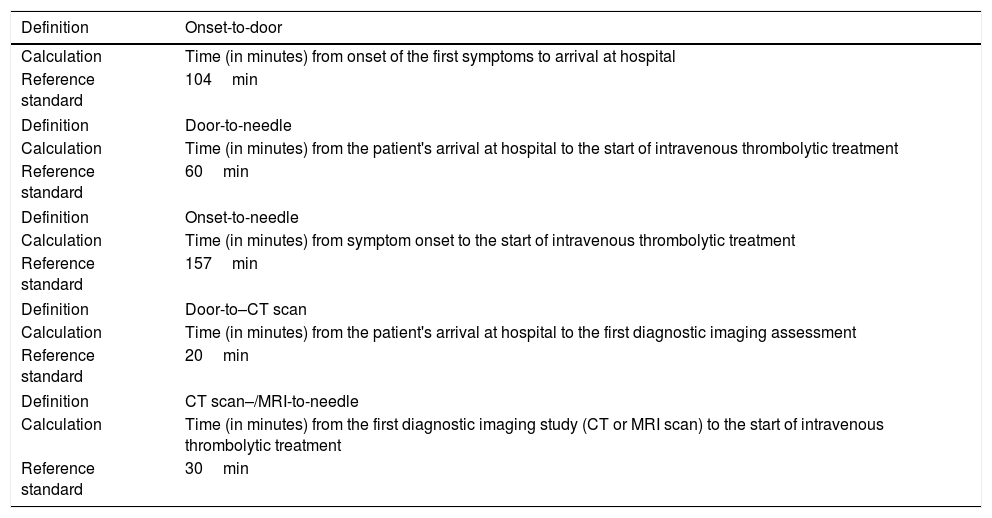
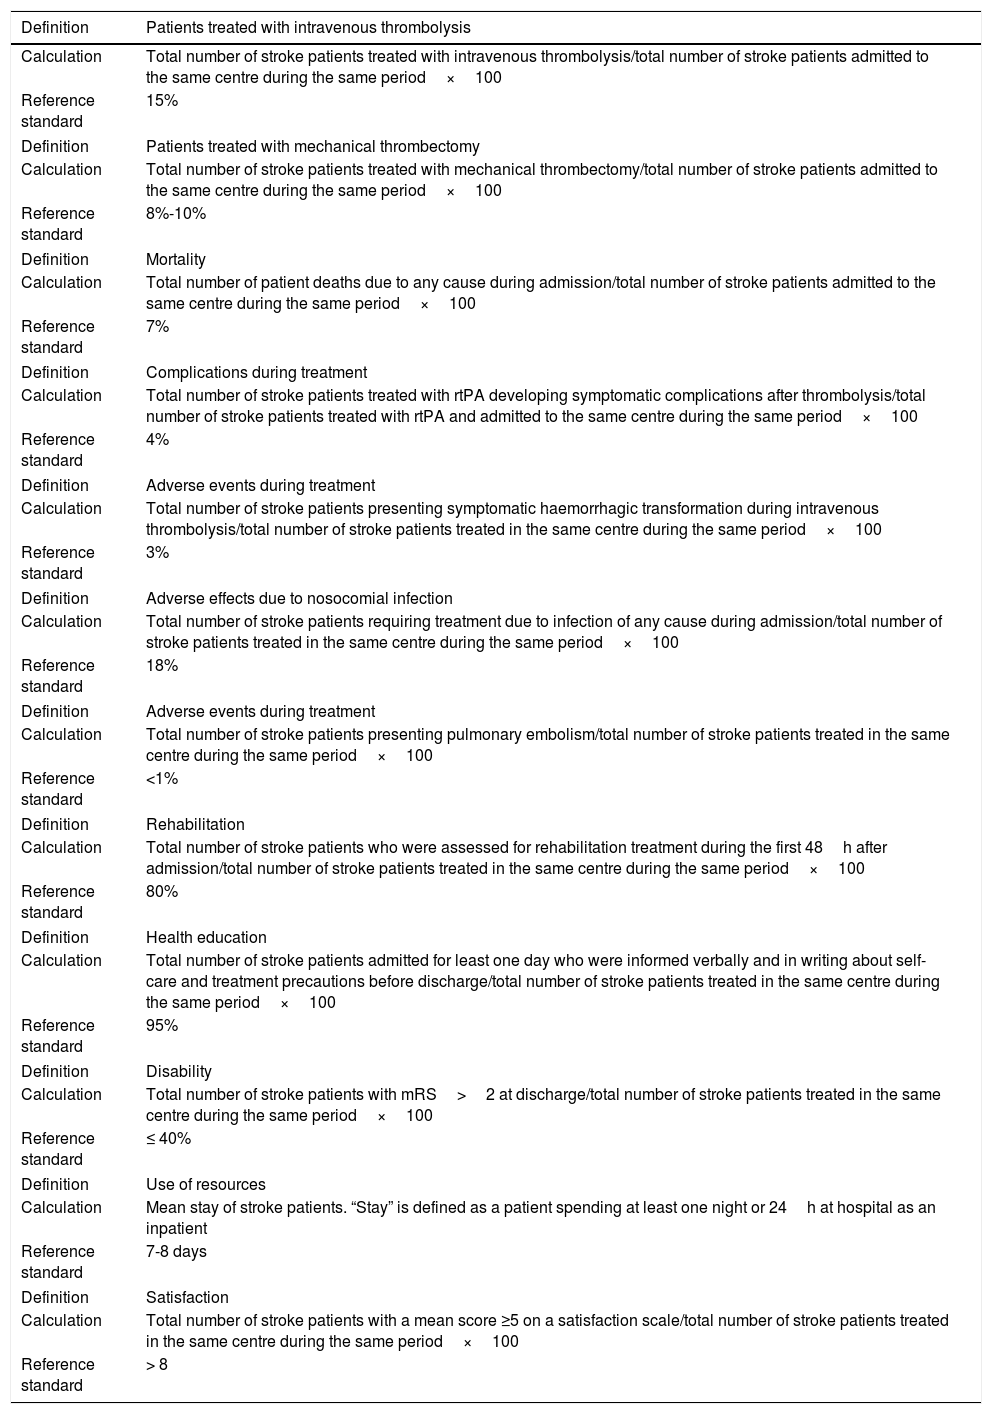
Field work enabled us to verify understanding of the definitions and the feasibility of codifying data for the calculation of indicators. This also enabled us to establish reference standards. Tables 1–3 detail the working definition, formula, and reference standard for each process and outcome indicator included in the control panel.
Control indicators.
| Definition | Neurologist availability |
|---|---|
| Calculation | On-site or on-call neurologist (night and weekend) to take responsibility for the patient after the admission (yes/no) |
| Reference standard | 100% |
| Definition | Nurse ratio |
| Calculation | Total number of nurses at the ward where the patient is admitted (neurology or internal medicine), including all shifts/total number of beds in the ward |
| Reference standard | 0.2 |
| Definition | Stroke care protocol |
| Calculation | Existence of a stroke care protocol, approved by the centre and updated in the 3 previous years (yes/no) |
| Reference standard | 100% |
| Definition | First stroke event |
| Calculation | Total number of patients admitted due to a first stroke event/total number of stroke patients admitted to the centre in the same period×100 |
| Reference standard | 79%-83% |
| Definition | ICU admission |
| Calculation | Total number of stroke patients admitted to the ICU/total number of stroke patients admitted to the same centre×100 |
| Reference standard | 1%-3% |
| Definition | Adequate admission according to treatment |
| Calculation | Total number of stroke patients meeting criteria for admission to the stroke unit/total number of stroke patients admitted to the same centre in the same period×100The following criteria are specified:− Age: older than 18− Symptom onset to hospital door: < 3 h; < 4.5h; < 6h− Baseline situation: modified Rankin Scale score ≤ 2− Focal neurological signs at the time of diagnosis: presence of any of the following symptoms suggestive of stroke:1. Numbness, weakness, or sudden paralysis of the face, arm, or leg on one side of the body2. Sudden confusion3. Difficulty speaking or understanding4. Sudden loss of vision in one or both eyes5. Intense, sudden-onset headache with no apparent cause, accompanied by nausea and vomiting (not attributable to other causes)6. Difficulty speaking, loss of balance or coordination |
| Reference standard | 93%-100% |
| Definition | Cardiac monitoring |
| Calculation | Total number of stroke patients with cardiac monitoring during admission/total number of stroke patients admitted to the same centre during the same period×100 |
| Reference standard | 97% |
| Definition | Type of treatment at discharge |
| Calculation | Total number of patients admitted due to cardioembolic stroke who are following treatment with direct anticoagulant drugs or vitamin K antagonists at discharge |
| Reference standard | 22%-28% |
Process indicators.
| Definition | Onset-to-door |
|---|---|
| Calculation | Time (in minutes) from onset of the first symptoms to arrival at hospital |
| Reference standard | 104min |
| Definition | Door-to-needle |
| Calculation | Time (in minutes) from the patient's arrival at hospital to the start of intravenous thrombolytic treatment |
| Reference standard | 60min |
| Definition | Onset-to-needle |
| Calculation | Time (in minutes) from symptom onset to the start of intravenous thrombolytic treatment |
| Reference standard | 157min |
| Definition | Door-to–CT scan |
| Calculation | Time (in minutes) from the patient's arrival at hospital to the first diagnostic imaging assessment |
| Reference standard | 20min |
| Definition | CT scan–/MRI-to-needle |
| Calculation | Time (in minutes) from the first diagnostic imaging study (CT or MRI scan) to the start of intravenous thrombolytic treatment |
| Reference standard | 30min |
List of outcome indicators.
| Definition | Patients treated with intravenous thrombolysis |
|---|---|
| Calculation | Total number of stroke patients treated with intravenous thrombolysis/total number of stroke patients admitted to the same centre during the same period×100 |
| Reference standard | 15% |
| Definition | Patients treated with mechanical thrombectomy |
| Calculation | Total number of stroke patients treated with mechanical thrombectomy/total number of stroke patients admitted to the same centre during the same period×100 |
| Reference standard | 8%-10% |
| Definition | Mortality |
| Calculation | Total number of patient deaths due to any cause during admission/total number of stroke patients admitted to the same centre during the same period×100 |
| Reference standard | 7% |
| Definition | Complications during treatment |
| Calculation | Total number of stroke patients treated with rtPA developing symptomatic complications after thrombolysis/total number of stroke patients treated with rtPA and admitted to the same centre during the same period×100 |
| Reference standard | 4% |
| Definition | Adverse events during treatment |
| Calculation | Total number of stroke patients presenting symptomatic haemorrhagic transformation during intravenous thrombolysis/total number of stroke patients treated in the same centre during the same period×100 |
| Reference standard | 3% |
| Definition | Adverse effects due to nosocomial infection |
| Calculation | Total number of stroke patients requiring treatment due to infection of any cause during admission/total number of stroke patients treated in the same centre during the same period×100 |
| Reference standard | 18% |
| Definition | Adverse events during treatment |
| Calculation | Total number of stroke patients presenting pulmonary embolism/total number of stroke patients treated in the same centre during the same period×100 |
| Reference standard | <1% |
| Definition | Rehabilitation |
| Calculation | Total number of stroke patients who were assessed for rehabilitation treatment during the first 48h after admission/total number of stroke patients treated in the same centre during the same period×100 |
| Reference standard | 80% |
| Definition | Health education |
| Calculation | Total number of stroke patients admitted for least one day who were informed verbally and in writing about self-care and treatment precautions before discharge/total number of stroke patients treated in the same centre during the same period×100 |
| Reference standard | 95% |
| Definition | Disability |
| Calculation | Total number of stroke patients with mRS>2 at discharge/total number of stroke patients treated in the same centre during the same period×100 |
| Reference standard | ≤ 40% |
| Definition | Use of resources |
| Calculation | Mean stay of stroke patients. “Stay” is defined as a patient spending at least one night or 24h at hospital as an inpatient |
| Reference standard | 7-8 days |
| Definition | Satisfaction |
| Calculation | Total number of stroke patients with a mean score ≥5 on a satisfaction scale/total number of stroke patients treated in the same centre during the same period×100 |
| Reference standard | > 8 |
The set of control, process, and outcome indicators used in this study enable specialists to monitor the functioning of stroke units. Interpreted in their entirety, these indicators identify strengths and areas for improvement in stroke management.
This proposed control panel for characterising and assessing stroke care quality may help reorganise healthcare services and procedures as proposed by other studies.9,10
FundingThis study was funded within the framework of a collaboration agreement with Boehringer Ingelheim España, S.A.
Conflicts of interestThe authors have no conflicts of interest to declare.
Please cite this article as: Navarro Soler IM, Ignacio García E, Masjuan Vallejo J, Gállego Culleré J, Mira Solves JJ. Conjunto de indicadores de calidad asistencial en el abordaje del ictus. Neurología. 2019;34:497–502.
Part of this study was presented at the 34th Congress of the Spanish Society of Healthcare Quality.


