Estudiar la viabilidad del tiempo de relajación longitudinal (T1) en RM del cartílago patelar como biomarcador del grado de degeneración.
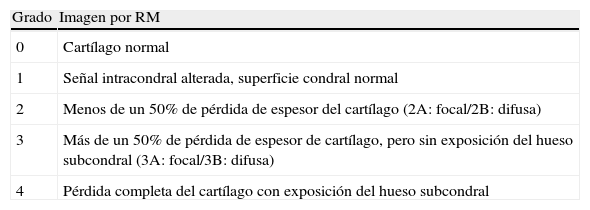
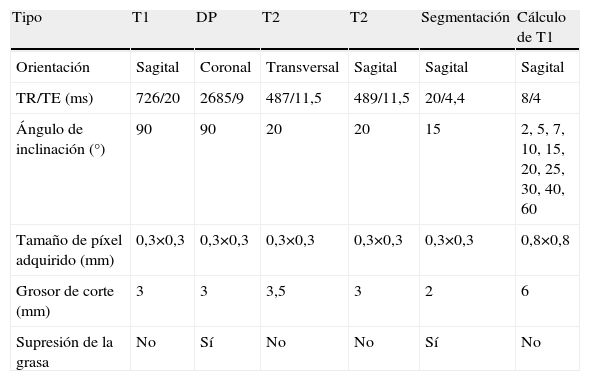
Material y métodosSe incluyeron 15 sujetos clasificados mediante criterios clínicos (dolor, limitación funcional y duración de la sintomatología) y de imagen como normales (3 hombres, 2 mujeres, 30±14 años), con degeneración inicial del cartílago patelar (3 hombres, 2 mujeres, 30±6 años) y con degeneración avanzada (3 hombres, 2 mujeres, 57±10 años). A todos se les realizó un estudio de RM con secuencias especiales eco de gradiente para segmentar el cartílago y calcular los mapas de T1. Se seleccionó el cartílago completo y las regiones de interés clasificadas en base a criterios clínico-radiológicos como normalidad, degeneración inicial y degeneración avanzada. Los valores de T1 del cartílago se obtuvieron píxel a píxel y se calcularon como la media para todo el cartílago o por subregiones (normal, inicial, avanzada). Las diferencias entre grupos para el cartílago completo y las regiones se analizaron mediante ANOVA Student-Newman-Keuls. La reproducibilidad se estudió mediante el coeficiente de varianza.
ResultadosEl análisis global del cartílago no presentó diferencias estadísticamente significativas entre los 3 grupos (normal: 1.003±172ms; inicial: 1.064±124ms; avanzada: 1.041±308ms, p=0,665). En cambio, en el análisis por regiones se obtuvieron diferencias significativas (normal: 908±53ms; degeneración inicial: 1.057±157 ms; degeneración avanzada: 1.133±116 ms; p=0,029). El estudio de reproducibilidad ofreció variaciones del 1,3% para el cálculo global, del 3,7% para el regional, y del 8,2% para la adquisición.
ConclusiónEn este estudio preliminar, el cálculo del T1 del cartílago permite diferenciar regiones con diferente grado de degeneración.
To study the viability of longitudinal relaxation time (T1) of patellar cartilage as a biomarker of the degree of degeneration.
Material and methodsWe included 15 subjects classified into three groups according to clinical criteria (pain, functional limitation, and duration of symptoms) and imaging criteria as follows: (a) normal (3 men, 2 women; age 30±14 years), (b) with initial degeneration of the patellar cartilage (3 men, 2 women; age 30±6 years), or (c) with advanced degeneration (3 men, 2 women; age 57±10 years). All underwent MRI examination using special echo-gradient sequences to segment the cartilage and calculate the T1 maps. We selected the entire cartilage and the regions of interest classified according to clinical and imaging criteria as normal, initial degeneration, and advanced degeneration. The T1 values of the cartilage were obtained pixel by pixel and were calculated as the mean for the entire cartilage or by subregions (normal, initial, advanced). Differences between groups for the entire cartilage and the regions were analyzed using Student-Newman-Keuls post-hoc ANOVA. Reproducibility was evaluated using the coefficient of variance.
ResultsNo significant differences in the overall analysis of the entire cartilage were found between the three groups (normal: 1003±172ms, initial: 1064±124ms, advanced: 1041±308ms, p=0.665). However, the analysis by regions revealed significant differences (normal: 908±53ms, initial degeneration: 1057±157ms, advanced degeneration: 1133±116ms, p=0.029). The reproducibility analysis found variations of 1.3% for the overall calculation, 3.7% for the regional calculation, and 8.2% for the acquisition.
ConclusionIn this preliminary study, calculating the T1 of the cartilage enabled regions with different degrees of degeneration to be differentiated.
Artículo
Comprando el artículo el PDF del mismo podrá ser descargado
Precio 19,34 €
Comprar ahora


