

This article aims to analyze the ranking of Latin American and Caribbean countries in the ranking proposed by the World Intellectual Property Organization in relation to Global Innovation Index using the multicriteria approach as an instrument. The methodology used is the Technique of Ordination by Similarity with the Ideal Solution, in order to support the reduction of subjectivity to the decision making process of the global competitiveness models. It is based on literature research, through a review on the themes of innovation works, marking the condition of the local productive networks, focusing on the approach of the Porter's Diamond proposal. The results of the application of the technique bring a new perspective to institutional methodology and allows to suggest new factors indicative that the countries of Latin America and the Caribbean need to develop their networks and creative policies in such a way that the promotion of technological innovation occurs quickly, so that innovation is transferred to society.
Innovation improves the competitiveness of a country's production chain at the national and transnational level, since we’re going through the globalization of capital and, as such, the products and services in a country are exposed to the world to overcome barriers to competitiveness.
Technological innovation in developing countries is occurring as a process that has its own characteristics, differentiating it from countries with a high technological level. In this sense, observing innovation and the particularities of how it fits within the framework of a country in accordance with innovation indicators and perspectives will reveal the competitive capacity of a country – according to its global positioning – for the purposes of economic development, which will lead to innovation over the long term (Rocha & Dufloth, 2009).
As such, the objective of this study is to use a multicriteria method to analyze the innovation indicators in 22 countries in Latin America and the Caribbean, observing the alignment of the classification methodology performed in 2015 by the World Intellectual Property Organization (WIPO) with the application of the Technique of Ordination by Similarity with the Ideal Solution (TOPSIS) multicriteria method. Based on this objective, the following research question is formulated: what is the robustness of Global Innovation Index (GII) applied to the group of 22 countries when compared to the results of the approach through the multicriteria decision aid method?
Since this study is restricted to the field of global innovation indicators, this research is restricted to the practices observed by WIPO to identify the potential for innovation through indicators of this institution at the national level, which lead to the consideration of a ranking of the most innovative countries on a global level.
Because of the expansive meaning of the term “innovation”, it's use as a scientific tool is restricted. As such, the epistemology is focused on Porter's Diamond, since it finds itself within the stratification of the global innovation principles used by WIPO, extending to the maximum between the polarity of the terms “innovation” and “sustainability” because it's centered around innovation as the competitive, but also sustainable advantage of companies in the global production chain (Freire & Freitas, 2009).
To this end, this paper was organized in five sections. The second section presents the context of innovation and of WIPO. The third section deals with the methodology applied. The fourth discusses the prospects of the tools within the quali-quant context. And the fifth section provides the concluding remarks regarding the information analyzed.
InnovationInnovation has been a goal of different types of organizations. As such, those aspects should be observed that could either promote it or remove the barriers for it occurring in each situation. It is a complex construct, with different concepts, dimensions and contexts of application. As a consequence, it is understood through different theoretical approaches in various fields of knowledge, industries and industrial sectors (Bruno-Faria & Fonseca, 2014). The innovation phenomenon is of extreme relevance to the sustainability of organizations since it enables their sustainability both in terms of new products, more efficient and cheaper processes and even businesses that are more compliant with the needs of the environment. The infrastructure that an organization has for innovation is critical to its success and it comes in different shapes or complexities (Cruz, Frezatti, & Bido, 2015).
The epistemological constructs of the innovation concepts that were widely used until the mid 1970s dealt with the increase of mass production to keep producing vast amounts of revenue. However, with the trend toward quality management over production, the debate arose to bring the conflicting issue of the production chain to academia in order to maintain the high rates of economic output without compromising the environment (Martins, Lima, & Gomes, 2015).
By transcending geographical barriers and extending to the transnational level, the issue of competitiveness through technological improvement and adaptation to the environmental requirements required the development of strategic innovation strategies in order to keep up with global quality and performance standards (Freire & Freitas, 2009).
In this quest for a global competitive positioning, the geographic dimensions and the innovation perspective of local productive arrangements that exceed global competitors and position the company and the country at a higher innovation and technology level, reveal the positioning through international, national, regional and international partnerships, associations and alignments with innovations of related and supporting industries.
However, the concept and the identification of a country as innovating seeks to analyze and document the adaptations and innovations (even if through benchmarking) so that the best practices in innovative production processes can elevate the national intellectual property (Cornell University, INSEAD, & WIPO, 2015).
World Intellectual Property Organization – WIPOWIPO was established as an institution in Stockholm on July 14, 1967. It was tasked with promoting the global protection of intellectual property where there is innovation, creativity and contribution as a stimulus to economic development (Olwan, 2011). Each year the WIPO publishes studies with perspectives on the global innovation trends, identifying the countries with the highest levels of innovation, changing the conceptual methodology for each study launched per year, maintaining the flow of micro and macroeconomic analyses that promote innovation.
As such, the global innovation metrics will change so that the social and economic changes have equivalence regarding the surveyed indicators (Cornell University et al., 2015). When the years 2014 and 2015 are compared, for example, WIPO used a methodology with 81 indicators divided into 3 categories for 2014: 56 in raw data, 20 indicators of international agencies and 5 from questionnaires in economic forums. In 2015, on the other hand, 79 indicators were addressed divided in 3 categories: 55 in raw data, 19 compound indicators and 5 research indicators (Cornell University et al., 2015; Fonseca & Lima, 2015).
WIPO, therefore, develops indicators that are the result of studies and researches that identify countries with active innovative intellectuals, but it also analyzed the micro and macroeconomic aspects that characterize the country regarding its economic-social development (ibid).
In 2015, there were six principles that made up the Global Innovation Index (GII) of countries. These indicators should reflect the growing recognition that innovation is something in which all countries can and must be engaged in order to consider it for the creation and deployment of innovation policies for the strategic development of the countries. The six innovation policy principles defined by the WIPO in the 2015 index are listed below:
- a.
Principle 1: innovation policies should focus on maximizing innovation across all industries in all economic, correlated and supporting sectors so that the global production chain can develop technological innovation;
- b.
Principle 2: innovation policies should support all types and stages of innovation, because one of the errors of national innovation policies is to define innovation strategies on a microeconomic level, only focusing on the production of technological products, while innovation should extend throughout the whole chain of production in order to rethink the mix of products that make up the high value-added sectors of production;
- c.
Principle 3: to empower creativity and creative destruction to grow in innovation, developing countries need to enable the rupture of production for something innovative that will enable new players to enter economic sectors, especially those that are in the same economic sector of well-positioned products and services;
- d.
Principle 4: keep the price of capital goods – especially those related to communications and technology – low, because without the new incoming capital to invest in technology, the power to invest in innovation is lost and productivity stagnates, causing a drop in strategic competitiveness. Monitoring quotas and tariffs, such as import barriers (and subtly to exports in some sectors) can therefore maintain the cost of capital low;
- e.
Principle 5: support the creation of technology transfers to related and supporting industries, where companies not only need access to innovation, but also to inter and intra-sectoral technology transfers. In addition, the digital infrastructure, skilled labor specialized in technological innovation and technological knowledge must be aligned to the changes in various economic sectors, and
- f.
Principle 6: develop a national innovation and production strategy with companies that support them through the creation of agencies dedicated to fostering innovation.
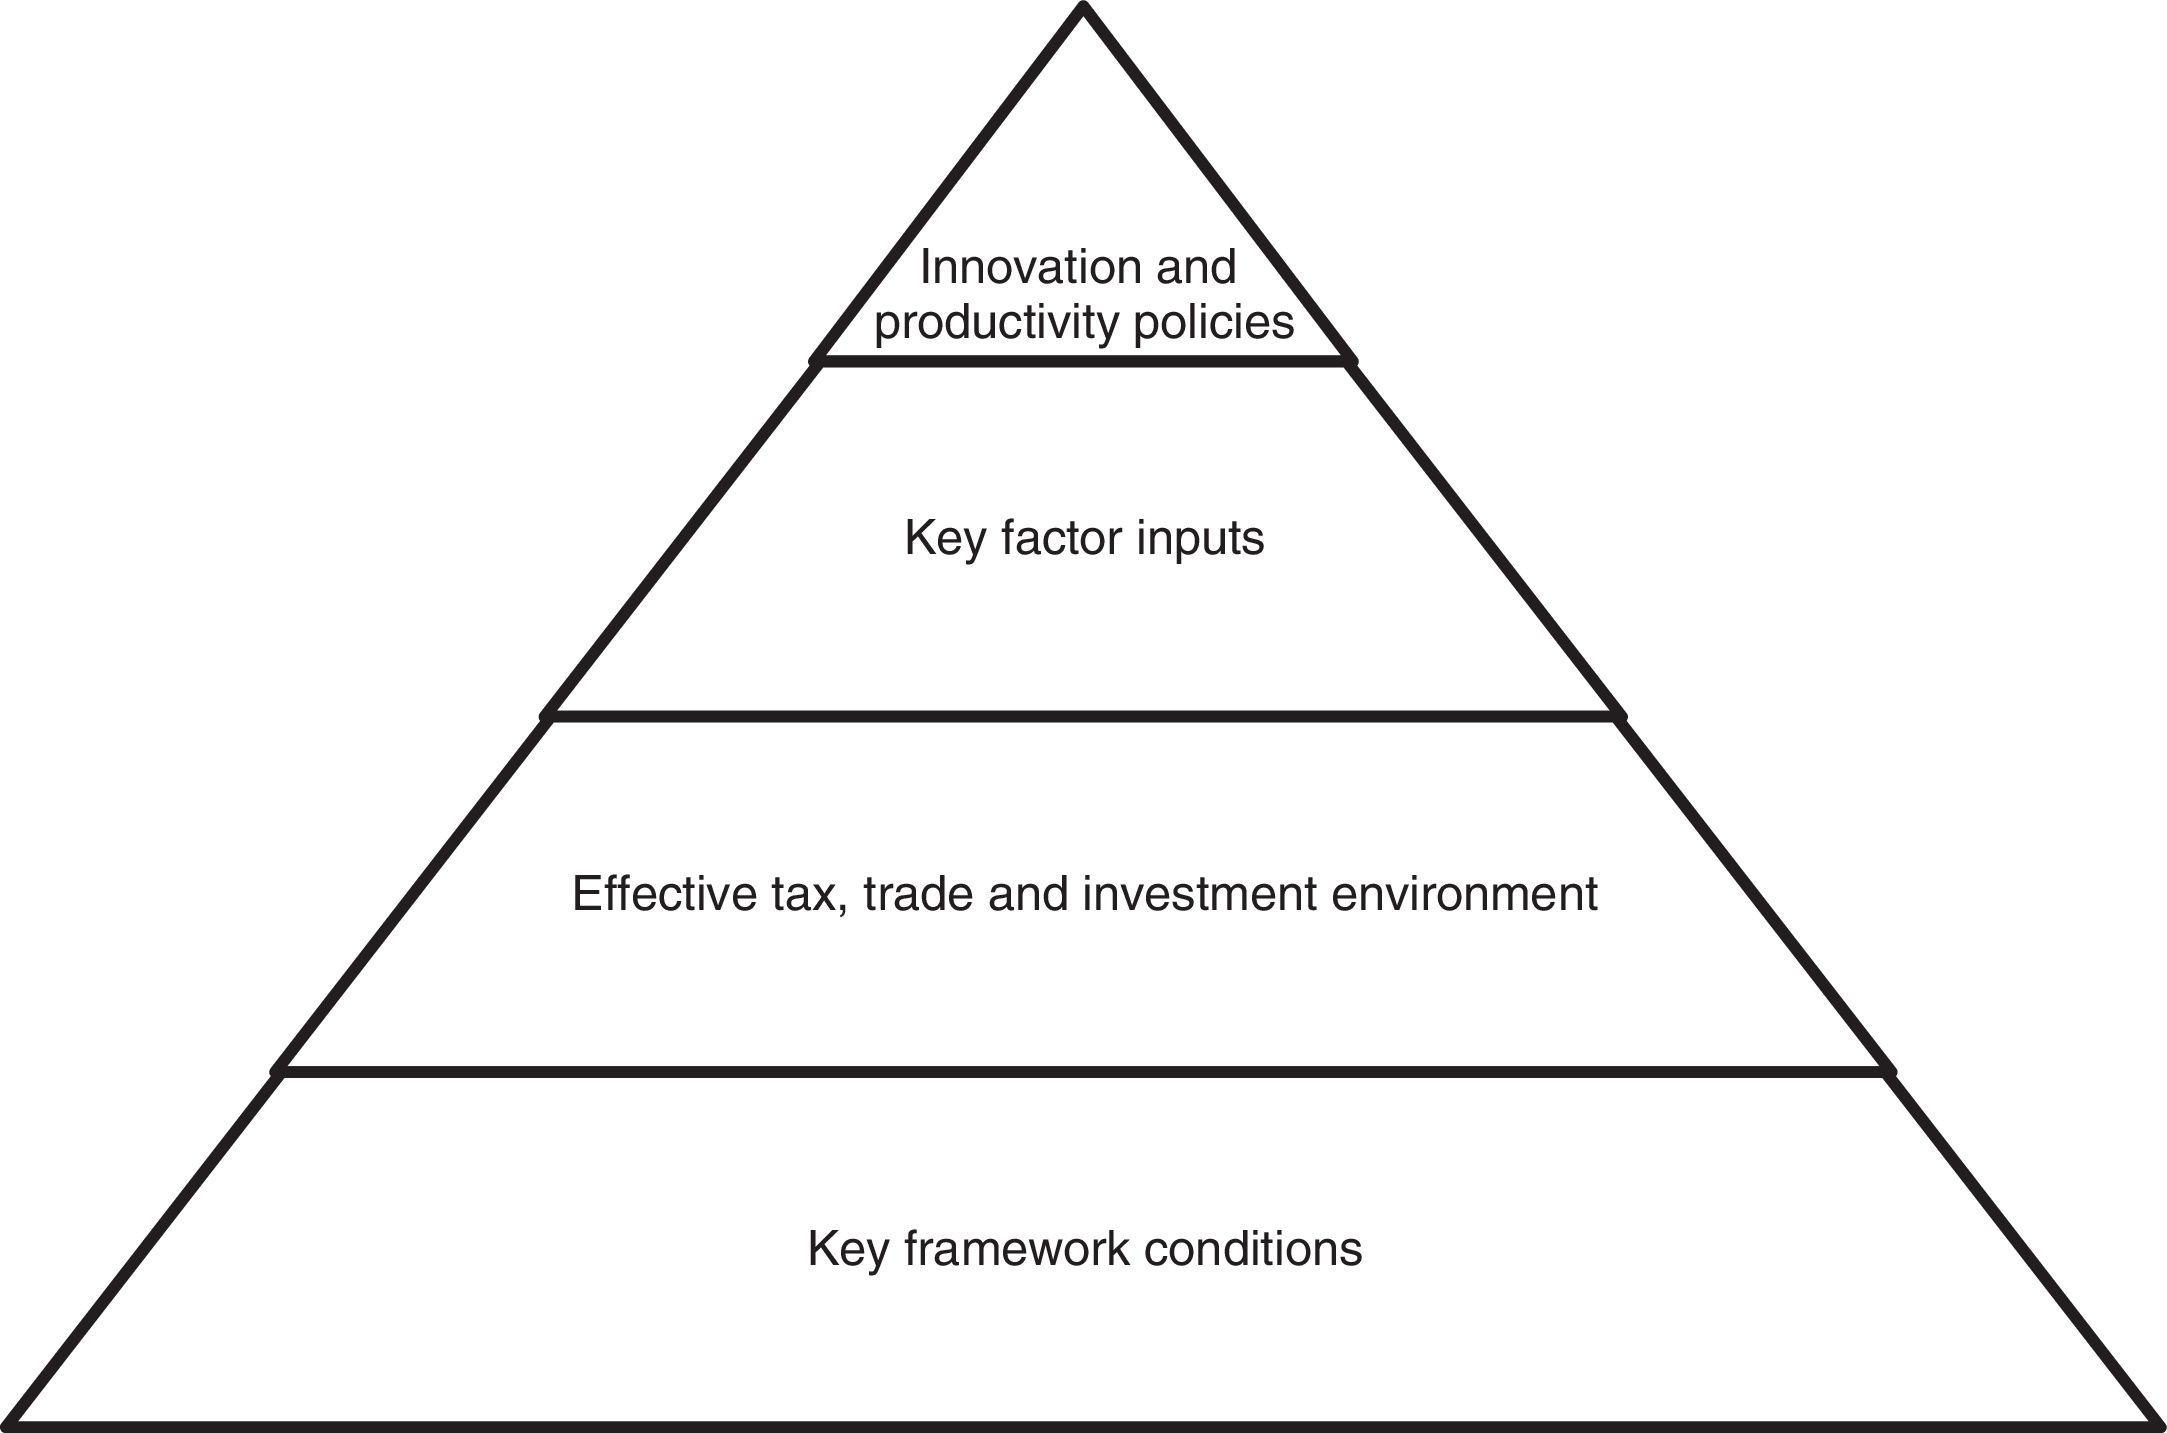
Through these principles, the indicators are analyzed so that countries can compare themselves globally regarding the imposition of tariffs, quotas and the impact of public policy on the ability of companies to participate in the innovation economy in global terms. Fig. 1 enables an analysis of the structure of the principles, highlighting their relevant variables.

Stratification of the global innovation principles observed by the WIPO.
The pyramid regarding the structuring of the principles reveals that principles 1–3 relate to the base of the pyramid, because without the basic conditions for the development of the factors of production, industries with sophisticated innovation will not prevail. The second level of the pyramid is the stabilization of the global competitiveness rate in the environment related to the taxation and innovation policies that encourage international trade and foreign direct investment in production is such a way that it is attractive and not coercive (Cornell University et al., 2015).
Further up the pyramid, the key factors of production of domestic firms must have at its base a robust physical and digital infrastructure with specialized labor in these technologies to support industry in order to combine the needs of the key industries with those of the supporting and related industries. This level of the pyramid is therefore a mixture of principles four and five.
On the last level in the pyramid, the analysis of principles 4 and 6 shows that specific policies and innovations lead to the competitiveness of a country in a complex of forces and threats to its domestic industry, because taxes in research & development, as well as their policies, need to explore small businesses and the clusters need to understand the new innovative players entering that economic sector to carry out the necessary benchmarking for the strategic competitiveness along the production chain.
In this sense, it should be emphasized that even when innovation in a country is structured around the innovative principles, the construction of these principles will not produce technological innovation fairly across economic sectors since the same conditions offered are not at the root of the sophistication in all economic sectors. Sometimes countries prefer to focus on the top of the pyramid with generalist policies instead of actually understanding their challenges and rectifying their acts in favor of innovation with taxes and policies that are aligned to the sectors, such as through specific innovation programs that meet a cluster so that the entire production chain rises through strategic technological innovation. This way, the government would be leading to changes in the private sectors that would result in a macroeconomic rupture.
Innovative policies – on taxes, quotas regarding socio-economical policies–, however, have become national factors of technological innovation in the face of the global competition for innovation. Countries must rethink their innovation policies if they aren’t aligned with their national and international context so that the impact on their economies leads to competition in the global chain of production. Although rejected in the short term, in the long term these policies would lead to a better positioning of the country in economic sectors by dealing with the base of its technological innovation, which would allow its entire production chain to be organized in such a way as to culminate in the strategic technological innovation of its products and services.
MethodologyThe nature of this study was to analyze the innovation indicators that WIPO uses to rank the countries as more innovative. It used a qualitative approach to understand the dimensions that define these indicators, in addition to a quantitative analysis regarding the observation of this WIPO methodology through a multicriteria TOPSIS analysis. The exploratory nature analyzes the dimensions and their scenarios, the relevant variables to understand innovation in the environment of national and international strategy and competitiveness (Martins et al., 2015).
A literature review was carried out for this study with a restriction to the term “innovation” in competitive strategy, and the strategic model of Porter's Diamond was the scenario with the dimensions adhering to the parameters, to the innovation and competitiveness environment, particularly in relation to the holistic observation of the innovation process regarding the global production networks, the principles, stratifications, methodological steps and the entire qualitative construct developed by WIPO for the qualitative analysis of the innovation indicators of its 2015 index.
The epistemology of this study, therefore, reflects the nature, steps and limits of technological innovation in the context of the strategic competitiveness between companies, their industries and national and transnational economic sectors, and their governments. In this sense, the agents and objects of analysis have their paradigms structured so as to establish the evolution of the most innovative countries through Porter's Diamond.
On the other hand, qualitative concepts were followed to rank the most innovative countries in Latin America by applying the Multicriteria Decision Aid method (MCDA), considering that such a comparison between a qualitative and quantitative analysis would promote an understanding of the WIPO methodology – which changes each year in the identification of the most innovative countries – if there is support from quantitative tools for the ranking – and not the preferences – of the most innovative countries.
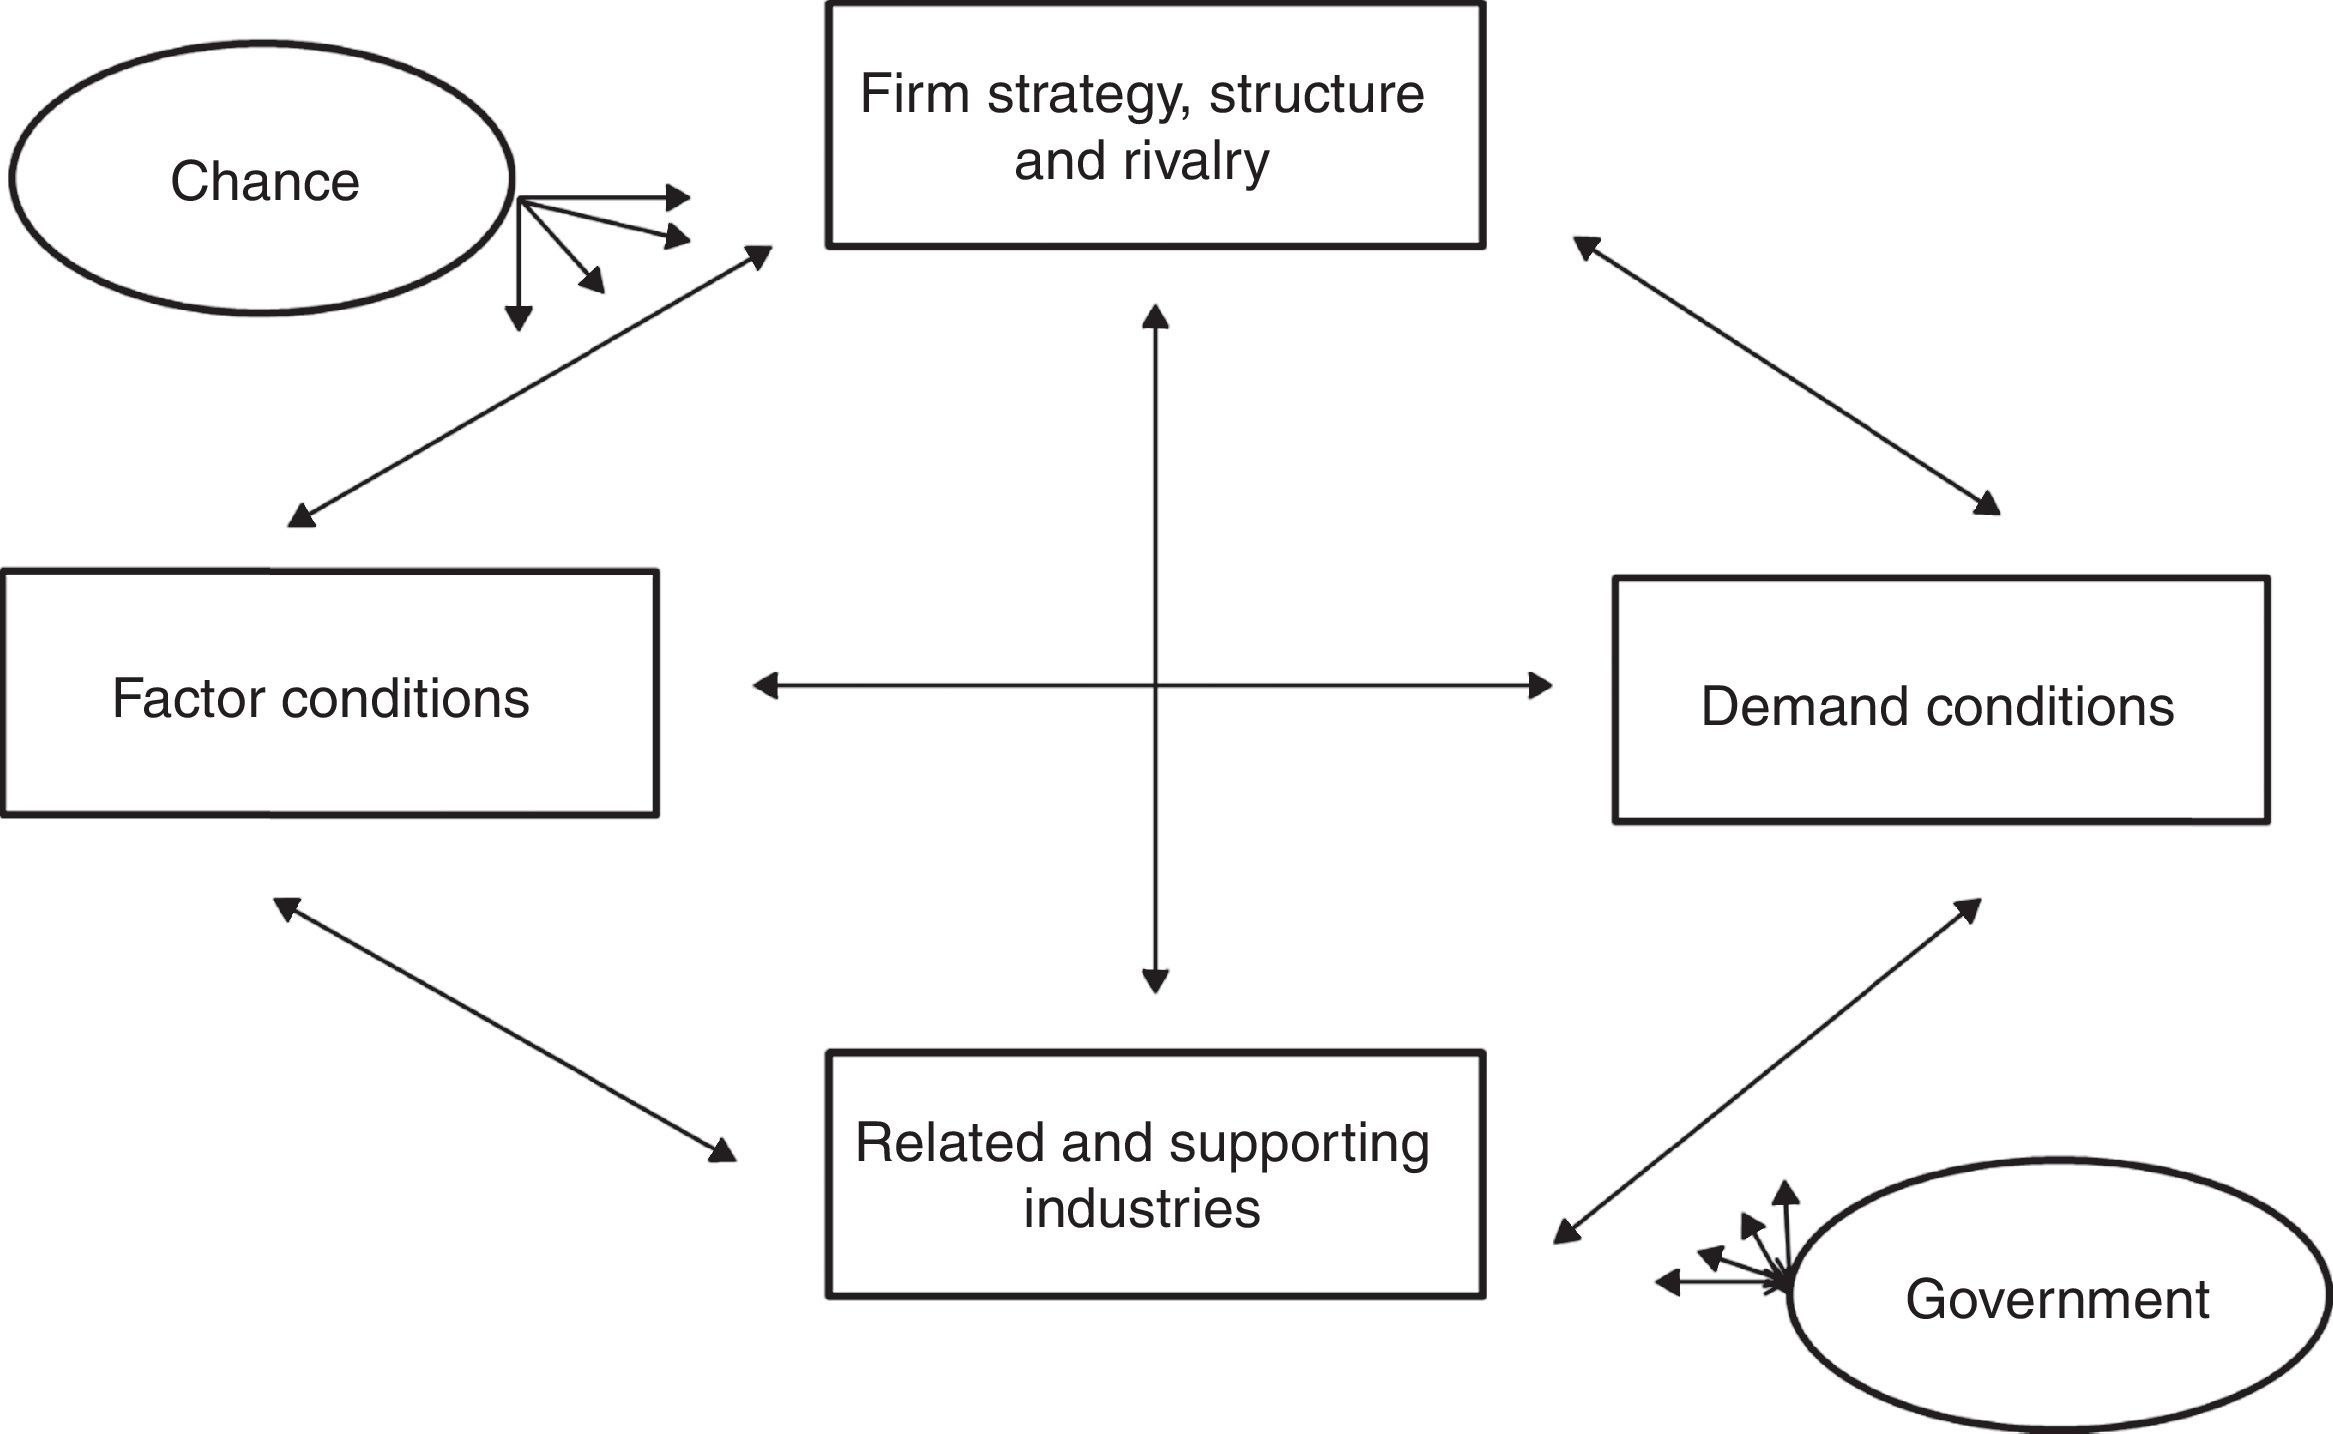
Porter's diamond dimension in the innovation indicatorsThe studies on the strategies of countries to obtain a competitive advantage culminate in Porter's 1989 publication The Competitive Advantage of Nations, which describes four factors that the nation must observe in the dimensionality of its industries: conditions regarding factors, conditions regarding demand, related and supporting industries and also the strategy, structure and rivalry between firms. Supporting these four factors are the factors of chance and government, as shown in Fig. 2.

The design of Porter's Diamond also stems from a qualitative analysis of the previously identified and validated indicators as determinant factors of competitive national advantage, represented as a “diamond” that aligns the factors for the creation of competitive advantages in an industry, nation or region (Porter, 1989).
Freire and Freitas (2009) observed in Porter's work that nations must create their own production factors instead of inheriting them, becoming responsible for their own competitiveness based on the optimal utilization of the resources they possess and the market in which they operate; hence the conclusion that innovation in the generation and use of resources is a key factor for the creation and maintenance of competitive advantages.
As such, the principles at the base of the pyramid that initiate the definition of innovation indicators are supported by the productivity dimension and its application in the production chain in global terms. And it's by means of this comparison with the role of Porter's production factors (1989) that the first WIPO innovation indicators emerge: the pillars of human capital and research, institutions and infrastructure, market sophistication and business sophistication.
As for the demand conditions suggested in Porter (1989), the trends of the requirements required by domestic demand, which lead to the formation of competitive advantages and the consequent inclusion in the competitive market are observed. This is in alignment with the pillars of knowledge and technology outputs as well as the creative outputs, since the domestic industry will have to adjust to external competitiveness to meet this demand (which sometimes can be suppressed or implied in any production process). In this context, the pillars of market sophistication and business sophistication also align through the quest for technological transfers to meet the nature of this demand.
Giving importance to industries that act as suppliers and work in the production chain of its economic sector, Porter (1989) notes that if related and supporting industries are going through technological innovation in their production process, then this will create advantages for the industry, increasing competitiveness in the global production chain. The companies that enter under these conditions also bring innovative force to the sector, which will have to adjust to the new reality of the production chain and adapt to technological standards to avoid losing market positioning. These changes in technological processes for benchmarking are observed in a mixed way through WIPO's seven pillars (Cornell University et al., 2015), since the entry into an industry and the promotion of changes in its production process due to an innovation “rests” on the pillars and on their innovation indicators, just as its sub-indicators, in such a way that the demand involves macroeconomic issues instead of simply representing a data series (intrinsic in the constituent assembly of the Gross Domestic Product – GDP – of a country) to influence several innovation indicators that measure the situation of the countries.
As for what determines the strategy, structure and rivalry developed by Porter (1989), innovation is the main characteristic, because it is this way that companies are created and positioned in their markets, associated through internal rivalries, and it is this way that this internal rivalry and the productive chain is sustained by the market strategy, either by the rivalry between competitors and the structure of their production process, which causes the entry of new supplying and supporting industries. In this provocative and threatening context, industries must innovate. And this factor has become the crucial point for innovation in an economic sector when it wants to become transnationally competitive, since innovation should emerge through business sophistication when market sophistication has already been established as an accelerator of innovation. The creative output and knowledge and technological output pillars are also important indicators when aligned to this factor (13 and 14 indicators, respectively), since they define innovation in the industry that reflects the profile of the country.
The government, in turn, aligns to the pillar of institutions, since it operates in the rivalry process through the generation of laws, taxes and import and export quotas. In addition to consolidating the economic indicators of the country, the government shows itself as an innovation actor when it politically protects the clusters when there is a heavy presence of competitors in the economic sector it wants to protect through its innovations and the visibility of market positioning. Similarly, the factor chance can be thought of as any factor inherent in the everyday life of the industries that results in technological innovation.
Application of the TOPSIS multicriteria decision aid methodMCDA is a set of techniques to assist the deciding agent – an individual, group of individuals or committee of experts or leaders – to make decisions about a complex problem, evaluating and choosing alternatives to rank them according to different criteria and points of view (Gomes & Gomes, 2014).
This technique allows the decision to be regulated based on weighted criteria considered relevant to the issue in question, where the importance of the criteria is defined by the deciding agents in an interactive process with other technical-political actors (Gomes & Gomes, 2004; Sarrazin & De Smet, 2015).
Longaray, Popiolek Junior, Munhoz, Geri, and Castelli (2015) note that when studying the applied multicriteria methods from 2004 to 2013 in scientific studies, it is hard to actually identify the multicriteria methods, since tens of thousands of possibilities of papers can be found in Brazilian scientific production and they therefore further narrowed their study with the observation of the most cited authors.
The TOPSIS method stands out for being intuitive and for the simplicity of the mathematical procedures, which contributes to its ease of implementation and application, and which enables the evaluation of an unlimited quantity of alternatives, unlike comparative approaches (Junior & Carpinetti, 2015; Kluczek & Gladysz, 2015).
In order to use a multicriteria method that adheres to the quantitative analysis of the innovation indicators, and one that is aligned to the context of the problem, taking the positioning of the countries in Latin America and the Caribbean in 2015 in consideration in alignment with the qualitative conditions of these countries; it was decided to select the TOPSIS multicriteria method.
According to TOPSIS, the best alternative is the one that is closest to the positive ideal solution and farthest removed from the negative ideal solution. The positive ideal solution (PIS) is a solution that maximizes the “benefit” criteria and minimizes the “cost” criteria; while the negative ideal solution (NIS, also called anti-ideal) maximizes the “cost” criteria and minimizes the “benefit” criteria. As such, the positive ideal solution is composed of all the best attainable values of the “benefit” criteria; while the negative ideal solution consists of all the worst attainable values for the “cost” criteria (Bhutia & Phipon, 2012).
The calculation of the Euclidean distances between AI and A+ (benefits) and between Ai and A− (costs) is performed by the equations: Di+=∑j=1npij−pj+2, and Di−=∑j=1npij−pj−2.
The calculation of the relative proximity Ci to each alternative Ai in relation to the positive ideal solution A+ is generated by the equation: Ci=Di−/(Di+−Di−), in which, i=1,…,m and the value of the index Ci varies between 0 and 1.
The complexity of the AHP method and its hierarchical structure was considered a difficulty for the adjustment to Porter's Diamond. The MAUT structure, which seeks to model the concept in a single function, also led to adjustment difficulties. The TOPSIS model – which defines an optimal alternative, however, served as a target and standard of comparison and was perfectly suited to the problem at hand. No articles and studies were found in the literature where there is a proposal for the alignment of global innovation indicators regarding their principles to the Porter's Diamond model when applied to multicriteria problems, and more specifically to TOPSIS, which gives an innovative character to this proposal.
The methods of the ELECTRE, PROMETHEE families were also discarded for use in this study because these are non-compensatory methods, unlike the TOPSIS method. These families of methods by aggregation without an unique synthesizing criterion, based on the concept of relation or exceeding (or overrating) is what makes the TOPSIS method more closely related to the methodology applied by Cornell University; even if it belongs to the French school (Longaray et al., 2015).
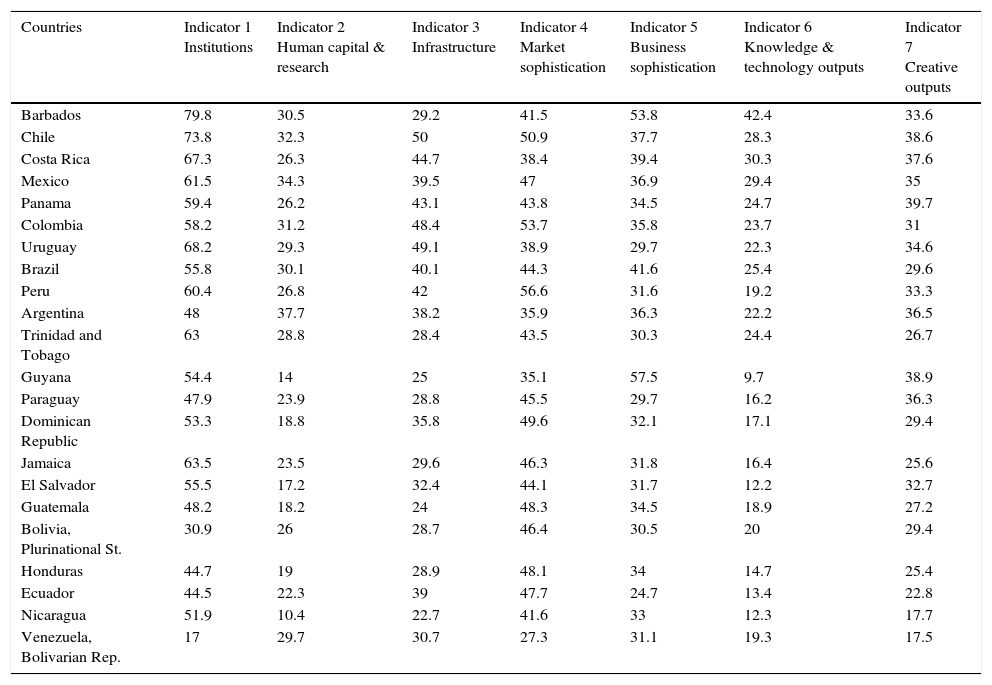
After defining the multicriteria method to establish the ranking of WIPO's innovation indicators in 2015, we looked specifically at the twenty-two countries of Latin America and the Caribbean cited in the publication with their scores in their seven indicators, as listed in Table 1.
2015 Innovation indicators of the countries of Latin America and the Caribbean.
| Countries | Indicator 1 Institutions | Indicator 2 Human capital & research | Indicator 3 Infrastructure | Indicator 4 Market sophistication | Indicator 5 Business sophistication | Indicator 6 Knowledge & technology outputs | Indicator 7 Creative outputs |
|---|---|---|---|---|---|---|---|
| Barbados | 79.8 | 30.5 | 29.2 | 41.5 | 53.8 | 42.4 | 33.6 |
| Chile | 73.8 | 32.3 | 50 | 50.9 | 37.7 | 28.3 | 38.6 |
| Costa Rica | 67.3 | 26.3 | 44.7 | 38.4 | 39.4 | 30.3 | 37.6 |
| Mexico | 61.5 | 34.3 | 39.5 | 47 | 36.9 | 29.4 | 35 |
| Panama | 59.4 | 26.2 | 43.1 | 43.8 | 34.5 | 24.7 | 39.7 |
| Colombia | 58.2 | 31.2 | 48.4 | 53.7 | 35.8 | 23.7 | 31 |
| Uruguay | 68.2 | 29.3 | 49.1 | 38.9 | 29.7 | 22.3 | 34.6 |
| Brazil | 55.8 | 30.1 | 40.1 | 44.3 | 41.6 | 25.4 | 29.6 |
| Peru | 60.4 | 26.8 | 42 | 56.6 | 31.6 | 19.2 | 33.3 |
| Argentina | 48 | 37.7 | 38.2 | 35.9 | 36.3 | 22.2 | 36.5 |
| Trinidad and Tobago | 63 | 28.8 | 28.4 | 43.5 | 30.3 | 24.4 | 26.7 |
| Guyana | 54.4 | 14 | 25 | 35.1 | 57.5 | 9.7 | 38.9 |
| Paraguay | 47.9 | 23.9 | 28.8 | 45.5 | 29.7 | 16.2 | 36.3 |
| Dominican Republic | 53.3 | 18.8 | 35.8 | 49.6 | 32.1 | 17.1 | 29.4 |
| Jamaica | 63.5 | 23.5 | 29.6 | 46.3 | 31.8 | 16.4 | 25.6 |
| El Salvador | 55.5 | 17.2 | 32.4 | 44.1 | 31.7 | 12.2 | 32.7 |
| Guatemala | 48.2 | 18.2 | 24 | 48.3 | 34.5 | 18.9 | 27.2 |
| Bolivia, Plurinational St. | 30.9 | 26 | 28.7 | 46.4 | 30.5 | 20 | 29.4 |
| Honduras | 44.7 | 19 | 28.9 | 48.1 | 34 | 14.7 | 25.4 |
| Ecuador | 44.5 | 22.3 | 39 | 47.7 | 24.7 | 13.4 | 22.8 |
| Nicaragua | 51.9 | 10.4 | 22.7 | 41.6 | 33 | 12.3 | 17.7 |
| Venezuela, Bolivarian Rep. | 17 | 29.7 | 30.7 | 27.3 | 31.1 | 19.3 | 17.5 |
Source: Cornell University et al. (2015).
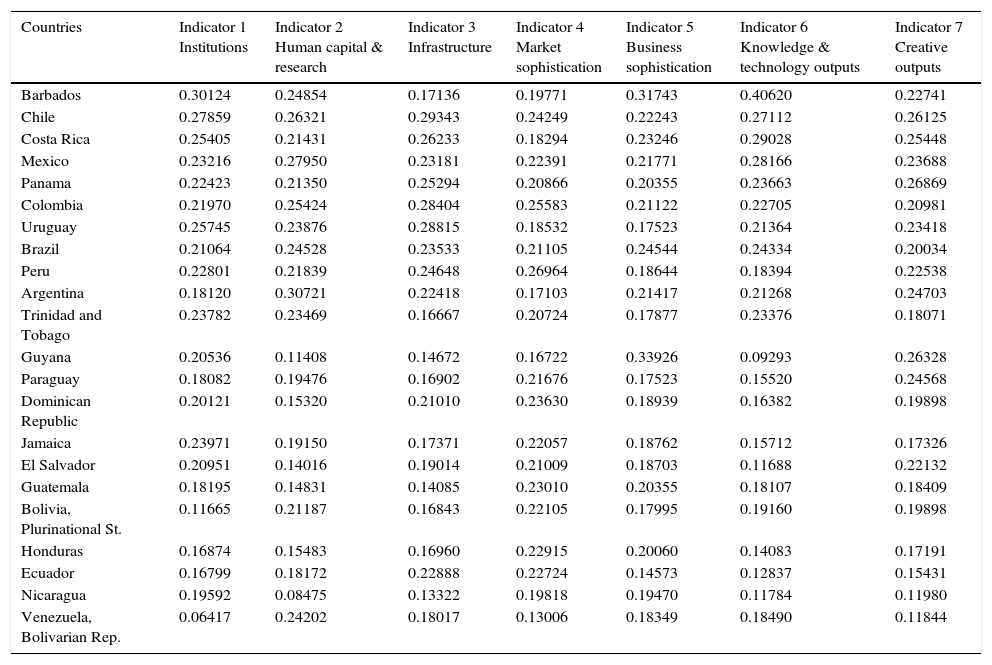
The normalized matrix in accordance with the TOPSIS method results in Table 2.
Normalized matrix of innovation indicators.
| Countries | Indicator 1 Institutions | Indicator 2 Human capital & research | Indicator 3 Infrastructure | Indicator 4 Market sophistication | Indicator 5 Business sophistication | Indicator 6 Knowledge & technology outputs | Indicator 7 Creative outputs |
|---|---|---|---|---|---|---|---|
| Barbados | 0.30124 | 0.24854 | 0.17136 | 0.19771 | 0.31743 | 0.40620 | 0.22741 |
| Chile | 0.27859 | 0.26321 | 0.29343 | 0.24249 | 0.22243 | 0.27112 | 0.26125 |
| Costa Rica | 0.25405 | 0.21431 | 0.26233 | 0.18294 | 0.23246 | 0.29028 | 0.25448 |
| Mexico | 0.23216 | 0.27950 | 0.23181 | 0.22391 | 0.21771 | 0.28166 | 0.23688 |
| Panama | 0.22423 | 0.21350 | 0.25294 | 0.20866 | 0.20355 | 0.23663 | 0.26869 |
| Colombia | 0.21970 | 0.25424 | 0.28404 | 0.25583 | 0.21122 | 0.22705 | 0.20981 |
| Uruguay | 0.25745 | 0.23876 | 0.28815 | 0.18532 | 0.17523 | 0.21364 | 0.23418 |
| Brazil | 0.21064 | 0.24528 | 0.23533 | 0.21105 | 0.24544 | 0.24334 | 0.20034 |
| Peru | 0.22801 | 0.21839 | 0.24648 | 0.26964 | 0.18644 | 0.18394 | 0.22538 |
| Argentina | 0.18120 | 0.30721 | 0.22418 | 0.17103 | 0.21417 | 0.21268 | 0.24703 |
| Trinidad and Tobago | 0.23782 | 0.23469 | 0.16667 | 0.20724 | 0.17877 | 0.23376 | 0.18071 |
| Guyana | 0.20536 | 0.11408 | 0.14672 | 0.16722 | 0.33926 | 0.09293 | 0.26328 |
| Paraguay | 0.18082 | 0.19476 | 0.16902 | 0.21676 | 0.17523 | 0.15520 | 0.24568 |
| Dominican Republic | 0.20121 | 0.15320 | 0.21010 | 0.23630 | 0.18939 | 0.16382 | 0.19898 |
| Jamaica | 0.23971 | 0.19150 | 0.17371 | 0.22057 | 0.18762 | 0.15712 | 0.17326 |
| El Salvador | 0.20951 | 0.14016 | 0.19014 | 0.21009 | 0.18703 | 0.11688 | 0.22132 |
| Guatemala | 0.18195 | 0.14831 | 0.14085 | 0.23010 | 0.20355 | 0.18107 | 0.18409 |
| Bolivia, Plurinational St. | 0.11665 | 0.21187 | 0.16843 | 0.22105 | 0.17995 | 0.19160 | 0.19898 |
| Honduras | 0.16874 | 0.15483 | 0.16960 | 0.22915 | 0.20060 | 0.14083 | 0.17191 |
| Ecuador | 0.16799 | 0.18172 | 0.22888 | 0.22724 | 0.14573 | 0.12837 | 0.15431 |
| Nicaragua | 0.19592 | 0.08475 | 0.13322 | 0.19818 | 0.19470 | 0.11784 | 0.11980 |
| Venezuela, Bolivarian Rep. | 0.06417 | 0.24202 | 0.18017 | 0.13006 | 0.18349 | 0.18490 | 0.11844 |
Source: The authors (2016).
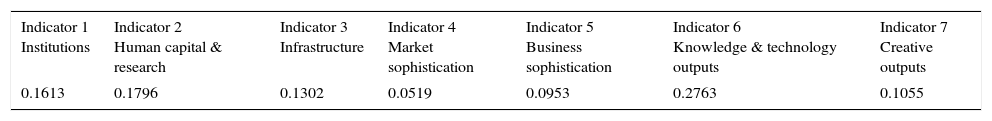
The allocation of weights was defined by entropy attributing a higher weight to a criterion in relation to those that have greater diversity of ratings from the innovation indicators (Oliveira & Mello, 2009). As such, the weights were distributed according to Table 3.
Weights in accordance to entropy of the seven innovation indicators.
| Indicator 1 Institutions | Indicator 2 Human capital & research | Indicator 3 Infrastructure | Indicator 4 Market sophistication | Indicator 5 Business sophistication | Indicator 6 Knowledge & technology outputs | Indicator 7 Creative outputs |
|---|---|---|---|---|---|---|
| 0.1613 | 0.1796 | 0.1302 | 0.0519 | 0.0953 | 0.2763 | 0.1055 |
Source: The authors (2016).
The technique of assigning weights by entropy was proposed by Zeleny (1982). The key idea is to assign the greatest weight to the criterion that represents the largest amount of information, which is associated with a higher variance of the data within the criterion. Zeleny (1982) looked to Shannon's information theory (1949) for a dispersion measure capable of representing the weight of the criterion. The data itself determines the weight of the criterion, without the need of interference by a specialists or the decider. As such, the author eliminated human subjectivity in the assignment of weights to those criteria. More details on the calculations of weights by entropy can be obtained in Pomerol and Barba-Romero (2012).
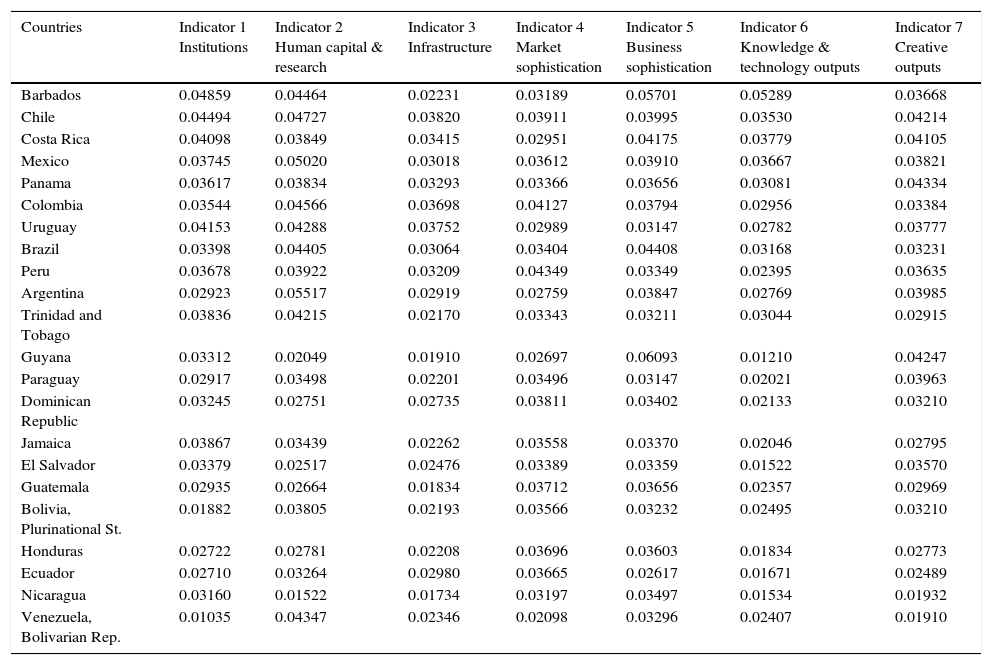
This way the discrimination between the ranking alternatives of the innovation indicators could be observed, and according to this the normalized and weighted indicators as shown in Table 4 could be calculated.
Normalized and weighted matrix of innovation indicators.
| Countries | Indicator 1 Institutions | Indicator 2 Human capital & research | Indicator 3 Infrastructure | Indicator 4 Market sophistication | Indicator 5 Business sophistication | Indicator 6 Knowledge & technology outputs | Indicator 7 Creative outputs |
|---|---|---|---|---|---|---|---|
| Barbados | 0.04859 | 0.04464 | 0.02231 | 0.03189 | 0.05701 | 0.05289 | 0.03668 |
| Chile | 0.04494 | 0.04727 | 0.03820 | 0.03911 | 0.03995 | 0.03530 | 0.04214 |
| Costa Rica | 0.04098 | 0.03849 | 0.03415 | 0.02951 | 0.04175 | 0.03779 | 0.04105 |
| Mexico | 0.03745 | 0.05020 | 0.03018 | 0.03612 | 0.03910 | 0.03667 | 0.03821 |
| Panama | 0.03617 | 0.03834 | 0.03293 | 0.03366 | 0.03656 | 0.03081 | 0.04334 |
| Colombia | 0.03544 | 0.04566 | 0.03698 | 0.04127 | 0.03794 | 0.02956 | 0.03384 |
| Uruguay | 0.04153 | 0.04288 | 0.03752 | 0.02989 | 0.03147 | 0.02782 | 0.03777 |
| Brazil | 0.03398 | 0.04405 | 0.03064 | 0.03404 | 0.04408 | 0.03168 | 0.03231 |
| Peru | 0.03678 | 0.03922 | 0.03209 | 0.04349 | 0.03349 | 0.02395 | 0.03635 |
| Argentina | 0.02923 | 0.05517 | 0.02919 | 0.02759 | 0.03847 | 0.02769 | 0.03985 |
| Trinidad and Tobago | 0.03836 | 0.04215 | 0.02170 | 0.03343 | 0.03211 | 0.03044 | 0.02915 |
| Guyana | 0.03312 | 0.02049 | 0.01910 | 0.02697 | 0.06093 | 0.01210 | 0.04247 |
| Paraguay | 0.02917 | 0.03498 | 0.02201 | 0.03496 | 0.03147 | 0.02021 | 0.03963 |
| Dominican Republic | 0.03245 | 0.02751 | 0.02735 | 0.03811 | 0.03402 | 0.02133 | 0.03210 |
| Jamaica | 0.03867 | 0.03439 | 0.02262 | 0.03558 | 0.03370 | 0.02046 | 0.02795 |
| El Salvador | 0.03379 | 0.02517 | 0.02476 | 0.03389 | 0.03359 | 0.01522 | 0.03570 |
| Guatemala | 0.02935 | 0.02664 | 0.01834 | 0.03712 | 0.03656 | 0.02357 | 0.02969 |
| Bolivia, Plurinational St. | 0.01882 | 0.03805 | 0.02193 | 0.03566 | 0.03232 | 0.02495 | 0.03210 |
| Honduras | 0.02722 | 0.02781 | 0.02208 | 0.03696 | 0.03603 | 0.01834 | 0.02773 |
| Ecuador | 0.02710 | 0.03264 | 0.02980 | 0.03665 | 0.02617 | 0.01671 | 0.02489 |
| Nicaragua | 0.03160 | 0.01522 | 0.01734 | 0.03197 | 0.03497 | 0.01534 | 0.01932 |
| Venezuela, Bolivarian Rep. | 0.01035 | 0.04347 | 0.02346 | 0.02098 | 0.03296 | 0.02407 | 0.01910 |
Source: The authors (2016).
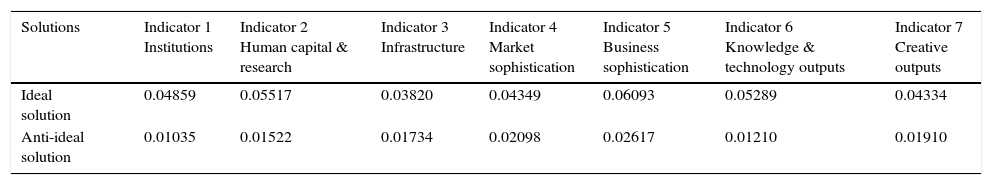
The next step was to identify the positive ideal solution points, as maximum rankings for each alternative in each criterion; in addition to the anti-ideal points as instructed by the TOPSIS method, which is shown in Table 5.
Identification of ideal and anti-ideal solutions.
| Solutions | Indicator 1 Institutions | Indicator 2 Human capital & research | Indicator 3 Infrastructure | Indicator 4 Market sophistication | Indicator 5 Business sophistication | Indicator 6 Knowledge & technology outputs | Indicator 7 Creative outputs |
|---|---|---|---|---|---|---|---|
| Ideal solution | 0.04859 | 0.05517 | 0.03820 | 0.04349 | 0.06093 | 0.05289 | 0.04334 |
| Anti-ideal solution | 0.01035 | 0.01522 | 0.01734 | 0.02098 | 0.02617 | 0.01210 | 0.01910 |
Source: The authors (2016).
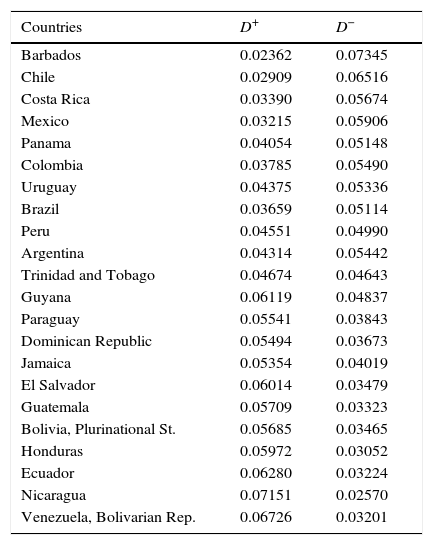
Following the TOPSIS method, the next step was to calculate the Euclidean distances for each country within the configuration of the ideal and anti-ideal solutions, the results of which can be seen in Table 6.
Calculation of the Euclidean distances.
| Countries | D+ | D− |
|---|---|---|
| Barbados | 0.02362 | 0.07345 |
| Chile | 0.02909 | 0.06516 |
| Costa Rica | 0.03390 | 0.05674 |
| Mexico | 0.03215 | 0.05906 |
| Panama | 0.04054 | 0.05148 |
| Colombia | 0.03785 | 0.05490 |
| Uruguay | 0.04375 | 0.05336 |
| Brazil | 0.03659 | 0.05114 |
| Peru | 0.04551 | 0.04990 |
| Argentina | 0.04314 | 0.05442 |
| Trinidad and Tobago | 0.04674 | 0.04643 |
| Guyana | 0.06119 | 0.04837 |
| Paraguay | 0.05541 | 0.03843 |
| Dominican Republic | 0.05494 | 0.03673 |
| Jamaica | 0.05354 | 0.04019 |
| El Salvador | 0.06014 | 0.03479 |
| Guatemala | 0.05709 | 0.03323 |
| Bolivia, Plurinational St. | 0.05685 | 0.03465 |
| Honduras | 0.05972 | 0.03052 |
| Ecuador | 0.06280 | 0.03224 |
| Nicaragua | 0.07151 | 0.02570 |
| Venezuela, Bolivarian Rep. | 0.06726 | 0.03201 |
Source: The authors (2016).
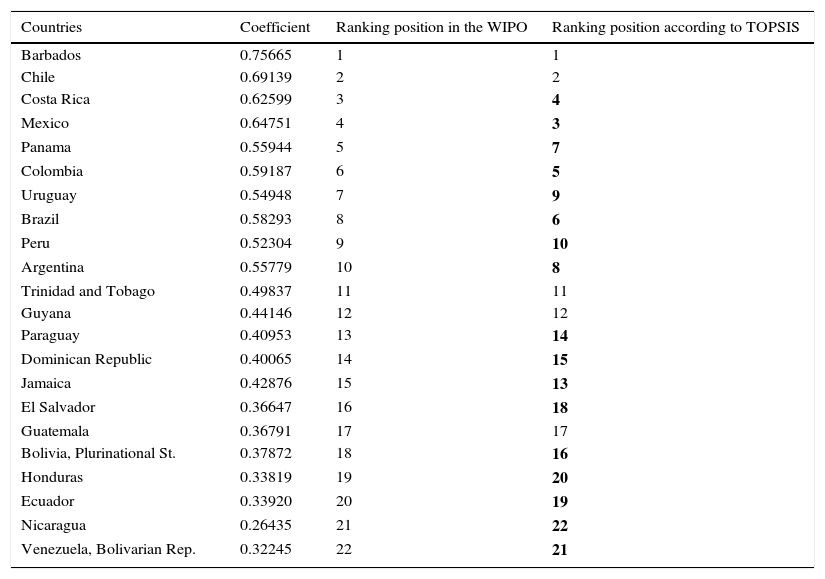
The calculation of the coefficients between the largest and smallest distances enables the final sorting of the alternatives according to the coefficient, as shown in Table 7 where changed positions’ ranking are in bold text.
Ranking of alternatives by the coefficient.
| Countries | Coefficient | Ranking position in the WIPO | Ranking position according to TOPSIS |
|---|---|---|---|
| Barbados | 0.75665 | 1 | 1 |
| Chile | 0.69139 | 2 | 2 |
| Costa Rica | 0.62599 | 3 | 4 |
| Mexico | 0.64751 | 4 | 3 |
| Panama | 0.55944 | 5 | 7 |
| Colombia | 0.59187 | 6 | 5 |
| Uruguay | 0.54948 | 7 | 9 |
| Brazil | 0.58293 | 8 | 6 |
| Peru | 0.52304 | 9 | 10 |
| Argentina | 0.55779 | 10 | 8 |
| Trinidad and Tobago | 0.49837 | 11 | 11 |
| Guyana | 0.44146 | 12 | 12 |
| Paraguay | 0.40953 | 13 | 14 |
| Dominican Republic | 0.40065 | 14 | 15 |
| Jamaica | 0.42876 | 15 | 13 |
| El Salvador | 0.36647 | 16 | 18 |
| Guatemala | 0.36791 | 17 | 17 |
| Bolivia, Plurinational St. | 0.37872 | 18 | 16 |
| Honduras | 0.33819 | 19 | 20 |
| Ecuador | 0.33920 | 20 | 19 |
| Nicaragua | 0.26435 | 21 | 22 |
| Venezuela, Bolivarian Rep. | 0.32245 | 22 | 21 |
Source: The authors (2016).
The robustness of an analytical procedure is a measure of its ability to maintain the results when subjected to deliberate variations in method parameters. The robustness analysis is often used for the evaluation of MCDA methods (Hites, De Smet, Risse, Salazar-Neumann, & Vincke, 2006; Vecchi, Della Piana, & Vivacqua, 2015; Vincke, 2003). In the specific case of GII, the correlation between the rankings of the GII itself with TOPSIS enables an evaluation of the robustness of the results. Thus, the degree of ordinal correlation is directly related to the robustness of the GII method (Magdy & Jones, 2010; Wagner, 2000).
The most widely-used statistical methods for the ordinal correlation are the Kendall and Spearman coefficients (Gibbons & Chakraborti, 2011; Hauke & Kossowski, 2011). These non-parametric methods take the positions into account that the values of the variables involved occupy when ranked. Results may vary in the interval [-1, 1], characterizing a high negative or positive correlation, respectively. The coefficient of zero indicates no correlation between the rankings of the methods under analysis (Gibbons & Chakraborti, 2011).
Table 7 consolidates the results obtained by the application of TOPSIS to the GII 2015 database. The results show a significant similarity between the rankings. The application of the ordinal correlation methods by Kendall and Spearman revealed the robustness of the GII. The Kendall tau indicator was 0.8874459 and the Spearman rho was 0.9785432. According to Evans and Over (2013), indices above 0.8 indicate a very strong positive correlation between the variables, represented by the rankings of the methods. These values of the correlations were calculated based on the “cor” function of the “R” software (R-Core-Team, 2016).
Analysis and discussion of the indicatorsThe 79 innovation indicators from WIPO structured in 3 categories and 7 pillars with 2 sub-pillars reveal that the methodology to select the annual innovation indicators in global terms is not considered by merely presenting a correlation of 95% between the indicators and their pillars; likewise they are designed according to the epistemology of the theory of capital evolution, using the protective belt in the theory of competitive advantage, to build their scenarios of relevant variables in its hard core (with the articulation of the dimensions) for the applicability and qualitative adherence to Porter's Diamond model, with the TOPSIS multicriteria method revealing a change in position in 17 countries.
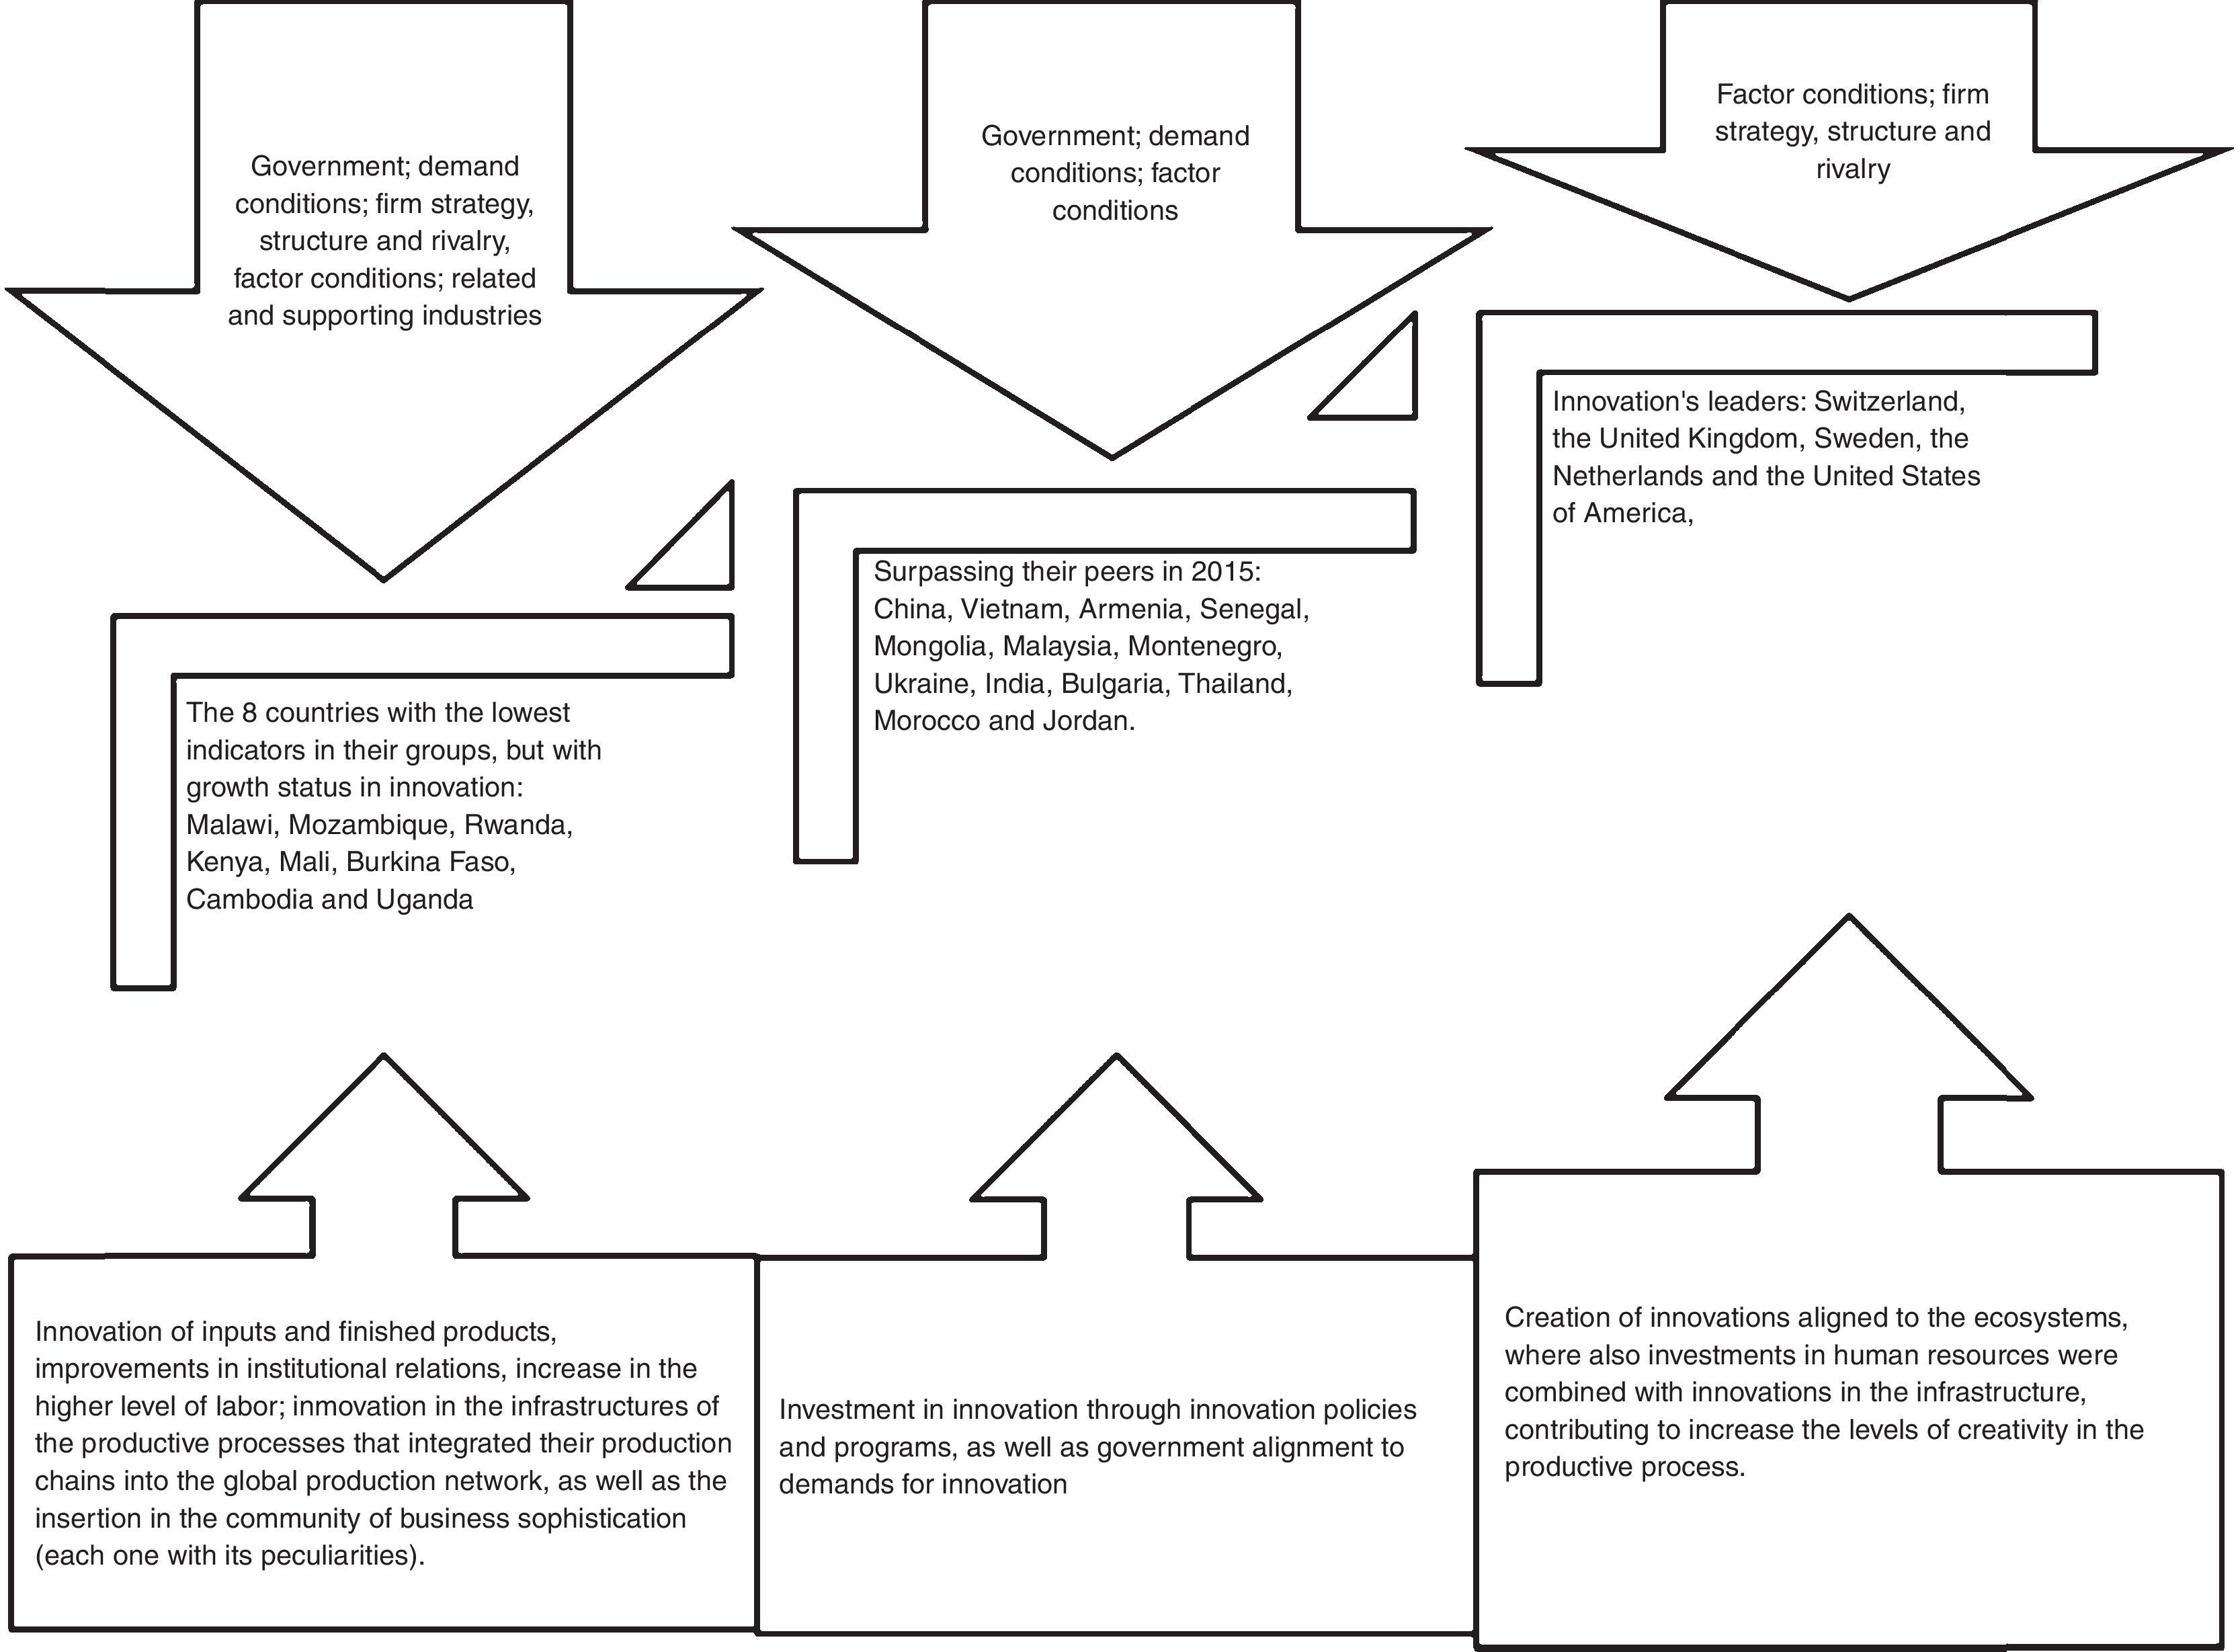
Fig. 3 illustrates the innovation indicators and the global ranking in which the Latin America and the Caribbean are placed within a qualitative outlook regarding the TOPSIS multicriteria method studied in the data of the WIPO indicators.

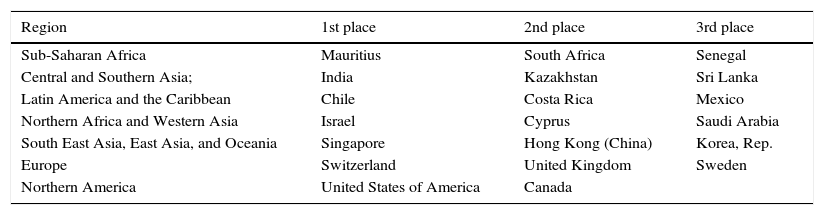
Table 8 shows that Sub-Saharan Africa rose considerably in relation to 2014 in its first three places, just as other African countries have made progress regarding innovation. Although Latin America and the Caribbean show little improvement as countries that stand out as innovative, Brazil, Mexico and Argentina remain the dominant economies in the region, maintaining their average scores in innovation from 2014 to 2015. Chile, Costa Rica and Colombia rose in comparison to their peers in terms of economic growth, and Peru and Uruguay revealed themselves as emerging markets. The level of innovation in the countries, therefore, particularly in developing countries – increased and the national policies and programs for innovation have also grown consistently (Cornell University et al., 2015).
Three first places in the regions analyzed by the WIPO in 2015.
| Region | 1st place | 2nd place | 3rd place |
|---|---|---|---|
| Sub-Saharan Africa | Mauritius | South Africa | Senegal |
| Central and Southern Asia; | India | Kazakhstan | Sri Lanka |
| Latin America and the Caribbean | Chile | Costa Rica | Mexico |
| Northern Africa and Western Asia | Israel | Cyprus | Saudi Arabia |
| South East Asia, East Asia, and Oceania | Singapore | Hong Kong (China) | Korea, Rep. |
| Europe | Switzerland | United Kingdom | Sweden |
| Northern America | United States of America | Canada |
Source: Cornell University et al. (2015).
This study emphasized the use of the quantitative methodology of the TOPSIS multicriteria method to identify the feasibility of a qualitative analysis of Porter's Diamond regarding the observation of the feasibility in sizing the global innovation indicators established for the analysis of the most innovative countries in 2015 by the WIPO.
The observations about the adherence of the capital evolution theories regarding the competitiveness strategies of firms in a transnational framework reveal that, when the qualitative principles and methodology of the innovation indicators in the countries of Latin America and the Caribbean are observed, a small change in the position in the ranking occurs using the TOPSIS multicriteria methodology. This similarity in the rankings, corroborated by the high levels of Kendall and Spearman correlation, show the robustness of the GII in the context under analysis.
These results suggest that the national strategic competitiveness should align itself to innovation as a key factor in the positioning of a country in macroeconomic terms. It is also recommended that the innovation indicators be observed through other multi-criteria analysis methods based on the WIPO's yearly change in methodology to generate the annual publication of the ranking of most innovative countries, by means of new, preferably quantitative studies, since adherence impacts may occur with other management models and dimensions of strategic competitiveness outside of the scope proposed in this study.
This study also contributes to the promotion of an improved understanding of the construction of the categorical national innovation indicators with robustness within academia so that other epistemologies may be configured to understand innovation from the perspective of transnational strategic competitiveness, but respecting the qualitative considerations and applying them quantitatively through multicriteria decision-making tools that may outline the adjustments required to the methodologies used in the studies, as well as their analyses, to solidify the identifications of the innovation ranking from WIPO.
Conflicts of interestThe authors declare no conflicts of interest.
Peer Review under the responsibility of Departamento de Administração, Faculdade de Economia, Administração e Contabilidade da Universidade de São Paulo – FEA/USP.