


This article aims to integrate and adapt two classifications of economic activity from the Organization for Economic Cooperation and Development (OECD) and the Statistical Office of the European Commission (Eurostat) into a Brazilian context and contemporary studies of economic development. The classification that emerges, called the “Classification of economic activity according to technology and knowledge intensity”, results in (i) valuing the criteria that deals with the present and future factors of competitiveness, such as technology and knowledge, science and innovation, and transversability and dissemination of information; (ii) overcoming the old dichotomy between manufacturing and services with a new but flexible and gradual classification, ranging from more high-tech and knowledge-intensive activities to low-tech, less knowledge-intensive activities.
“We put the boat on the wind, but could make no headway at all for the eddies, and I was upon the point of proposing to return to the anchorage, when, looking astern, we saw the whole horizon covered with a singular copper-colored cloud that rose with the most amazing velocity.” Edgar Allan Poe, A Descent Into The Maelström
This article has the objective of integrating and adapting two current classifications of economic activity for a Brazilian context and contemporary studies of economic development. The featured classifications are from the Organization for Economic Cooperation and Development (OECD), which groups industrial sectors according to their technological intensity, and the typology from the Statistical Office of the European Commission (Eurostat), which separates service activities according to their knowledge intensity. Their respective integration and adaptation to state-of-the-art debate and Brazil's reality results in: (i) simultaneously considering all economic activity, without the rigid and inflexible opposition between manufacturing and services; (ii) emphasizing the central elements of contemporary competitiveness, such as technology, knowledge, and innovation; and (iii) adhering to existing information sources, allowing a broad sectoral disaggregation and construction of minimally homogeneous activity groups, with possible application in the study of national and regional Brazilian dynamics.
The classification that emerges from the integration and adaptation of these two types of activity will be called the “Classification of economic activity according to technology and knowledge intensity.” Fundamentally, it recognizes the elements that deal with the present and future factors of competitiveness, such as technology and knowledge, science and innovation, transversability and dissemination of information. Such efforts allow the dislocation of old dichotomies that are focused on rigid opposition between manufacturing and services for a new, more flexible categorization that gradually segments activities according to technology and knowledge intensity.
From the point of view of empirical and typological work, the development of the classification—informed by the OECD and Eurostat—involved two returns: that to Innovation Research (PINTECs) of the Brazilian Institute of Geography and Statistics (IBGE) from 2000, 2003, 2005, and 2008, in order to review and replicate the criteria used by the OECD for the delimitation of technological intensity; and a return to the National Classification of Economic Activities (CNAE) to apply a refinement of the criteria originally developed by Eurostat.
It is important to note that the classification is the result of the progress and maturation of a research agenda carried out between 2003 and 2012 by a research group led by Alvaro Comin for the Brazilian Center of Analysis and Planning (CEBRAP). Although this article will give a final form to the classification, its conception and development is inseparable from the maturation of academic activities and research of the group. The following text expands, refines, and strengthens arguments and proposals developed in previous work (Abdal et al., 2011; Torres-Freire, 2010; Torres-Freire et al., 2012).1
The paper is structured in four sections in addition to this introduction, which contains the objectives and motivations of the article, and conclusions are drawn at the end. The next section provides justifications for the integration and adaptation of the two economic activity classifications. The third section develops a step-by-step construction of the classification, explaining each of the choices taken. Finally, the fourth section discusses the methodological and analytical implications of using the classification.
Introduction: in defense of a cross-sectional analysis of productive structureTransformations in modes of organizing production starting from the 1970s with certain elements directly related to science, technology and research (ST&I) hitherto earned an unheard of role in the building and maintenance of the competitiveness of firms, cities, regions, and countries (Castells, 1999). This new role is embedded in a context of the restructuring of production and firm de-verticalization, which engenders a double and interconnected movement (Harvey, 2009). On the one hand, there is the emergence of a new geography of production with trends of dispersion of manufacturing and conformity to global production and distribution networks. On the other, there is a tendency for the functional concentration of world economy command, control, and management activities, with consequent specialization of certain areas and regions (Sassen, 2001). Thus, a functional type of specialization emerged in urban centers, in contrast to traditional sectorial specializations (Duranton & Puga, 2005).
Despite these changes, much contemporary analysis has continued to structurally conform to a logic that tends to place industrial and tertiary activities into opposing groups, with a clear favoring of the first. They have therefore maintained traditional perspectives in analyzing and classifying productive structures, considering “services” as a quasi-residual group of quite heterogeneous activities that only have in common the fact that neither is primary nor secondary (Kon, 2004).2
Analysis based on traditional paradigms ignore certain evidence. Firstly, the existence of complementary relationships and functionality of certain industrial activities and services (Cohen & Zysman, 1987), many of which gained strength with firm processes of vertical disintegration and externalization. Secondly, the emergence of convergence trends between manufacturing and services is shown in the integration of technological and organizational matrices and in the increasing homogenization of demands for specialized services, infrastructure, and human resources (Bernardes et al., 2005; Boden & Miles, 2000).3
The article draws attention to the viability and appropriateness of analyzing the structure of production according to a renewed perspective, due to this lack of coordination between changes in production systems and the inadequacy of traditional perspectives and classifications. A new view is needed that is (i) sensitive to the growing role played by technology, knowledge, and innovation; (ii) recognizes cross-sectional productive structures; and (iii) is less confined by the straitjacket of traditional sectoral divisions.
By shifting the established opposition of manufacturing versus tertiary activities for more technological and knowledge-intensive activities versus less technological and knowledge-intensive ones, our classification is designed to incorporate two advantages into the universe of taxonomies: (i) a logic that allows for a new way of studying manufacturing and services; (ii) emphasizing foundational elements of competitiveness in today's economy. The grouping of activities according to their technological and knowledge intensity allows a focus on production, use, and dissemination of intra- and inter-sectoral technology and knowledge.
It is worth noting that knowledge and technological intensity are not necessarily synonymous with innovation. Some business activities tend to be more innovative, such as the pharmaceutical industry or information technology; however, innovation can also be present in activities of lower technological intensity, such as the introduction of new processes to make biofuels or new materials in textile industry products.
Criteria for the classification's construction: fundamentals, the original proposal, and adjustmentsThe methodological construction of taxonomies for a cross-sectional analysis of productive structures is not a simple task, especially when this taxonomy is sectorial. Besides the fact that the existing classifications have led to profound theoretical and methodological dispute, their construction involves submission of the typological labor to the extent and quality of available data sources. That is, it involves (i) contentious activity aggregations; (ii) joining different activities in the same category; (iii) the inadequacy of certain types of analyzes or exercises; and (iv) inapplicability to certain spatio-historical realities.
However, the act of classifying has positive aspects that compensate for the difficulties that they might cause. Positives include the organization of debate, the ability to draw comparisons in time and space, and, in particular, new ways of covering certain phenomena. The challenge, from the point of view adopted here, is to mobilize the conceptual foundations that allow the valuing of elements such as science, technology, and knowledge in order to analyze productive structures and anchor them in existing databases. An important aspect is the possibility of carrying out relevant sectoral and spatial disaggregation for consistent analysis.
The starting point for the development of the classification for technological and knowledge intensity was the typologies already developed and employed by the OECD and Eurostat. While the OECD's taxonomy is aimed at group industries according to their degree of technological intensity, Eurostat stipulates the separation of service activities according to their knowledge intensity.
The advantage of starting from classifications that already exist is, first, the possibility of dealing with classifications that have already been tested in other spaces and realities, and have been the object of discussion by experts from different fields and interests. The second advantage is the increased possibility for national and international comparisons, avoiding mobilization efforts in the conception and development of an aggregation that no one else uses.
As explained below, both classifications were an important starting point, but underwent significant alternations and adjustments along the way. It reinforces once again that one of the main contributions of this article has to do with the possibility of employing a typology of economic activity that integrates, in the same taxonomic structure, manufacturing and services.
Industrial activities and technology intensity: construction stages of a typologyThe first attempts to create and develop a classification system for industrial activities according to technological effort for a broad set of countries was done by the OECD in the 1970s. This first taxonomy was based on a classification originally created for the U.S. productive structure, but was then extrapolated for all OECD countries. It aimed to compare countries, especially with regard to foreign trade.
In the mid-1980s, the OECD undertook a first review of the taxonomy, and decided to maintain the same objectives. In order to minimize the resulting effects from the excessive influence of the North American production structure on the classification, it took a new outlook. From a sample of eleven member countries, there was the rise of an industry classification that subdivided industry into three segments: high, medium, and low technology. The criteria used to determine technological intensity was the share of revenue spent on research and development (R&D).
Ten years later, a new revision was made that conserved initial attempts at international comparison and emphasized foreign trade (Hatzichronoglou, 1997). Based on sources of the latest information, the revision increased the sectoral breakdown of the classification, which now divided the industry into four groups: high, medium-high, medium-low, and low technology. A new indicator of direct technological effort (share of R&D expenditure over added value) and an indicator of indirect technological effort (share of expenditure on the purchase of intermediate goods and capital-intensive technology) were incorporated as classification criteria. A product classification was also proposed—complementary to the sectors—which aimed to minimize problems related to the consideration of sectors as units of analysis.
The classification here was proposed from the latest version of the OECD's. In previous works (Abdal, 2009, 2010; Comin et al., 2012; Torres-Freire, 2010), an adaptation by the IBGE (2003) of the OECD classification for the Brazilian production structure was used. Having PINTEC by 2000 and CNAE 1.0 as a source of information and the activities’ table of reference, the cited adaptation ranks industries4 according to the degree of direct technological effort (R&D/net profit), followed by a subsequent grouping into quartiles. The first quartile corresponds to a high-tech segment, the second to medium-high, and so on.
A very immediate problem with these first attempts was the reformulation of the CNAE in the mid-2000s, which posed serious obstacles to the construction of historical series. This is because CNAE 2.0 is not immediately comparable to CNAE 1.0 due to the three-digit codes necessary for the classification.
A partial solution was outlined by Abdal et al. (2011), but the temporal analysis was risky. This is because the procedure adopted was the extrapolation of the IBGE classification for CNAE 2.0 from compatibility to four digits. The result—although satisfactory for exclusive CNAE 2.0 analysis—was an excessively complex and fragmented classification, because it depended on the CNAE four-digit codes and did not permit comparisons in historical series.
A problem of greater magnitude remained, namely, the density of the classification. What guarantees that the standards of technological efforts captured by research in a single year will remain valid for the decade? Worse still, what is the guarantee that the data from a single year were not derived from a specific situation?
It is precisely on this issue that the efforts made and presented in this article are addressed. That is to say, a reconsideration of PINTECs 2000, 2003, 2005, and 2008 was undertaken in order to re-categorize direct technological effort of Brazilian industries and their subsequent grouping into the four segments of technological intensity. The main indicator employed was average R&D spending. In this exercise, two periods should be highlighted that are not immediately comparable. The first includes PINTECs from 2000 to 2005 and still incorporates CNAE 1.0, and a second relative to PINTEC 2008 that uses CNAE 2.0.5
If the relative problem of the exclusive reliance on PINTEC of a single year has been remedied, the problem of the relative incompatibility between the CNAEs has not. Regarding the first problem, we emphasize that the result is a more reliable classification, because it considers the average effort over the period. However, the second problem unresolved leaves impacts, which can—at most—be minimized.
From the point of view of the construction of the classification, the pursuit of the greatest possible comparability was chosen. Direct technological effort was calculated, but it was not considered exclusive criterion for the allocation of each sector. At the same time, the place in which each sector was allocated in the classification for CNAE 1.0 and the magnitude and trajectory (ascending or descending) of spending on R&D were considered. The result is a classification adapted from CNAE 2.0, where most industries are in the same class of technological intensity that it had previously been. Importantly, however, that specific adjustments in the allocation of sectors were made from non-empirical considerations suggested by the literature.
Table 1 sets out the sectors classified here as high technology. They include activities related to the manufacturing of transportation equipment (aircraft and vehicles), computer and communication equipment, office machinery, electronics, measuring instruments and industrial automation, medical, hospital, optical, and dental equipment (MHODE), pharmaceuticals, and petroleum derivatives.
High tech industries by sectors of activity (the CNAE 1.0 & 2.0) and share of direct expenditure on R&D by net profit, Brazil, 2000–2008.
| Sectors of activity – CNAE 1.0 | 2000 | 2003 | 2005 | Average |
|---|---|---|---|---|
| 35. Other transport equip. | 2.75 | 4.63 | 3.47 | 3.61 |
| 34.1 & 34.2. Cars, utilities, trucks & buses | * | 2.14 | 2.07 | 2.11 |
| 32 (Excluding 32.1) Machinery & communication equip. | 2.40 | 1.93 | 1.67 | 2.00 |
| 30. Office mach. & computer equip. | 1.52 | 2.33 | 1.82 | 1.89 |
| 33. EMHO, precision inst./Opt. & equip. auto ind. | 1.85 | 1.27 | 2.34 | 1.82 |
| 31. Machinery, electrical appliances & equipment | 2.03 | 0.71 | 1.35 | 1.36 |
| 24.5. Medicines | 1.48 | 0.97 | 1.27 | 1.24 |
| 32.1. Basic electronics equipment | 1.27 | 0.47 | 0.91 | 0.89 |
| 23.2. Petroleum refining | 0.96 | 0.00 | 0.11 | 0.36 |
| Sectors of activity – CNAE 2.0 | 2008 | Compat. |
|---|---|---|
| 30. Other transport equip. | 2.02 | No |
| 29.1 & 29.2. Cars, utilities, trucks & buses | 2.01 | No |
| 26.5, 26.6, 26.7 & 26.8. Other elec. prods. & optical | 1.90 | No |
| 26.3 & 26.4 communication equip. | 1.62 | No |
| 21. Pharmaceutical chemicals & pharmaceuticals | 1.44 | No |
| 27. Machinery, electrical appliances & equip. | 1.01 | No |
| 19.2. Petroleum refining | 0.96 | No |
| 26.2 Equip. computer & peripherals | 0.72 | Yes |
| 32.5. MHODE | disag. | Yes |
| 26.1. Electronic components | 0.63 | Yes |
Comparing the compatibility of the classification with both CNAEs, a trend of sectoral consistency was found in terms of the R&D spending structure. Exceptions include computer equipment and electronic components. For comparability reasons—and considering the fact that the proportion of R&D spending is not far from the boundary between high and medium-high technological intensity—they were placed in the high intensity segment. One possible explanation for their relatively inferior performance may be the fact that their respective CNAE divisions were considered to be at a greater level of disaggregation in 2008.
A clarification is needed in relation to the MHODE sector. In reformulating CNAE, they were transferred from Division 33, with industrial automation equipment moving to Division 36 of the new CNAE, which is mostly composed of different products (jewelry, musical instruments, and fishing and sports items, etc.). However, the design of PINTEC 2008 did not allow the disaggregation of Division 36 in a way that allowed the MHODE sector to be treated as part of the miscellaneous group of different products. Hence, the solution considered better was to breakdown Division 36 of the new CNAE, keeping the various products classified as medium-high technology and MHODE as high technology.
Petroleum refining was raised to the high-technological intensity group for two reasons. First, the data on R&D expenditures contain large variations between the years, that is, relatively high levels for 2000 and 2008—enough to classify it as high intensity—after very low levels for 2003 and 2005. Second, given the specifics of the sector in Brazil, extraction and petroleum refining present particular and relatively high technological challenges.
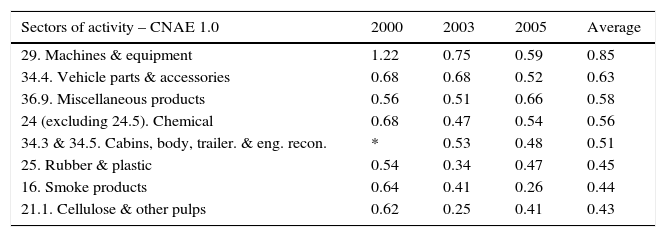
The sectors classified as having medium-high technological intensity can be seen in Table 2. They include machinery and equipment industries, auto parts, including cabins, truck bodies, trailers, and engine reconditioning, and diverse, chemical, smoke, cellulose, rubber, and plastic products (Table 3).
Medium-high tech industry by sector of activity (CNAE 1.0/2.0) and share of direct expenditure on R&D by net profit, Brazil, 2000–2008.
| Sectors of activity – CNAE 1.0 | 2000 | 2003 | 2005 | Average |
|---|---|---|---|---|
| 29. Machines & equipment | 1.22 | 0.75 | 0.59 | 0.85 |
| 34.4. Vehicle parts & accessories | 0.68 | 0.68 | 0.52 | 0.63 |
| 36.9. Miscellaneous products | 0.56 | 0.51 | 0.66 | 0.58 |
| 24 (excluding 24.5). Chemical | 0.68 | 0.47 | 0.54 | 0.56 |
| 34.3 & 34.5. Cabins, body, trailer. & eng. recon. | * | 0.53 | 0.48 | 0.51 |
| 25. Rubber & plastic | 0.54 | 0.34 | 0.47 | 0.45 |
| 16. Smoke products | 0.64 | 0.41 | 0.26 | 0.44 |
| 21.1. Cellulose & other pulps | 0.62 | 0.25 | 0.41 | 0.43 |
| Sectors – CNAE 2.0 | 2008 | Compat. |
|---|---|---|
| 29.4. Vehicle parts & accessories | 0.74 | No |
| 12. Smoke products | 0.72 | No |
| 32 (except 32.5) Miscellaneous products | disag. | Yes |
| 20. Chemicals | 0.59 | No |
| 22. Rubber & plastic | 0.48 | No |
| 17.1. Cellulose & other pulps | 0.46 | No |
| 29.3 & 29.5. Cabins, body, trailer. & eng. recon. | 0.79 | Yes |
| 28. Machines & equipment | 0.46 | Yes |
Medium-low technology industry by sector of activity (CNAE 1.0 & 2.0) and share of direct expenditure on R&D by net profit, Brazil, 2000–2008.
| Sectors – CNAE 1.0 | 2000 | 2003 | 2005 | Average |
|---|---|---|---|---|
| 26. Non-metallic minerals | 0.37 | 0.27 | 0.39 | 0.34 |
| 27.1, 27.2 & 27.3. Metalworking | 0.45 | 0.31 | 0.23 | 0.33 |
| 36.1. Furniture | 0.28 | 0.20 | 0.46 | 0.31 |
| 28. Metal products | 0.43 | 0.26 | 0.23 | 0.31 |
| 19. Leather, travel goods & footwear | 0.32 | 0.20 | 0.37 | 0.30 |
| 21. (Excluding 21.1) Paper & packaging | 0.34 | 0.23 | 0.22 | 0.26 |
| Sectors – CNAE 2.0 | 2008 | Compat. |
|---|---|---|
| 15. Leather, travel items & footwear | 0.41 | No |
| 25. Metal products | 0.27 | No |
| 17. (Excluding 17.1). Paper & packaging | 0.26 | No |
| 24.1, 24.2 & 24.3. Steel working | 0.22 | No |
| 23. Non-metallic minerals | 0.15 | Yes |
| 31. Furniture | 0.16 | Yes |
As in the previous segment, there is a trend of structural similarity between the periods 2000–2005 and 2008, with only three compatibilities. The first is the already discussed case of MHODE and various products. The second refers to groups 29.3 and 29.5 (cabins, truck bodies, trailers and engine reconditioning) of CNAE 2.0. Although the proportion of spending on R&D allows its allocation in the high-intensity group, we preferred for it to be assumed as medium-high for reasons of comparability.
Finally, the machinery and equipment sector shows a declining trend of relative spending on R&D over the decade. Given their average performance and its potential to play a strategic role as a diffuser of technical progress by its productive structure, the option was to keep it in the medium-high intensity category. It is recognized here that the industry has been presented with some issues—expressed in the decreasing commitment to R&D—which can be interpreted as sectorial difficulties in order to better follow the technological boundary.6
In the next table, we observe the sectors allocated in the medium-low technology group. In this group, there are industries of metal products, non-metallic minerals, furniture, leather and footwear, and paper.
Although only two compatibilizations have been made (non-metallic minerals and furniture), for comparison reasons, this was the segment most affected by the sum of the compatibilizations. This is because the displacement of sectors to medium-high (machinery and equipment) or low tech sectors (metallurgy of non-ferrous metals, food, and printing and reproduction) became more intense than other sectors, leaving it with six industries.
The medium-low technology segment seems to be a transitional area between the two segments of higher and low-technology industry. The fact that the separation between it and the low-intensity industry is quite tenuous stands out. This is because the observation of relative expenditures on R&D reveals a quasi-continuity between the two groups, as opposed to discontinuity between high and medium-high tech industries and medium-high and medium-low tech industries.
The set of low technology sectors can be seen in Table 4. They include textiles and clothing, food, beverages, wood, publishing, printing and reproduction, non-ferrous metallurgy, coke, and alcohol.
Low tech industry by sector of activity (CNAE 1.0 & 2.0) and share of direct expenditures on R&D by net profit, Brazil, 2000–2008.
| Sectors – CNAE 1.0 | 2000 | 2003 | 2005 | Average |
|---|---|---|---|---|
| 18. Clothing & accessories | 0.22 | 0.29 | 0.23 | 0.25 |
| 17. Textiles | 0.30 | 0.21 | 0.23 | 0.25 |
| 27.4 & 27.5. Metallurgy of non-ferrous & casting | 0.39 | 0.12 | 0.11 | 0.21 |
| 15 (excluding 15.9). Foods | 0.28 | 0.10 | 0.14 | 0.18 |
| 20. Wood | 0.23 | 0.11 | 0.13 | 0.16 |
| 15.9. Drinks | 0.06 | 0.12 | 0.11 | 0.10 |
| 22. Pub., printing. & reprod. of recorded media | 0.12 | 0.05 | 0.09 | 0.09 |
| 23. (excluding 23.2). Coke, alcohol & nuclear comb. | 0.03 | 0.00 | 0.08 | 0.04 |
| Sectors – CNAE 2.0 | 2008 | Compat. |
|---|---|---|
| 24.4 & 24.5. Non-ferrous metallurgy & casting | 0.18 | Yes |
| 13. Textiles | 0.17 | No |
| 10. Foods | 0.24 | Yes |
| 18. Printing and reproduction of recorded media | 0.24 | Yes |
| 14. Clothing & accessories | 0.12 | No |
| 16. Wood | 0.10 | No |
| 33. Maint./rep. & inst. of machinery & equip. | 0.10 | No |
| 11. Drinks | 0.08 | No |
| 19 (excluding 19.2). Coke & biofuel (Alcohol/other) | 0.02 | No |
Comparing 2000–2005 with 2008, three compatibilization were made, all concerning the reclassification of sectors in the low-tech activities group. The sectors reclassified in 2008 were non-ferrous metallurgy (Groups 24.4 and 24.5), food (Division 10), and printing and reproduction (Division 18). In spite of the comparability of earnings between the two periods, the key to reclassifying these sectors was the fact that the literature commonly considers them in the low-technological intensity group, with a standard of innovation relatively more dependent on innovation in other sectors of the industry via purchases of machinery and equipment.
Tertiary activities and knowledge intensityThe parameters used for industry are not immediately replicable for the services sector. It is a more complicated case because of the high heterogeneity of their technical configurations, the lower availability of statistical information, and the relatively limited attention given by analysts. All this together has meant a smaller sedimentation of the taxonomic debate for tertiary activities.
In addition, the consideration of the innovation debate in services suggests extra care to be taken (Gallouj & Weinstein, 1997; Marklund, 2000; Miles, 2005), which discourage the establishment of methodologies and measurement techniques of convergent innovation with industry. On the one hand, innovation in services is less dependent on R&D efforts, with most of the activities and companies not doing it, setting a distinct pattern where non-technological innovation has greater weight. On the other hand, there are issues related to the specificities of services, such as their intangible character, the difficulty of distinguishing between product and process innovation, and the greater importance of human and organizational factors for their competitiveness.
Given these considerations, the classification of the chosen service sector is inspired by the Eurostat typology (2008). According to Eurostat, services can be grouped as intensive or non-knowledge intensive by applying criteria based on the similarity of the service done. Greater efforts in R&D, increased use of innovation, the intensive use of information technologies, and highly-skilled employees are characteristics of so-called knowledge-intensive services (KIS). Moreover, internal subdivisions to KIS and non-KIS can be done according to the nature of the service. Issues related to the time of service (before, during, or after the production process) and the service applicant (other companies, society, or individuals/households) help to compose the subgroups (Comin, 2003).
Improvements to the Eurostat classification and compabilizations with CNAE 1.0 (Torres-Freire, 2010; Torres-Freire et al., 2012) and 2.0 (Abdal et al., 2011) have been made. It is important to state that concerns about comparability between the CNAEs—met by applying the same criteria to both CNAEs—were more logical than empirical. This is because we chose to incorporate more gains into the classification from the CNAE reform for services compared to manufacturing. Justifications concern: (i) the artisanal nature of the classification of services, dependent on the four digits of CNAEs; (ii) the lower possibility of comparison, in the absence of a minimally consensual and sedimented classification in the international debate; and (iii) the absence of objective and measurable criteria for services, like R&D is to industry. Table 5 is an example of empirical work for the improvement and adaptation of the Eurostat classification to a Brazilian context. The task, as seen in table, was done for each of the service activities for the four digits of the CNAE.
Examples of improvement and adaptation of Eurostat typology of selected activities and CNAES 1.0 & 2.0.
| Class of activity CNAE 1.0 | Description (note) | Destination |
|---|---|---|
| 7411-0 Legal activities | See: http://cnae.ibge.gov.br/?view=classe&tipo=cnae&versao=3&classe=74110 | SIC-Professional |
| 7412-8 Accounting & auditing activities | See: http://cnae.ibge.gov.br/?view=classe&tipo=cnae&versao=3&classe=74128 | SIC-Professional |
| 7413-6 Market & opinion research | See: http://cnae.ibge.gov.br/?view=classe&tipo=cnae&versao=3&classe=74136 | SIC-Professional |
| 7414-4 Management/equity holdings | See: http://cnae.ibge.gov.br/?view=classe&tipo=cnae&versao=3&classe=74144 | Excluded |
| 7415-2 Company headquarters | See: http://cnae.ibge.gov.br/?view=classe&tipo=cnae&versao=3&classe=74152 | Excluded |
| 7416-0 Business management consultancy | See: http://cnae.ibge.gov.br/?view=classe&tipo=cnae&versao=3&classe=74160 | SIC-Professional |
| Class of activity CNAE 2.0 | Description (note) | Destination |
|---|---|---|
| 6311-9 Data processing & providers | See: http://cnae.ibge.gov.br/?view=classe&tipo=cnae&versao=9&classe=63119 | SIC-Technology |
| 6319-4 Portals, prov. of content & other | See: http://cnae.ibge.gov.br/?view=classe&tipo=cnae&versao=9&classe=63194 | SIC-Technology |
| 6391-7 News agency | See: http://cnae.ibge.gov.br/?view=classe&tipo=cnae&versao=9&classe=63917 | SIC-Media&Culture |
| 6399-2 Other acts. of info. services | See: http://cnae.ibge.gov.br/?view=classe&tipo=cnae&versao=9&classe=63992 | SIC-Media&Culture |
The process of building and cleansing the taxonomy of service activities can be divided into three stages. At first, having CNAE 1.0 as a reference, five groups of KIS were delineated, which meant—in comparison to the taxonomy of Eurostat—the creation of the groups, KIS-Media, KIS-Social, and KIS-Professional, as well as conducting small adjustments to the existing KIS-Technology and KIS-Finance.
Subsequently, the classification was made compatible with CNAE 2.0 and minor adjustments were made. The most significant was the incorporation of cultural activities to KIS-Media, turning it into KIS-Media&Culture and expanding interlocution with the debate on the culture economy.
Finally, greater segmentation of what was previously called Other Services, generated two new groups: (I) Other Productive Services (intermediate activities in support of production that do not deal extensively with knowledge); and (ii) Other Household Services (activities aimed at individual demand that are also not knowledge intensive).7
The result:
- •
KIS-Technology (KIS-T): Telecommunications, IT, data processing and hosting, architecture and engineering, tests and technical analysis, and R&D of physical and exact sciences.
- •
KIS-Professional (KIS-P): Legal, accounting, and auditing activities, business management consulting, R&D in social sciences and humanities, advertising, market research, design, and photography.
- •
KIS-Financial (KIS-F): Financial and auxiliary activities, insurance, pensions, and health insurance plans.
- •
KIS-Social (KIS-S): Higher, technical professional, and technological education, and educational and health care support (hospitals and laboratories).
- •
KIS-Media&Culture (KIS-MC): Publishing, cinema and audiovisual, music, radio and television, news agencies, and artistic and creative activities linked to cultural and environmental heritage.
- •
Other Productive Services (OPS): Electricity, gas, water, waste management, transport in general, mail, real estate, travel agencies, surveillance and security, (selection and agency labor, work and services for buildings).
- •
Other Services to Households (OSH): Housing, food, veterinary, kindergarten, elementary and secondary education (non-technical), social assistance, national parks, gambling, sports and leisure, community membership organizations, repair/maintenance of computers, communication equipment, personal goods, personal services, and international organizations.
This section discusses more general and abstract questions related to the classification. Most of them appeared, or were at least mentioned previously, and are further expanded on and discussed here. Like this, potential biases arising from the use of the classification can be controlled. The underlying argument is that, despite the problems, the gains brought by employing the classification justify its use.
The considerations outlined here permit an awareness about the limitations and potential biases arising from the use of the classification. They are conceptual in nature and have to do with implications derived from the specific choices made in the course of the process of its development. Therefore, they predate the implementation of possible indicators, exercises, or models that take the classification as reference or as a variable. These considerations relate to five themes: (i) the use of a sectorial classification at the expense of the firm or product classification; (ii) dependence on the existence of a minimally compatible listing of nation and international activities; (iii) the nature of the use of the classification, which is for the analysis of national and/or regional Brazilian dynamics, and not for inter-country comparison; (iv) measurement criteria adopted for the industry (share of R&D expenditure); and (v) meanings associated with adaptation to the context of Brazilian manufacture, a classification originally developed from the OECD sample.
First major theme: a sectoral classificationStarting from the sectoral character of the classification, the greatest difficulty is the assumption—which is not always explicit—of the relative internal homogeneity of the sector, according to which all firms of a certain sector would share the same technological, knowledge, innovative, and competitive standards (Furtado, 2011). This is not true, and the problem tends to lead to three situations: (i) analytical dislocation of nations (and trade) to the regions (and their productive structures); (ii) emphasis on productive structures characterized by strong structural heterogeneity; and (iii) targeting sectors such as electronics, information technology, and pharmaceuticals, whose assembly or mixture of activities are becoming more and more territorially dispersed and, thus, apartheid from the most innovative and value-intensive activities in such sectors.
In spite of such problems, however, there is a lack of empirical alternatives for analyzes requiring high sectorial or geographical breakdown. In this context, basic information such as the Annual Social Information Report (RAIS)8 becomes relevant, given its character and possibilities for sectoral and geographical breakdown as well as historical series.9
One way to minimize these problems, especially those related to the intersection of productive and territory configurations, is through procedures suggested by Barbour and Markusen (2007). Interested in distinguishing clusters of firms from the same sectors, they used indicators of workforce qualifications and occupational situations, such as the employment of engineers, scientists, and researchers or staff associated with the assembly line in order to suggest more intensive agglomerations in product development and complex tasks, or more intensive assembly and routine tasks.
Second major theme: list of available activitiesOne issue that derives from the sectoral character of the classification is the dependence on the available tables of activities, a situation that involves relatively arbitrary cutting of pre-selected activity listings. Disregarding the already discussed problem related to how these tables can change over time, the now-important question concerns the establishment of technical criteria that is able to properly translate the theoretical and conceptual body into empirically measurable categories.
For the manufacture, this question is relatively well resolved, with the term “well settled” meaning the dislocation of the methodological issue, from the one which links concept and empirical category to another: the election of an operational indicator to measure the technological efforts of manufacturing companies. Although there are different indicators, there is no consensus among analysts about their mobilization. Also, it is not a task that can be carried out without reflection on their meaning and effects. This issue will be taken up later.
For services, however, the difficulties are greater. Contrary to what happens for manufacturing, there are no widely tested and discussed typologies whose biases are minimally recognized—or that have objectives and measurable indicators for their construction. Because of this, the work involved in the development of the services taxonomy was categorized as artisan. Eurostat groups the activities according to their similarities and differences. From the description of each activity—drawing on the subject's literature—a reform of this proposal was undertaken. This meant that a more effective breakdown of the sectoral levels was possible (considering the four-digit codes of the CNAE).
Third major theme: the classification and the sense of its incorporationThe other issue derived from the sectoral character of the classification is related to its use, that is, the type of analysis or set of questions that can be made. Traditionally, classifications for the technological intensity of production of goods and services were incorporated into comparative analyzes of countries, with an emphasis on foreign trade (Furtado, 2011). In order to complement and minimize problems of sectoral classifications, the OECD in its last review also proposed a classification of products (Hatzichronoglou, 1997).
This article, however, proposes an operational classification for studies on national (and regional) dynamics of development, depending, therefore, on disaggregated sectorial and geographic data. Rather than seeing this as an insurmountable obstacle, one can understand such a question differently. From the point of view of national or regional analysis, it is quite difficult for quantitative studies to not resort to sectorial aggregations. Thus sectoral classification by technological and knowledge-intensive activities is a substantive gain in terms of detailed analysis.
Fourth great theme: measurement criteriaReturning to the issue of the mobilized indicator for measuring industrial technological intensity, focus should be called to the lack of consensus on the mobilization of R&D indicators. For example, Smith (2000) disagrees with the exclusive mobilization of R&D as a determinant of technological content, as direct expenditures on R&D does not capture diffuse and informal relationships of learning and innovation, which have a relatively larger impact on the sectors considered as medium-low or low-tech. Examples of this include textiles, clothing, or footwear firms that have undertaken significant efforts to diversify production through the creation of new products, where later sectorial dissemination led to the overall increase of production standards (Furtado, 2011). Highlighting cases of sports clothing (uniforms, swimwear, boots, etc.) and the incorporation of new materials from other sectors, such as lycra.10
Additionally, Furtado (2011) points out a second distortion related to a possible decoupling between technological and commercial performance. This is because the calculation of technological intensity is based on the R&D/turnover ratio, which may underestimate the intensity of industrial technology of relatively high quantities of products with extraordinary commercial performance. This would be the case of certain medicines that, with a given amount of investment in R&D, achieved sales performances that were well above average.
Despite the assertion of the above arguments, there are gains related to the use of R&D indicators since analyst take care to specific issues, as the opening of sectorial modernization movements not guided by technology. R&D, while being a proxy for technological content, represents measurable aspects of the development processes, unlike informal information flows (Torres-Freire, 2010). Moreover, the emphasis on measurable and disseminated aspects through national statistical systems enables comparisons and the construction of historical series.
Fifth major theme: adapting historical series to new realitiesFinally, we discuss the consequences of using an adaptation of the OECD typology for the reality of Brazilian industry. Following the clues left by Quadros et al. (1999), Furtado and Quadros (2005), Zucoloto and Rudinei (2005), and Franco et al. (2006), it is possible to adapt a classification of this type for the Brazilian industrial structure, although it involves different meanings related to the peculiar characteristics of the emerging industries.
On the one hand, the taxonomy—as developed by the OECD from a sample of member countries—expresses sectors located at the boundary of technological development. This means that specific countries are unlikely to exhibit productive specializations in all sectors classified as having high-technological intensity. When considering developing countries—together or individually—the result of the classification has more to do with the sectoral effort to incorporate technology and catch up. This thus indicates the gap of each sector vis-à-vis the boundary.
On the other hand, the R&D expenditure structure of developed and developing countries is quite different. The average standard deviation of R&D expenditure tends to be higher for developed countries compared to developing ones, shaping the industry structure of technological efforts by being more dispersed in the former and more concentrated in the latter.
Consequence: distinctive economic performance between developed and developing countries. The high average gap between the most technologically intensive sectors in developing countries compared to the same sectors of their developed counterparts refers to lags in the face of technological boundaries and a lack of globally competitive industry specializations. The lowest average gap in less technologically intensive sectors in developing countries in relation to developed countries as well as to sectors considered high tech in their respective countries expressed the opposite phenomenon: lower or even non-existent lag in relation to the frontier and globally competitive expertise in these sectors.
Taking these two considerations together, adapting the classification of the OECD for the industrial structure of specific countries allows—in general terms—the observation of the efforts of these countries to follow global trends, and the identification of sectors with better performance and specialization. Specifically, the adaptation allows the consideration of sectors that have different performance averages in relation to developed countries in terms of technological effort.
In Brazil, perhaps the most cited case is that of the petroleum industry, which went from medium-low to high-technological intensity. This is because oil extraction in deep water demands more complex solutions than other types of extraction. Another reclassified sector includes the assembly of motor vehicles in the context of a lack of expertise in sectors closer to the technological boundary, which emerges locally as a sector with relatively high-technological effort.
Among the sectors that have been reclassified from high to medium-high technological intensity, we have the case of machinery and equipment. It is also worth mentioning medicines. The literature, as well the aforementioned IBGE adaptation, characterized medicines as medium-high, because, in a Brazilian context, they would be rather intensive to develop. Here, however, the segment was again ranked as high tech, given the upward trend in spending over the 2000s, forming a situation in which its expenditures structure remains distant from the boundary, but in the process of growth and consolidation vis-à-vis national standards.
Final considerationsAs discussed in previous sections, the article developed a classification according to intensity of technology and knowledge that is operational and suitable for contemporary studies of economic development and a Brazilian context. The starting point was two existing classifications of activities, one from the OECD focused on manufacturing, and another from Eurostat for services. Its development involved the integration and adaptation of these two classifications for information sources and listings of national activities, replicating their criteria and sometimes adapting them. Its greatest triumph is to emphasize—in the universe of taxonomies—the current elements of competitiveness, thus valuing factors such as technology, knowledge, science, and innovation in the consideration of economic activity. As a result, the classification overcomes old, closed, and dichotomous ways of addressing economic activity, especially those that build rigid opposition between manufacturing and services or that favors manufacturing over others activities.
Conflicts of interestThe authors declare no conflicts of interest.
The following are the supplementary data to this article:
Analysis employing preliminary versions of the classification: Abdal (2010), Abdal et al. (2011), and chapters of the book Metamorphoses Paulistanas (Comin et al., 2012).
Peer Review under the responsibility of Departamento de Administração, Faculdade de Economia, Administração e Contabilidade da Universidade de São Paulo – FEA/USP.
Two works can be taken as representative of different points of view: Bell (1999) and Castel (2010).
For a measuring attempt, see Tomlinson (1997).
Just as measured by CNAE 1.0 for two or three digits, depending on the sample design of PINTEC.
The Annex sets out the compatibility of the classification with the two CNAES.
This trend can be glimpsed in the differentials of the sector classification to the extent that it changes the reference period. Taking only the year 2000, the sector would be among the high-technology industries; on average, in 2000–2005 it would fall to medium-high; and in 2008, it would be lowered to medium-low.
Agricultural and mining activities, construction, trade, and public administration were not classified according to technology or knowledge.
The RAIS is a national administrative record for the number of formal workers, maintained by the Ministry of Labor and Employment (MTE) with historical series available for research since 1985. Since 2011, its microdata are available to the public via the internet.
Research on economic and sectorial activity, such as the Annual Industrial Survey (PIA), the Annual Survey of Services (PAS), and the IBGE have a sample design that allows small sectoral (and geographic) openings.
For a more comprehensive discussion on innovation patterns in technological activities of lower intensity, see Fornari et al. (2014).
- Descargar PDF
- Bibliografía
- Material adicional