


Bacillus anthracis protective antigen (PA) is a well known and relevant immunogenic protein that is the basis for both anthrax vaccines and diagnostic methods. Properly folded antigenic PA is necessary for these applications. In this study a high level of PA was obtained in recombinant Escherichia coli. The protein was initially accumulated in inclusion bodies, which facilitated its efficient purification by simple washing steps; however, it could not be recognized by specific antibodies. Refolding conditions were subsequently analyzed in a high-throughput manner that enabled nearly a hundred different conditions to be tested simultaneously. The recovery of the ability of PA to be recognized by antibodies was screened by dot blot using a coefficient that provided a measure of properly refolded protein levels with a high degree of discrimination. The best refolding conditions resulted in a tenfold increase in the intensity of the dot blot compared to the control. The only refolding additive that consistently yielded good results was L-arginine. The statistical analysis identified both cooperative and negative interactions between the different refolding additives. The high-throughput approach described in this study that enabled overproduction, purification and refolding of PA in a simple and straightforward manner, can be potentially useful for the rapid screening of adequate refolding conditions for other overexpressed antigenic proteins.
El antígeno protector de Bacillus anthracis (protective antigen, PA) es una importante proteína inmunogénica, en la que se basan tanto las vacunas contra el ántrax/carbunclo como varios métodos diagnósticos. Para estas aplicaciones es esencial que el PA mantenga sus propiedades antigénicas, para lo cual debe estar correctamente plegado. En este estudio se obtuvieron altos niveles del PA en Escherichia coli recombinante. Inicialmente, la proteína se acumuló desnaturalizada en cuerpos de inclusión, lo que facilitó su eficiente purificación en simples pasos de lavado, pero no fue reconocida por anticuerpos específicos. Se analizaron las condiciones de replegado con un sistema de alto rendimiento, evaluando simultáneamente casi un centenar de condiciones diferentes. La recuperación de la capacidad del PA de ser reconocido por los anticuerpos se evaluó por dot blot utilizando un coeficiente que proporcionó una medida de los niveles de proteína correctamente plegada, con un alto grado de discriminación. Las mejores condiciones de renaturalización permitieron un aumento de diez veces en la intensidad de los dot blots con respecto del control. El único aditivo que produjo buenos resultados de forma constante fue la l-arginina. El análisis estadístico de las interacciones entre los diferentes aditivos de replegado permitió identificar tanto interacciones cooperativas como negativas. El enfoque de alto rendimiento descripto en este trabajo, que permitió la sobreproducción, purificación y plegado del PA de una manera sencilla y directa, puede ser potencialmente útil para el rápido screening de las condiciones adecuadas de replegado cuando se sobreexpresan otras proteínas antigénicas.
From ancient times (fifth Biblical plague) to the present day (bioterrorism), Bacillus anthracis continues to be a specially relevant human and veterinary pathogen27,30. Its protective antigen (PA) is the basis for different anthrax vaccines, including second generation recombinant PA and third generation modified rPA vaccines3,7,10,23,31. This antigen is also essential for the evaluation of the serological status of vaccinated humans and animals6,17,21,25. Examples of these applications are diverse, and can range from field serodiagnosis of human cutaneous anthrax14 to serological evaluation of wild animals16,35.
PA is a protein of 83kDa organized in four functional domains27, for a long time was purified from B. anthracis culture supernatants15,28. In an effort to increase its yield, while avoiding the inconvenience of working with this pathogen, PA was produced in Escherichia coli expressing pagA, the gene responsible for PA synthesis in B. anthracis. The first studies that attempted to obtain this protein from recombinant E. coli reported that it suffered extensive degradation during the purification process, and also that the presence of large amounts of contaminant proteins made time-consuming procedures necessary32. Later, full-length PA was expressed in E. coli as a polyhistidine-tagged fusion protein, yielding insoluble protein aggregates18. More recently, untagged PA obtained as inclusion bodies (insoluble aggregates of misfolded proteins) was purified by hydrophobic-interaction chromatography yielding active PA22. Biologically active PA was also produced in the periplasm of recombinant E. coli1,19,20.
Nowadays, the expression of recombinant proteins is essential for many biotechnological applications that generally require that these proteins conserve their native folding characteristics to remain functionally active. When high expression vectors are used for the overexpression of intracellular proteins, these are usually accumulated as inclusion bodies that lack biological activity. Expression as inclusion bodies facilitates protein purification, as they can be easily separated from cell debris13. However, hurdles arise when renaturation is attempted in order to obtain a properly refolded active protein34. Multiple refolding conditions have to be assayed because there is not a universally applicable protocol: specific conditions must be met for each protein and these cannot be determined a priori. As a result, finding the conditions for the efficient refolding of recombinant proteins can be a laborious task.
On the other hand, when expressed as inclusion bodies, some antigenic proteins can still be recognized by specific antibodies in the denatured state. Others need to be refolded, and in these cases antibody recognition can be useful to monitor the efficacy of the refolding protocol used.
In this work, a high throughput approach was used to efficiently monitor the correct refolding of recombinant PA, initially obtained as inclusion bodies. The recovery of the capability of PA to be recognized by antibodies was quantified allowing the assessment and detailed analysis of multiple different refolding conditions.
Materials and methodsCloning of PAB. anthracis reference strain Sterne 34F2 used in this study carries the virulence plasmid pXO1 and lacks pXO2. It had been previously typified using the vrrA locus, as belonging to the VNTR4 variant26. Boiled crude lysates were used as templates for PCR (polymerase chain reaction): several colonies grown overnight at 37°C in Tryptic Soy Agar (Difco) were resuspended in Tris-EDTA buffer (10mM Tris–HCl, 1mM EDTA) and boiled at 98°C during 10min, centrifuged at 14,000×g for 30s and the supernatant directly used as DNA template for pagA amplification. DNA purification steps were avoided to reduce microorganism manipulation to a minimum. It was important to use a fresh non-sporulated culture as a DNA source for PCR. The PCR mixture contained 1× AccuPrime Pfx Reaction Mix, 1mM MgCl2, 1.5U of AccuPrime Pfx DNA polimerase (Invitrogen), 1μM each primer (pagA-forward and pagA-reverse) and 5μl of DNA template in a total volume of 50μl. The oligonucleotides pagA-forward (5′-CACCTTATTAAATGAATCWGAATCAAGTTCC-3′) and pagA-reverse (5′-TTATCCTATCTCATAGCCTTTTTTAGA-3′) were designed using the Oligo program29, with manual optimization. The template was replaced by nuclease-free water for the negative PCR control. PCR assay was carried out as follows: 95°C for 5min, followed by 35 cycles of denaturation at 95°C for 45s, annealing at 55°C for 45s and extension at 68°C for 3min, with a final cycle at 68°C during 20min. Following the PCR, 10μl of amplified product were purified using the Wizard SV gel and PCR clean-up System kit (Promega). Gateway pENTR/D-TOPO (Invitrogen) was used as an entry vector for cloning pagA and transformed into competent E. coli One Shot TOP10 (Invitrogen), according to the manufacturer's instructions. Expression plasmids, pEXP17-pagA, were generated by site-specific recombination, using LR clonase II, between the pENTR/D-TOPO-pagA plasmid previously obtained and the destination vector pDEST17, using the E. coli Expression System kit from the Gateway Technology (Invitrogen), with subsequent transformation of competent E. coli One Shot TOP10 (Invitrogen). The expression plasmids were used to transform competent E. coli BL21 Star (DE3) pLysS One Shot (Invitrogen) to obtain expression clones. Plasmids from two different expression clones were verified by sequencing.
Theoretical molecular weight and protein isoelectric point (pI) of the fusion recombinant protein PA were computed using ProtParam on the ExPASy Server12.
Expression, purification and refolding of PAPA was expressed by culturing expression clones in 200ml MagicMedia E. coli Expression Medium (Invitrogen), in the presence of ampicillin (100μg/ml) and chloramphenicol (34μg/ml), in shake flasks (250 r.p.m.) at 37°C during 24h (OD595=2.1). To analyze inclusion bodies versus soluble fraction proteins, bacteria were centrifuged during 2min at 16,000×g resuspended in BugBuster Protein Extraction Reagent (Novagen) and Benzonase Nuclease (Novagen), and incubated at room temperature for an hour with gentle agitation, according to the manufacturer's instructions. Inclusion bodies were separated from soluble proteins by centrifugation at 5200×g for 5min. Analysis of total, soluble and insoluble proteins was performed in 15% SDS-PAGE, followed by Coomassie Brilliant G-250 staining.
To purify inclusion bodies, cells were collected and frozen at −20°C until processed. One gram of bacteria was suspended in 5ml of BugBuster Protein Extraction Reagent and 125U of Benzonase Nuclease. Previous to refolding, inclusion bodies were solubilized overnight at room temperature in 50mM Tris–HCl, 200mM NaCl, 2mM EDTA, 10mM tris (2-carboxyethyl) phosphine (TCEP), 7M guanidine pH 8.0, with shaking at 250 r.p.m. Insoluble debris was removed by centrifugation at 16000×g for 15min at 4°C, and PA purity was checked by SDS-PAGE.
Protein concentration was measured by the Bradford method4 in a microplate format. Samples (25μl) were diluted in 155μl water, and 45μl reagent concentrate of the Bio-Rad Protein Assay (Bio-Rad) were added.
The iFOLD Protein Refolding System 2 (Novagen) was used to simultaneously assess multiple refolding conditions in a 96-well plate: 10μl of denatured protein were added to each well containing 0.5ml of refolding buffer, obtaining a final concentration of 100ng/μl of PA. A multi-channel pipettor was used to rapidly mix each well by pipetting up and down ten times. The refolding buffers were: MOPS pH 7.0, HEPES pH 7.5, EPPS pH 8.0, TAPS pH 8.5 or CHES pH 9.0, 50mM each, with diverse combinations of salts, redox agents or refolding additives: NaCl:KCl (24:1mM or 240:1mM); TCEP 1mM; reduced: oxidized glutathione (9:1mM or 6:4mM); EDTA 1mM; l-arginine 0.5M; PEG3350 0.06% w/v; non-detergent sulfobetaines NDSB-201 or NDSB-256 0.5M or 1M each; trehalose 0.58M; sorbitol 1.5M; methyl-β-d-cyclodextrin 10mM; CaCl2, MgCl2, MnCl2, and ZnCl2: 0.25mM each one. Incubation was carried out at room temperature for 16h, with gentle agitation. After that, it was left to stand for 1h and the soluble protein refolding level was monitored by dot blotting. Soluble protein was quantified by Bradford.
Assessment of PA refolding and antibody recognitionAntibody recognition of PA was assayed by Western or dot blots using nitrocellulose membranes (Pall Biodyne). For dot blots, 2μl of the protein solutions were directly spotted onto the membranes. Membranes were blocked with 5% nonfat milk in TS buffer (50mM Tris–HCl pH 7.5, 150mM NaCl) and incubated for 45min with 1:200 dilution of a mix of goat anti-C-terminal and anti-internal PA region polyclonal antibodies, PA (bc-19) and PA (bE-16) respectively (Santa Cruz Biotechnology, Inc.). Afterwards, membranes were incubated with a 1:2000 dilution of donkey anti-goat IgG horseradish peroxidase conjugate (Santa Cruz Biotechnology, Inc.).
Quantification and computational analysis of dot blotsDot blots were used to assess multiple refolding conditions at the same time. To avoid uncertainties due to the irregular dispersion of each droplet onto the nitrocellulose membrane, a method to quantify dot blot results was used. This method was based on an image processing technique that extracted, from an image of the multiwell plate, a matrix of numerical coefficients that was used to sort reagent refolding capabilities. An index standing for the image intensity level of each dot and its respective area was defined. This index, henceforth called coefficient D, was automatically computed using the tools available in Matlab (Mathworks, Natick, USA). First, a grayscale, high resolution digital image of the whole plate layout was recorded. Then, a contour detection algorithm automatically recognized the edge of each individual dot, distinguishing it from the plate background, and computed the dot area (A) defined by the pixels inside the previously found edge. For each separate well, a relative density value (Δ density) was computed by subtracting the mean density value of the dot from the mean density of the image background. Finally, D was computed for each dot by multiplying its relative density by the respective area (D=Δ density×A). Coefficient D was used as an index of antibody recognition, reflecting proper refolding of PA.
In order to evaluate the refolding capability of the different buffers and additives studied, statistical methods were used to evaluate results variability. An exploratory data Analysis of Variance (Kruskal–Wallis non-parametric one-way ANOVA, Matlab Statistical Toolbox) was first performed to identify those factors leading to higher coefficient D values. As in the multiwell plate assay, different factors were simultaneously considered, two-way ANOVA was used to search for possible interactions between them. In both analyses, results were considered statistically significant if the significance level (p) was less than 0.05.
Results and discussionExpression and purification of recombinant PAThe N-terminal His-tagged fusion PA (84.98kDa) constructed in this work has 756 aminoacids, no cysteines and a theoretical pI of 5.97. Expression of high levels of this recombinant protein (200μg per ml of bacterial culture) was achieved in an expression medium that does not require induction. When the crude extract was analyzed by SDS-PAGE, a dominant protein band of the expected size was observed (Fig. 1a, lanes 1 and 2). Analysis of the soluble and insoluble fractions demonstrated that PA appeared exclusively in the insoluble fraction (Fig. 1a, lanes 3 and 4), and that most of the contaminant proteins remained in the supernatant as soluble proteins during cellular lysis (Fig. 1a, lanes 5 and 6). The T7 lysozyme produced by the host strain, combined with a special reagent that causes the gentle disruption of the cell wall, facilitated bacterial lysis permitting a rapid and easy recovery of inclusion bodies, which after several washes formed a distinct white pellet. Analysis of the guanidine solubilized pellet by SDS-PAGE (Fig. 1b) revealed a remarkable high purity, considering that no purification steps other than simple washes were performed. Anti-C-terminus or anti-internal PA region polyclonal antibodies did not recognize the recombinant protein in Western blots (data not shown), indicating that PA did not retain the capability to be recognized by specific antibodies in this stage.
 SDS-PAGE of recombinant PA (indicated by the arrow) expressed in E. coli BL21 Star (DE3) pLysS carrying plasmid pEXP17-pagA. Lanes 1 and 2: total protein, lanes 3 and 4: insoluble fraction, lanes 5 and 6: soluble fraction. Results are shown for two different clones, corresponding to odd and even lanes respectively. (b) SDS-PAGE of washed inclusion bodies solubilized in 6M guanidine.")
(a) SDS-PAGE of recombinant PA (indicated by the arrow) expressed in E. coli BL21 Star (DE3) pLysS carrying plasmid pEXP17-pagA. Lanes 1 and 2: total protein, lanes 3 and 4: insoluble fraction, lanes 5 and 6: soluble fraction. Results are shown for two different clones, corresponding to odd and even lanes respectively. (b) SDS-PAGE of washed inclusion bodies solubilized in 6M guanidine.
Previous studies reporting the production of recombinant PA in E. coli involved multiple purification steps. In some studies in which PA was obtained as inclusion bodies, it was subjected to several purification steps including metal chelate affinity chromatography18, or ammonium sulfate precipitations followed by hydrophobic-interaction chromatography22. Other researchers obtained PA in the periplasm, and used several different chromatographic steps to partially purify PA, such as ion exchange and hydrophobic interaction chromatography1, or ion exchange and hydroxyapatite chromatography20. The high expression of PA obtained in the present work, combined with the low background and the enrichment of PA in the lysis step, facilitated PA purification using only washes, without the need for chromatographic purification steps.
Assessment of PA renaturing conditionsAs PA was obtained in inclusion bodies, we assumed that its lack of antibody recognition was due to improper folding. Multiple renaturing conditions were subsequently tested for guanidine solubilized inclusion bodies using a refolding system that provides nearly a hundred unique buffers, allowing a high-throughput refolding screening. This system consists of a 96-well plate, each containing a different refolding solution. The renaturing conditions are generated through different buffers with the addition of diverse concentrations and combinations of the following components: NaCl and KCl, to supply different ionic forces; TCEP and/or reduced-oxidized glutathione as redox agents; l-arginine, PEG, non-detergent sulfobetaines NDSB-201 and NDSB-256, EDTA, trehalose, sorbitol, β-cyclodextrin and several cations as renaturing additives. We expected that dilution of PA in some of the multiple refolding solutions would lead to the correct refolding, restoring its ability to be recognized by antibodies.
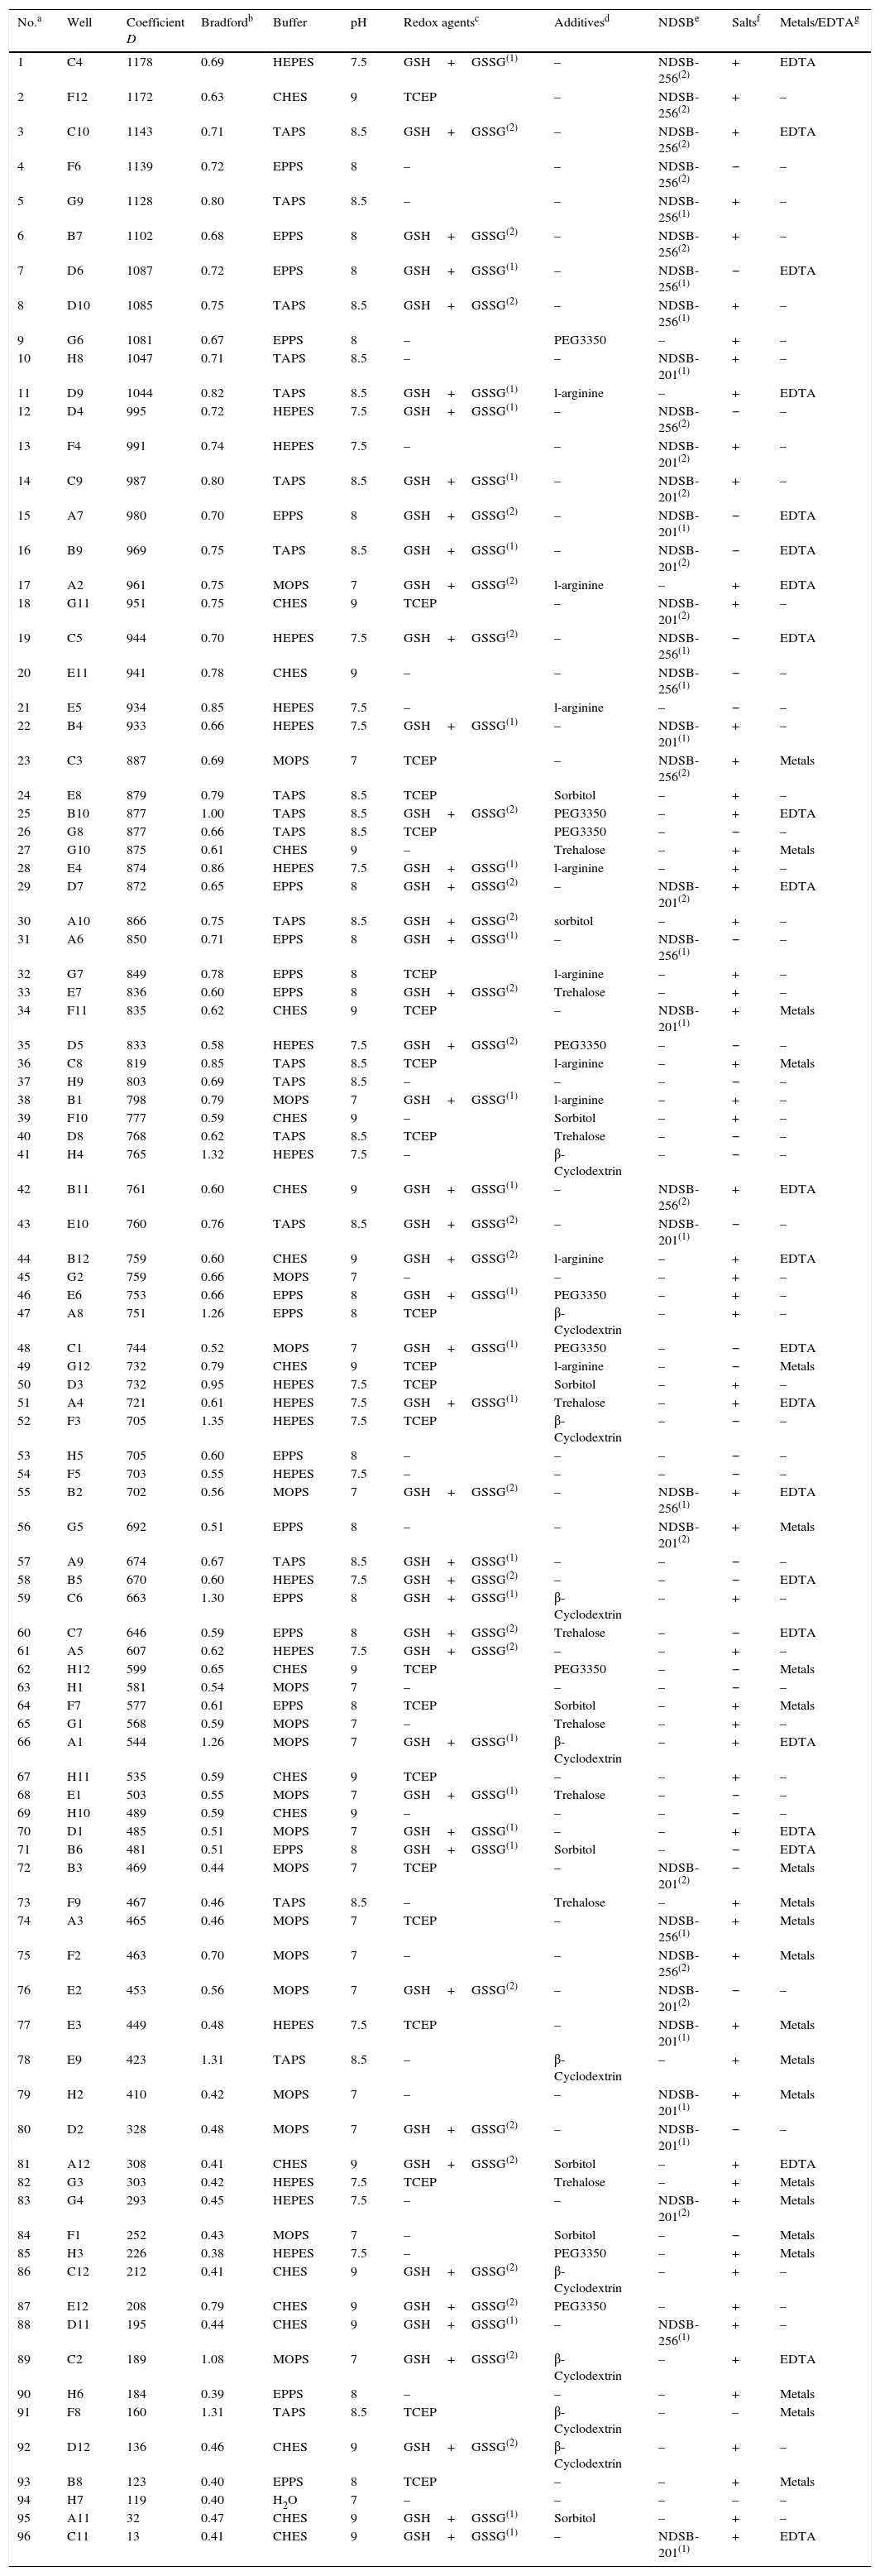
As the properly refolded PA should remain in the soluble state, renaturing was monitored both by assaying the concentration (Bradford) and antibody binding (dot blots) of the protein that stayed soluble in each well (Table 1 and Fig. 2). The data presented in this work result from a single replicate testing 96 different buffers and additives conveniently contained in a single refolding plate. Protein quantification was useful to estimate soluble protein in most conditions assayed, however, some buffer components interfered with the Bradford method. For example, nearly all of the wells containing β-cyclodextrin gave an intense light-blue color, greatly increasing absorbance.
Assessment of all refolding conditions
| No.a | Well | Coefficient D | Bradfordb | Buffer | pH | Redox agentsc | Additivesd | NDSBe | Saltsf | Metals/EDTAg |
|---|---|---|---|---|---|---|---|---|---|---|
| 1 | C4 | 1178 | 0.69 | HEPES | 7.5 | GSH+GSSG(1) | – | NDSB-256(2) | + | EDTA |
| 2 | F12 | 1172 | 0.63 | CHES | 9 | TCEP | – | NDSB-256(2) | + | – |
| 3 | C10 | 1143 | 0.71 | TAPS | 8.5 | GSH+GSSG(2) | – | NDSB-256(2) | + | EDTA |
| 4 | F6 | 1139 | 0.72 | EPPS | 8 | – | – | NDSB-256(2) | − | – |
| 5 | G9 | 1128 | 0.80 | TAPS | 8.5 | – | – | NDSB-256(1) | + | – |
| 6 | B7 | 1102 | 0.68 | EPPS | 8 | GSH+GSSG(2) | – | NDSB-256(2) | + | – |
| 7 | D6 | 1087 | 0.72 | EPPS | 8 | GSH+GSSG(1) | – | NDSB-256(1) | − | EDTA |
| 8 | D10 | 1085 | 0.75 | TAPS | 8.5 | GSH+GSSG(2) | – | NDSB-256(1) | + | – |
| 9 | G6 | 1081 | 0.67 | EPPS | 8 | – | PEG3350 | – | + | – |
| 10 | H8 | 1047 | 0.71 | TAPS | 8.5 | – | – | NDSB-201(1) | + | – |
| 11 | D9 | 1044 | 0.82 | TAPS | 8.5 | GSH+GSSG(1) | l-arginine | – | + | EDTA |
| 12 | D4 | 995 | 0.72 | HEPES | 7.5 | GSH+GSSG(1) | – | NDSB-256(2) | − | – |
| 13 | F4 | 991 | 0.74 | HEPES | 7.5 | – | – | NDSB-201(2) | + | – |
| 14 | C9 | 987 | 0.80 | TAPS | 8.5 | GSH+GSSG(1) | – | NDSB-201(2) | + | – |
| 15 | A7 | 980 | 0.70 | EPPS | 8 | GSH+GSSG(2) | – | NDSB-201(1) | − | EDTA |
| 16 | B9 | 969 | 0.75 | TAPS | 8.5 | GSH+GSSG(1) | – | NDSB-201(2) | − | EDTA |
| 17 | A2 | 961 | 0.75 | MOPS | 7 | GSH+GSSG(2) | l-arginine | – | + | EDTA |
| 18 | G11 | 951 | 0.75 | CHES | 9 | TCEP | – | NDSB-201(2) | + | – |
| 19 | C5 | 944 | 0.70 | HEPES | 7.5 | GSH+GSSG(2) | – | NDSB-256(1) | − | EDTA |
| 20 | E11 | 941 | 0.78 | CHES | 9 | – | – | NDSB-256(1) | − | – |
| 21 | E5 | 934 | 0.85 | HEPES | 7.5 | – | l-arginine | – | − | – |
| 22 | B4 | 933 | 0.66 | HEPES | 7.5 | GSH+GSSG(1) | – | NDSB-201(1) | + | – |
| 23 | C3 | 887 | 0.69 | MOPS | 7 | TCEP | – | NDSB-256(2) | + | Metals |
| 24 | E8 | 879 | 0.79 | TAPS | 8.5 | TCEP | Sorbitol | – | + | – |
| 25 | B10 | 877 | 1.00 | TAPS | 8.5 | GSH+GSSG(2) | PEG3350 | – | + | EDTA |
| 26 | G8 | 877 | 0.66 | TAPS | 8.5 | TCEP | PEG3350 | – | − | – |
| 27 | G10 | 875 | 0.61 | CHES | 9 | – | Trehalose | – | + | Metals |
| 28 | E4 | 874 | 0.86 | HEPES | 7.5 | GSH+GSSG(1) | l-arginine | – | + | – |
| 29 | D7 | 872 | 0.65 | EPPS | 8 | GSH+GSSG(2) | – | NDSB-201(2) | + | EDTA |
| 30 | A10 | 866 | 0.75 | TAPS | 8.5 | GSH+GSSG(2) | sorbitol | – | + | – |
| 31 | A6 | 850 | 0.71 | EPPS | 8 | GSH+GSSG(1) | – | NDSB-256(1) | − | – |
| 32 | G7 | 849 | 0.78 | EPPS | 8 | TCEP | l-arginine | – | + | – |
| 33 | E7 | 836 | 0.60 | EPPS | 8 | GSH+GSSG(2) | Trehalose | – | + | – |
| 34 | F11 | 835 | 0.62 | CHES | 9 | TCEP | – | NDSB-201(1) | + | Metals |
| 35 | D5 | 833 | 0.58 | HEPES | 7.5 | GSH+GSSG(2) | PEG3350 | – | − | – |
| 36 | C8 | 819 | 0.85 | TAPS | 8.5 | TCEP | l-arginine | – | + | Metals |
| 37 | H9 | 803 | 0.69 | TAPS | 8.5 | – | – | – | − | – |
| 38 | B1 | 798 | 0.79 | MOPS | 7 | GSH+GSSG(1) | l-arginine | – | + | – |
| 39 | F10 | 777 | 0.59 | CHES | 9 | – | Sorbitol | – | + | – |
| 40 | D8 | 768 | 0.62 | TAPS | 8.5 | TCEP | Trehalose | – | − | – |
| 41 | H4 | 765 | 1.32 | HEPES | 7.5 | – | β-Cyclodextrin | – | − | – |
| 42 | B11 | 761 | 0.60 | CHES | 9 | GSH+GSSG(1) | – | NDSB-256(2) | + | EDTA |
| 43 | E10 | 760 | 0.76 | TAPS | 8.5 | GSH+GSSG(2) | – | NDSB-201(1) | − | – |
| 44 | B12 | 759 | 0.60 | CHES | 9 | GSH+GSSG(2) | l-arginine | – | + | EDTA |
| 45 | G2 | 759 | 0.66 | MOPS | 7 | – | – | – | + | – |
| 46 | E6 | 753 | 0.66 | EPPS | 8 | GSH+GSSG(1) | PEG3350 | – | + | – |
| 47 | A8 | 751 | 1.26 | EPPS | 8 | TCEP | β-Cyclodextrin | – | + | – |
| 48 | C1 | 744 | 0.52 | MOPS | 7 | GSH+GSSG(1) | PEG3350 | – | − | EDTA |
| 49 | G12 | 732 | 0.79 | CHES | 9 | TCEP | l-arginine | – | − | Metals |
| 50 | D3 | 732 | 0.95 | HEPES | 7.5 | TCEP | Sorbitol | – | + | – |
| 51 | A4 | 721 | 0.61 | HEPES | 7.5 | GSH+GSSG(1) | Trehalose | – | + | EDTA |
| 52 | F3 | 705 | 1.35 | HEPES | 7.5 | TCEP | β-Cyclodextrin | – | − | – |
| 53 | H5 | 705 | 0.60 | EPPS | 8 | – | – | – | − | – |
| 54 | F5 | 703 | 0.55 | HEPES | 7.5 | – | – | – | − | – |
| 55 | B2 | 702 | 0.56 | MOPS | 7 | GSH+GSSG(2) | – | NDSB-256(1) | + | EDTA |
| 56 | G5 | 692 | 0.51 | EPPS | 8 | – | – | NDSB-201(2) | + | Metals |
| 57 | A9 | 674 | 0.67 | TAPS | 8.5 | GSH+GSSG(1) | – | – | − | – |
| 58 | B5 | 670 | 0.60 | HEPES | 7.5 | GSH+GSSG(2) | – | – | − | EDTA |
| 59 | C6 | 663 | 1.30 | EPPS | 8 | GSH+GSSG(1) | β-Cyclodextrin | – | + | – |
| 60 | C7 | 646 | 0.59 | EPPS | 8 | GSH+GSSG(2) | Trehalose | – | − | EDTA |
| 61 | A5 | 607 | 0.62 | HEPES | 7.5 | GSH+GSSG(2) | – | – | + | – |
| 62 | H12 | 599 | 0.65 | CHES | 9 | TCEP | PEG3350 | – | − | Metals |
| 63 | H1 | 581 | 0.54 | MOPS | 7 | – | – | – | − | – |
| 64 | F7 | 577 | 0.61 | EPPS | 8 | TCEP | Sorbitol | – | + | Metals |
| 65 | G1 | 568 | 0.59 | MOPS | 7 | – | Trehalose | – | + | – |
| 66 | A1 | 544 | 1.26 | MOPS | 7 | GSH+GSSG(1) | β-Cyclodextrin | – | + | EDTA |
| 67 | H11 | 535 | 0.59 | CHES | 9 | TCEP | – | – | + | – |
| 68 | E1 | 503 | 0.55 | MOPS | 7 | GSH+GSSG(1) | Trehalose | – | − | – |
| 69 | H10 | 489 | 0.59 | CHES | 9 | – | – | – | − | – |
| 70 | D1 | 485 | 0.51 | MOPS | 7 | GSH+GSSG(1) | – | – | + | EDTA |
| 71 | B6 | 481 | 0.51 | EPPS | 8 | GSH+GSSG(1) | Sorbitol | – | − | EDTA |
| 72 | B3 | 469 | 0.44 | MOPS | 7 | TCEP | – | NDSB-201(2) | − | Metals |
| 73 | F9 | 467 | 0.46 | TAPS | 8.5 | – | Trehalose | – | + | Metals |
| 74 | A3 | 465 | 0.46 | MOPS | 7 | TCEP | – | NDSB-256(1) | + | Metals |
| 75 | F2 | 463 | 0.70 | MOPS | 7 | – | – | NDSB-256(2) | + | Metals |
| 76 | E2 | 453 | 0.56 | MOPS | 7 | GSH+GSSG(2) | – | NDSB-201(2) | − | – |
| 77 | E3 | 449 | 0.48 | HEPES | 7.5 | TCEP | – | NDSB-201(1) | + | Metals |
| 78 | E9 | 423 | 1.31 | TAPS | 8.5 | – | β-Cyclodextrin | – | + | Metals |
| 79 | H2 | 410 | 0.42 | MOPS | 7 | – | – | NDSB-201(1) | + | Metals |
| 80 | D2 | 328 | 0.48 | MOPS | 7 | GSH+GSSG(2) | – | NDSB-201(1) | − | – |
| 81 | A12 | 308 | 0.41 | CHES | 9 | GSH+GSSG(2) | Sorbitol | – | + | EDTA |
| 82 | G3 | 303 | 0.42 | HEPES | 7.5 | TCEP | Trehalose | – | + | Metals |
| 83 | G4 | 293 | 0.45 | HEPES | 7.5 | – | – | NDSB-201(2) | + | Metals |
| 84 | F1 | 252 | 0.43 | MOPS | 7 | – | Sorbitol | – | − | Metals |
| 85 | H3 | 226 | 0.38 | HEPES | 7.5 | – | PEG3350 | – | + | Metals |
| 86 | C12 | 212 | 0.41 | CHES | 9 | GSH+GSSG(2) | β-Cyclodextrin | – | + | – |
| 87 | E12 | 208 | 0.79 | CHES | 9 | GSH+GSSG(2) | PEG3350 | – | + | – |
| 88 | D11 | 195 | 0.44 | CHES | 9 | GSH+GSSG(1) | – | NDSB-256(1) | + | – |
| 89 | C2 | 189 | 1.08 | MOPS | 7 | GSH+GSSG(2) | β-Cyclodextrin | – | + | EDTA |
| 90 | H6 | 184 | 0.39 | EPPS | 8 | – | – | – | + | Metals |
| 91 | F8 | 160 | 1.31 | TAPS | 8.5 | TCEP | β-Cyclodextrin | – | – | Metals |
| 92 | D12 | 136 | 0.46 | CHES | 9 | GSH+GSSG(2) | β-Cyclodextrin | – | + | – |
| 93 | B8 | 123 | 0.40 | EPPS | 8 | TCEP | – | – | + | Metals |
| 94 | H7 | 119 | 0.40 | H2O | 7 | – | – | – | – | – |
| 95 | A11 | 32 | 0.47 | CHES | 9 | GSH+GSSG(1) | Sorbitol | – | + | – |
| 96 | C11 | 13 | 0.41 | CHES | 9 | GSH+GSSG(1) | – | NDSB-201(1) | + | EDTA |
 Soluble protein concentration Bradford assay. (b) Soluble PA dot blot assay. The buffer and additives corresponding to each well in the 96-well plate are shown in Table 1.")
High-throughput screening for PA refolding conditions. (a) Soluble protein concentration Bradford assay. (b) Soluble PA dot blot assay. The buffer and additives corresponding to each well in the 96-well plate are shown in Table 1.
The antibody recognition levels of soluble protein were analyzed with a high-throughput dot blot screening (Fig. 2b). A simple visual analysis revealed dots with different intensities; however, in order to achieve an accurate quantification, a computer program was used to analyze the density of the dots using a digitized image of the membrane containing the 96 spots. In addition, this program allowed us to perform a detailed analysis of the effect of the different renaturing conditions on PA antibody binding.
Table 1 and Fig. 3 show coefficient D values for each dot in decreasing order. Coefficient D values for the best refolding conditions were ten times higher than the value corresponding to the control (water, D=119), allowing good discrimination between the different conditions analyzed. When coefficient D values were compared with soluble protein concentrations determined by Bradford, a good correlation was observed (Table 1 and Fig. 4), except for nearly all (8/10) the wells containing β-cyclodextrin due to the intense blue color developed that gave high absorbance readings, as previously mentioned. When these eight wells were excluded, the highest coefficient D corresponded to samples with high soluble protein concentrations. The two exceptions to beta-cyclodextrin interference were C12 and D12, in which the refolding buffer was CHES pH 9.0.

Composite image of the dots, showing Coefficient D values above each dot while the number at the bottom indicates the order by decreasing coefficient D values. Letters and numbers on the top and left margins indicate original dot location, corresponding to the multiwell plate and the dot blot assay shown in Fig. 2.
 and soluble protein concentration (determined by Bradford), for all conditions tested. Values lacking correlation, all of them corresponding to wells containing β-cyclodextrin (8/10), are circled.")
Considering a coefficient D cut-off of 900 to define the strongest signals, no obvious combination of buffers and refolding additives stands out as the best (Table 1). The two highest D values were obtained in wells containing HEPES pH 7.5 and CHES pH 9.0 buffers; however, the remaining conditions in the wells above the 900 cut-off value included either TAPS pH 8.5 or EPPS pH 8.0, and only one contained MOPS pH 7.0. When the coefficient D of all conditions was plotted against the different buffers, a great dispersion was observed for all of them (Fig. 5), although buffer TAPS pH 8.5 had the best overall performance, with 80% of the wells that contained it (15/19) showing high antibody recognition (coefficient D>760).
, nearly 120. Different concentrations of the following additives were plotted together: NDSB-256, NDSB-201, salts, and glutathione (reduced and oxidized).")
Coefficient D values corresponding to each refolding additive and buffer system. The cut-off value of 900 is shown with a dashed line, as well as the value for the control well (containing water), nearly 120. Different concentrations of the following additives were plotted together: NDSB-256, NDSB-201, salts, and glutathione (reduced and oxidized).
When the coefficient D corresponding to the wells containing each of the different additives were compared, the only one that appeared to yield consistently good results was l-arginine, as all (9/9) wells containing this additive had values above 700, three of which were higher than 900 (Fig. 5). Moreover, in one of the wells with the highest coefficient D, l-arginine was the only component present apart from the buffer. Arginine is known to improve protein solubility and inhibit aggregation (it is a moderate chaotrope), although the molecular mechanisms behind this effect are still unclear39. The high signals obtained with l-arginine agree with previously reported results5,39,40 indicating that it regularly allows efficient renaturation, making l-arginine an additive of choice for routine antigenic recombinant protein refolding protocols.
All wells (10/10) containing β-cyclodextrin had low coefficient D values, with no wells above 765 (Fig. 5). This result indicated that β-cyclodextrin was not efficient to increase PA antibody recognition, although it has been reported to be effective in the refolding of some proteins under other conditions2,24,41. Cyclodextrins are known to inhibit protein aggregation during the refolding process, as they can bind to hydrophobic protein surfaces increasing folding yields39. As our refolding efficiency evaluation was based on the capability of PA to be recognized by antibodies, we cannot rule out that β-cyclodextrin affects antibody binding in a way not related to protein folding, such as hindering the accessibility of the antibodies to PA epitopes. Although a great dispersion was observed for the rest of the additives, almost all wells (82%) with coefficient D above 900 contained non-detergent sulfobetaines (Table 1). Two different variants, NDSB-256 and NDSB-201, were analyzed at two different concentrations. One-way analysis of variance indicated that NDSB-256 has a statistically significant (p=0.0016) beneficial effect on PA refolding only when used at 1M. No significant correlations were observed for NDSB-201, although previous reports have indicated that 1M NDSB-201 reduced the aggregation of unfolded or partially unfolded proteins8,11.
Wells containing sorbitol, trehalose or metals also showed great dispersion, but none had coefficient D values over 900. A similar trend was observed for PEG3350, with only one well above the cut-off value. Polyethylene glycol (PEG), sorbitol and trehalose have been proposed to act as stabilizers of protein structures39.
No statistically significant effects were observed for the addition of the commonly used reduced/oxidized glutathione redox agent13,33 and wells containing this additive could be observed along the whole range, including the highest and lowest coefficient D values (Fig. 5). This is probably due to the lack of cysteines in PA, which could be involved in the formation of disulfide bridges in the protein. Wells containing TCEP or EDTA did not reveal an effect of these compounds on PA refolding.
Possible interactions between the different buffers and components were assessed using a two-way analysis of variance. Glutathione was observed to interact with CHES pH 9.0 buffer (p=0.001), reducing its effect. On the other hand, although in the presence of glutathione the wells containing EPPS, HEPES and TAPS buffers had slightly higher D values, these differences were not statistically significant. When the interaction between the buffers and metals was analyzed, metals were observed to reduce the effects of EPPS and HEPES. No significant interactions were observed between buffers and l-arginine, NDSB or other components such as TCEP, sorbitol, trehalose, PEG3350, EDTA, salts and β-cyclodextrin.
Previous studies that focused on the high-throughput identification of optimal conditions for protein renaturation have identified different sets of conditions for different proteins, improving yields of biologically active proteins9,36–38. The determination of correct folding in these studies is generally based on in vitro assays of biological activity. A very important property for many biotechnologically relevant proteins used in a variety of applications, including healthcare and diagnostics, is their ability to be recognized by specific antibodies. This property is essential for bacterial antigens used in vaccines and/or pathogen detection, such as PA. The results obtained in the present work with this protein demonstrated that the different combinations of buffers and additives used for refolding can significantly affect its ability to interact with antibodies, and identified the conditions that resulted in a tenfold increase of its antibody binding properties with a high degree of discrimination. The statistical analysis of the interactions between different components allowed to determine the contribution of each of them on PA refolding and the identification of both cooperative and negative interactions. The high-throughput approach described in this study can be potentially useful for the rapid screening of adequate refolding conditions for other overexpressed antigens.
Ethical disclosuresProtection of human and animal subjectsThe authors declare that no experiments were performed on humans or animals for this study.
Confidentiality of dataThe authors declare that no patient data appear in this article.
Right to privacy and informed consentThe authors declare that no patient data appear in this article.
Conflicts of interestThe authors declare that they have no conflicts of interest.
M.J.P. is a career investigator from CONICET. This work was partially funded by Fondo Tecnológico Argentino (ANR600 NA 218/08).
