


This study aims to measure the main determinants influencing bank efficiency. We suggest that the bank efficiency ratio, obtained from the income statement, is positively related to the size of a bank in terms of total assets. However, we believe that such a relationship cannot be maintained for banks over a certain size. By the use of the regression analysis method, we analyze the link between bank efficiency and bank size, using a sample of 3952 banks in the European Union. Our results show that the efficiency ratio stops improving for banks with total assets over $25 billion. Previous literature, using different analysis techniques, does not reach an agreement on this point. Furthermore, our study identifies further variables which negatively affect the efficiency of banks, such as competition and lending diversification, or affect them positively, such as the wholesale funding ratio and income diversification. Our findings imply the need for different bank policies depending on total assets, in order to limit the size and activities of banks.
El estudio tiene como objetivo la medición de los principales factores influyentes en la eficiencia bancaria. Se sugiere que el ratio de eficiencia bancaria, obtenido de la cuenta de resultados, está positivamente relacionado con el total de activos. Sin embargo, esta relación no se mantiene para los bancos de mayor tamaño. Mediante el uso del análisis de regresión, se analiza la relación entre la dimensión de los bancos y su ratio de eficiencia, teniendo en consideración 3.952 bancos de la Unión Europea. Los resultados muestran que el ratio eficiencia deja de mejorar para bancos con un total de activos superior a 25.000 millones de dólares. La literatura previa, usando diferentes técnicas de análisis, no alcanza un consenso en este respecto. Adicionalmente, el estudio identifica otras variables que afectan negativamente a la eficiencia bancaria, tales como la competencia o la diversificación en la inversión, o positivamente como el ratio de financiación mayorista o la diversificación en ingresos. Estos hallazgos apoyan la necesidad de diferentes políticas bancarias en función del total de activos, con el propósito de limitar el tamaño o las actividades de la banca.
In recent years, Europe and the United States have furthered the trend of concentrating banks in response to the financial crisis. Dermine and Schoenmaker (2010) summarize that some of the largest bank mergers that have taken place have been a consequence of the financial crisis. For instance, Bank of America acquired Countrywide and Merrill Lynch in the U.S., while Belgium's Fortis was sold to France's BNP-Paribas and in the UK Lloyds Banking Group was created through the merger of Lloyds TSB and HBOS. In the European Union (EU), where 60% of total assets are held by only 37 entities (European Central Bank, 2011), there is a high degree of concentration in the banking market. Even so, the benefits of this trend are controversial.
We find many arguments trying to demonstrate the advantages or disadvantages of a highly concentrated banking system, which can be classified into one of the three following categories: (i) the influence of the banking concentration on financial stability, (ii) the impact of the banking consolidation process on the difficulties of companies accessing credit, and (iii) the improvement in banking-system efficiency levels.
Firstly, previous studies regarding the relation between bank concentration and risk, for instance, analyzed the link between financial crises, bank concentration and regulation of banking markets (e.g. Beck, Demirgüç-Kunt, & Levine, 2006). They argue that a less concentrated market is more sensitive to a financial crisis and state a positive relationship between the financial stability of the banking system and the concentration of its entities.
There are several arguments used to explain this relationship. On the one hand, bank concentration through larger institutions seems to favour these entities’ growth in assets and profits of, which would make them less vulnerable to possible financial crises, improve their chances of diversification and reduce managers’ needs to assume excessive risks (Hellman, Murdock, & Stiglitz, 2000).
On the other hand, an argument that traditionally justifies the positive relationship between the stability of the banking system and a high level of concentration is that, apparently, the banking supervisor's work becomes considerably easier in a more highly concentrated system. Allen and Gale (2000) argue similarly, basing their comparison on the history of bank failures between the United States (US) and more concentrated countries like Canada or the United Kingdom (UK).
In contrast, we found empirical evidence showing that large banks face higher exposure to market risks and also a greater likelihood of systemic risk contagion (De Jonghe, 2010). Vallascas and Keasey (2012) show that banks with the highest relative Gross Domestic Product (GDP) of the country where they reside have a greater propensity to fail when facing negative events in the country's economy.
Secondly, some authors found several undesirable consequences due to the reduction in market competition, such as the increasing difficulties and costs of accessing credit. Craig and Hardee (2007) suggest that small companies face greater financing difficulties in regions with more highly concentrated banking markets with just a few large entities. Cyree and Spurlin (2012) find a positive relationship between the entry of large entities into a rural market and the increase in interest and commission income of small entities that previously existed in that market, suggesting that larger entities trigger higher financing costs for borrowers. However, other authors state that, although the bank concentration reduces small business lending, such reduction is mostly offset by the reactions of other banks (Berger & Mester, 1997; Berger, Saunders, Scalise, & Udell (1998)).
Finally, a traditional argument used to justify the bank concentration process is that larger entities are supposed to demonstrate greater efficiency, which will be analyzed in the following sections.
The objective of our study is twofold. On one hand, the variables influencing the efficiency ratio of banks are examined. On the other hand, we answer the question of whether behaviour varies with respect to efficiency in response to an increase in bank size.
Although it is commonly accepted that the efficiency ratio of an entity is related to its size, as our first contribution we believe that this relationship is not positive for extremely large entities. We also assume that it is very meaningful for other magnitudes of the entity as well such as the level of competition, lending diversification or the wholesale funding ratio and income diversification. The implications of these findings support the need for limiting the size and activities of banks, not only in terms of risk but also in terms of efficiency.
It appears there is not only one single model for all banks. For instance, Fernández-Laviada, Martínez-García, and Montoya del Corte (2007) note the positive relationship between bank size and the use of derivatives. Thus, findings about the reasons behind different levels of efficiency have important implications for both managers and bank supervisors (Berger & Mester, 1997). Liquidity and solvency requirements should differ depending on the specific characteristics of each entity, such as its size, competition, business strategy or financial and investing structure. Focusing on the EU, our research is expected to shed light on bank policies in order to place more emphasis on aspects other than the concentration process.
Section 2 of our study provides a literature review about the drivers influencing bank efficiency, and supports our hypotheses. Section 3 includes the sampling upon which our study is based and specifies the methodology applied. Section 4 shows the main empirical findings on the explanatory variables of the efficiency ratio and the differences between the largest banks and the rest of entities. In the last part of our study, we provide our conclusions and implications for research and practice.
Determinants of bank efficiencyAlthough the measuring of efficiency levels may vary according to different analyses (technical efficiency, cost or profit efficiency, different financial efficiency ratios, etc.), their relevance in credit institutions has been highlighted by previous research because of its influence on other variables in the banking system. However, the results of previous analyses on bank efficiency also reflect some controversy. According to Hughes and Mester (1998), it would be necessary to link capital requirements to the efficiency ratio, and authorities must allow most efficient banks to assume a higher risk in their investments. In this regard, Berger and DeYoung (1997) show that phenomena impairing assets are preceded by reductions in the level of the bank's efficiency.
Overall, the efficiency ratio from the income statement of a credit institution aims to measure the percentage of the gross income represented by overheads. According to Andries (2011, p. 48) some of the factors which influence bank efficiency “are manageable by the bank, such as resources used, technology employed, size of assets, amount of capital invested, organizational structure, and management style, as well as exogenous factors that do not depend solely on the management of the bank, such as specific legislation, market share, and price and availability of resources”. Some of these will be considered within this study.
However, in our attempt to ascertain the factors that influence the efficiency of a credit institution, this paper uses the main variables identified by previous literature as representative of the banking industry, not only in terms of efficiency but also in terms of risk. Fiordelisi, Marqués-Ibáñez, and Molineux (2011) suggest that lower bank efficiency levels precede greater risk in the future. Vallascas and Keasey (2012) suggest that the size, the share of income derived from trading and the financial leverage of a bank have a relevant relationship with the level of risk, more than other traditional variables such as the capital regulatory ratio, the off-balance over total assets ratio or the amount of liquid assets.
In literature, there seems to be no agreement regarding the relationship between bank size and bank risk or bank efficiency. Dermine and Schoenmaker (2010) suggest that the effect of the crisis has led to the creation of financial institutions with an even greater systemic risk. However, they also suggest that concentrating the systemic risk in larger institutions is preferable to maintaining a large number of smaller institutions, because of the difficulties the latter experience in diversifying their business, especially from a geographical point of view.
When analyzing the possibility of bank size restrictions, Vallascas and Keasey (2012) state that governments should take into account the relative weight that each entity represents in the national economy. These authors suggest that larger entities could follow a higher risk investment strategy due to the implicit bailout guarantee from the government since their size implies they are “too big to fail”. According to OCDE (2011), it is “using government guarantees to avoid systemic fallout from the crisis, distorted competition between banks and further reinforced the perception that systematically important banks enjoy implicit guarantees”.
Strictly from the point of view of efficiency, there are studies that have analyzed the influence of bank mergers and acquisitions on overheads. Although it is generally considered to be a positive influence, the conclusions reached are not unanimous. Pilloff (1996) shows that there is a reduced improvement in bank efficiency following a merger. In the same vein, Berger and Humprey (1997) consider that, although there appears to be no significant cost improvement after mergers, income seems to improve due to the movement towards more profitable products.
Palomo and Sanchís (2010, p. 314) suggest that the efficiency of Spanish credit cooperatives is unrelated to their size during the 2000–2007 period, since the differences in the levels of efficiency of these entities had increased, although not in response to size increases or decreases: “a positive relationship between size and profitability and efficiency cannot be demonstrated, as higher levels of profitability and efficiency are shown by medium size entities, some profitability and efficiency ratios are even higher in smaller banks”.
Furthermore, studies based on the evolution of the share price after the announcement of mergers are pessimistic and even find a negative relationship between the stock price and the bank merger. However, Calomiris (1999) suggests that some methodological problems in these findings compromise their conclusions, some of which are: (i) price may be an inadequate measurement variable as it could anticipate the merger event; (ii) it is difficult to find comparable banks after the merger due, firstly, to the special organizational and market circumstances of each entity and, secondly, to the fact that many comparable entities may have been the result of a previous merger in recent years that is still accruing benefits from this event.
Our research suggests that there is a direct relationship between bank efficiency and the size of the bank, measured by total assets.H.1 The total volume of assets in banks is directly related to their efficiency ratio.
However, these results appear to be different when considering the size of the merged or acquired entities. Some studies suggest that the higher the merged bank, the lower the improvement in the efficiency ratio, suggesting a nonlinear relationship in the economies of scale gained in a merger. Thus, efficiency seems to grow in an entity up to a certain size, after which it stops growing, presumably because of the greater difficulties involved in managing larger institutions (Drake & Hall, 2003). Similarly, some authors suggest that smaller banks show more inefficient capital management compared to larger institutions, maybe due to less aggressive investment policies (Hughes, Mester, & Moon, 2001), or lower diversification possibilities (Berger & Mester, 1997).
Andries (2011), in line with Drake (2001), states that the increase in bank size, measured by total assets, leads to an increase in technical efficiency, but suggests that the optimal size of banks should be a topic of interest to be analyzed now more than ever, in the current context of international economic and financial crisis. However, the same study suggests that the differences in terms of efficiency when considering bank size have been decreasing during the last few years, as small banks (total assets lower than $1 billion) have experienced the highest growth in terms of efficiency with respect to medium-sized banks (total assets greater than $1 billion but less than $10 billion) and large ones (total assets greater than $10 billion).
In relation to bank size, this paper suggests a positive relationship between bank efficiency and the size of an entity, but only for small and medium-sized banks, while it is insignificant in large entities. This would be in the same line as Berger and Mester (1997), who also suggest something similar but in terms of profitability, stating an optimal bank size to be around $25 billion in assets for US banks in the 90s, a much smaller size than most of the largest institutions currently.H.2 The direct relationship between the size of an entity and its efficiency ratio is not maintained for entities with total assets higher than $25 billion.
Furthermore, there are multiple reasons to consider the influence of local economical and market circumstances on bank efficiency. Some authors state that “most differences in efficiency found across banking systems are due to country-specific aspects of banking technology” (Casu & Molyneux, 2003, p. 22). Demirgüç-Kunt and Huizinga (2011) suggest there is a country-influence, asserting that the reduction in profitability and a simultaneous increase in the risk experienced by relatively large entities (measured as the ratio of total liabilities over GDP) is less, the smaller the economy of a country is.
Existing literature identifies the level of competition as another important feature of the local market to distinguish between country banking systems. Bikker and Haaf (2002) find differences among countries when assessing that banking market share seems to be stronger in Europe than in countries like the US, Canada and Japan, finding also evidence of greater competition among large banks than medium and small ones. Poghosyan and Haan (2001) also find evidence that larger banks located in concentrated markets have experienced higher volatility during the recent financial crisis. According to the OCDE (2011), although retail banking competition is supposed to make the financial sector more efficient and benefit final consumers, the results of the empirical studies linking competition and financial stability are not conclusive depending on the country.
In the same vein, Andries (2011) determines that the level of banking concentration in the market is a factor influencing efficiency as well as other internal variables, such as the financial structure, bank size and the deposit and lending rate, which will also be considered in the present study. According to Berger and Humprey (1997), the market concentration appears to be less relevant in profitability than cost efficiency. In this respect, we consider it necessary to demonstrate the relationship between market concentration and bank efficiency.
Nevertheless, a European analysis seems to be more difficult because of the geographical diversification of banks. In this line, cross-country efficiency studies reveal greater differences. According to Amel, Barnes, Panetta, and Salleo (2004), the most efficient US and European banks show overhead costs around 10% and 25% less than the average found in commercial banks in those countries, while this difference is only around 5% and 7% in Japan. In Australia, for example, this difference reaches 58%, which suggests that cross-country comparison is very difficult because of special market features and different technology levels and legal requirements.
Casu and Molyneux (2003) explain the differences in efficiency levels among countries focusing on the European banking market, which is typically characterized by high levels of government control and restrictions leading to a reduction in competition. They suggest that there has been a slight convergence of different efficiency ratios among EU countries since the Single Market Programme agreement. Thus the differences throughout European banking markets appear to be maintained today.
In consequence, our research suggests a cross-country influence on the efficiency ratio measured through the competition level in each country, but just for those entities that are large, but not extremely so. This is because of the difficulties in analyzing this effect in the largest banks which present a higher degree of international diversification in their operations. Thus, for medium-sized and small banks, there is higher competition in the local market and lower efficiency ratios because of the decrease in banking intermediation margins.H.3 Medium-sized and small banks in countries with higher banking competition show a worse efficiency ratio.
The effects of bank diversification on bank risk and failure have also been debated in previous research. Some studies show that the banks with a higher proportion of non-intermediation income are more exposed to higher systemic risks because traditional income is supposed to suffer lower volatility (Ibragimov, Jaffee, & Walden, 2011; Vallascas & Keasey, 2012). Barth, Caprio, and Levine (2004) find a negative relationship between bank diversification restrictions imposed by the government and the result and stability of the institutions in that country.
Baele, De Jonghe, and Vennet (2007) state that more diversified institutions have systematically higher betas, and Wanger (2010) asserts that diversification makes financial crises more likely, since it increases the similarities among the banks by exposing them to the same risks. From the point of view of the efficiency ratio, these authors express doubts about whether the increased income coming from diversification offsets the costs that are necessary to implant this strategy. Therefore, this study suggests a negative relationship between the level of efficiency and the level of bank diversification.H.4 Banks with higher levels of diversification have worse efficiency ratios.
Moreover, the capital structure of entities also merits comment during the analysis of efficiency levels. On the one hand, the level of capital seems to be related to the bank's degree of risk exposure and, therefore, to the return demanded by creditors. Although several authors suggest an inverse relationship between capital requirements and bank failure, especially within economies with weaker economic growth (Furlong, 1988), it seems to be accepted that the more indebted a bank is, the more exposed it is to the risk of failure that arises in situations of systemic crisis (Acharya & Viswanathan, 2011).
Furthermore, and strictly from an accounting point of view, the capital ratio directly influences funding costs, since interest expenses (but not dividends) imply less profitability for the bank in the income statement (Berger & Mester, 1997). Likwise, Fiordelisi et al. (2011) find that higher capital levels tend to have a positive effect on efficiency levels.
The study hypothesizes that the most indebted banks are supposed to show higher financial costs and then worse efficiency ratios.H.5 The more indebted a bank is, the worse its efficiency ratio is.
The wholesale funding ratio shows a different and adjusted measurement of the level of a bank's indebtedness. Andries (2011) finds a similar but inverse ratio, the deposit rate, related to bank efficiency levels. The supposed stability of traditional deposit sources of funding and their lower costs, as well as lower reporting and covenant requirements of traditional creditors, could lead banks with lower wholesale funding ratios towards lower efficiency because of a possible relaxation in the terms of operational management policies.
In line with Watts and Zimmerman (1986) who asserted that greater earnings came to companies with higher debt ratios, the study suggests that banks which are more dependent on wholesale funding markets may show better efficiency ratios because of higher qualified lenders’ requirements, reducing agency problems (Jensen & Meckling, 1976). In the same way that managers choose accounting practices designed to reduce the possibility of violating debt contracts (Dicher & Skinner, 2002), we consider that banks with a higher wholesale funding ratio are supposed to apply more demanding policies in terms of efficiency.H.6 Banks with higher wholesale funding ratios show better efficiency ratios.
Berger and Mester (1997) state that the traditionally used methodology for bank efficiency analysis is mainly based on a two-step process: a previous measurement of the different bank efficiency levels followed by a regression analysis with certain explanatory variables (financial, market, regulatory, etc.) explaining the differences identified.
Firstly, to measure the different levels of efficiency between banks within a sample, parametric or nonparametric estimation techniques are commonly used. The nonparametric techniques more commonly employed by previous studies are called “Data Envelopment Analysis (DEA)” and “Free Disposable Hull Analysis (FDH)”. DEA is a linear programming technique combining a set of observations of best practices, to build the efficient frontier and provide a relative measure of the efficiency of a sample (Berger & Humprey, 1997). With regard to the most used parametric techniques, the “Stochastic Frontier Approach (SFA)”, the “Thick Frontier Approach (TFA)” and “Distribution-Free Approach (DFA)” should be highlighted. Nevertheless, some authors outlined the lack of consistent results in the various efficiency methods (Berger & Humprey, 1997). According to Casu, Girardone, and Molyneux (2004, p. 17), “there is a need for further empirical work in the area of productivity change using various methodological approaches; in particular, our findings suggest that research should focus on reconciling differences in productivity change decomposition derived from the estimation of best-practice functions across methodologies”.
After the identification of different efficiency levels, in second place various authors have identified influential variables through the use of regression techniques. However, according to Berger and Mester (1997), major parts of the variance of the efficiency ratio remain unexplained, which could be justified by some methodological difficulties. For instance, unexplained variance is caused by (i) countless non-identified influencing factors affected by different technology and market circumstances (Bos, Koetter, Kolari, & Kool, 2009), (ii) factors that are identified but difficult to measure (such as differences in managerial capacity), or (iii) errors detected in previous measurements while identifying the dependent variable.
The present study shows some methodological differences in comparison to previous literature, especially at the beginning, since it considers the efficiency ratio of a bank as the dependent variable of the regression model. The dependent variable is an accounting one, directly observed in the income statement.
An exploratory analysis of the selected variables is conducted through a t-test. Finally, the paper runs a deeper regression analysis to confirm the significance and meaning of the influence of the variables selected on bank efficiency, distinguishing the effects on larger and smaller entities.
The data are extracted from the financial statements provided by the Bureau Van Dijk BankScope database (BankScope) which has some advantages, such as providing a common structure for financial statements, called the “Fitch Universal Format”, which allows comparison between different jurisdictions. As drawbacks, it could be said that it does not include 100% of the population but, according to Mathieson and Roldós (2001), the coverage of the base is around 90% of total bank assets.
The study uses 3952 observations of banks available in BankScope for the fiscal year 2010, 119 of which have been deleted as they do not show a value for the dependent variable. The sample appears as a normal frequency distribution for this variable as shown in the histogram in Fig. 1, with sample descriptive statistics shown in Table 1.

Sample descriptive statistics.
| Variable | N | Minimum | Maximum | Mean |
| CTI | 3833 | .26 | 593.75 | 68.1968 |
| LnTA | 3832 | .00 | 14.80 | 7.2656 |
| COMP | 3833 | 679.27 | 14337.57 | 3762.5989 |
| OIW | 3689 | −905.00 | 1200.00 | 8.4487 |
| LOANW | 3655 | .01 | 100.00 | 42.8772 |
| CR | 3833 | −503.57 | 100.00 | 11.4290 |
| TFR | 3529 | .09 | 100.00 | 69.3989 |
| EMW | 3297 | .00 | 1790.28 | 19.8326 |
| ROAA | 3833 | −66.32 | 185.57 | .6760 |
The accounting efficiency ratio is considered to be the dependent variable of the study. However, currently there appears to be no uniformity in the accounting measurement of the bank efficiency ratio. It is generally defined by dividing the overhead expenses, which are necessary to operate, by the gross margin of the bank. Such a ratio measures the costs for each unit produced, wherefore a low ratio complies with low expenses and high efficiency.
We use the “cost to income ratio (CTI)” as defined in the BankScope user's guide: “this is one of the most focused on ratios currently and measures the overheads or costs of running the bank, the major element of which is normally salaries, as a percentage of income generated before provisions”.
Therefore, this ratio includes revenue from financial transactions, both lending and trading income, and other income from non-typical banking activities such as insurance or other financial services. In relation to the expenses considered in the numerator of the ratio, since it includes depreciation costs, it allows banks with different leasing or acquiring strategies to be compared.

“Overhead” (OH) is all staff costs and other general operating expenses including depreciation costs. In the denominator, net interest income (NI) and commissions (NC) derived from banking intermediation activities are taken into account as well as “other net income” (OI) from activities unrelated to banking intermediation.
With respect to independent variables, they have been initially selected taking into account the considerations in the previous section, as described in Table 2, grouped by category according to the hypotheses ped: dimension (H1 and H2), competition (H3), diversification (H4) and financial structure (H5 and H6). Furthermore, we include two other independent variables, EMW and ROAA, to ensure the robustness of the test. The first one is a proxy of human resources intensity which is considered a common input that measures the cost and profit efficiency of banks (e.g. Chortareas, Girardone, & Ventouri, 2012; Kosak, Zajc, & Zoric, 2009; Yildirim & Philippatos, 2007). The ROAA, as a measurement of bank profitability, is traditionally related to the cost to income ratio (Mathuva, 2009; Tripe, 1998).
Definition of independent variables.
| Category | Variable | Definition |
| Dimension | LnTA* | Log. (n) total assets: Log base n of the total assets of the entity at year end, as an indicator of the entity's size. |
| Competition | COMP | Competition: defined as, COMPi=(GDPj/NENTj)Being GDP** the Gross Domestic Product of the country where the bank resides, and NENT* the number of banks for the country j in the sample. |
| Diversification | OIW | Other income ratio: defined as, OIWi=(OIi/(NIi+NCi+OIi))*100Being NI* the interest margin, NC* the net commission income from intermediation activity, and OI* the net income from activities unrelated to banking intermediation.It shows a measurement of banking diversification. Values close to 0 indicate a bank with a higher relevance of traditional intermediation business within the income statement. |
| LOANW | Relative weight of non traditional loans over total assets: defined as, LOANWi=(1−(LOANi/TAi))*100Being LOAN* the total amount of customer loans net of provisions.It represents a relative measurement of the weight of non traditional lending activities in the whole portfolio of the entity. As in the previous variable, values close to 0 indicate a less diversified bank, since its investment portfolio is based mainly on traditional lending to customers. | |
| Financial structure | CR | Total capital ratio: defined as, CRi=(Ei/TAi)*100Being E* the equity of the bank at the end of the year.The equity on total assets of a bank ratio represents the degree of financial independence, regardless of assets risk unlike the regulatory capital ratios.Values close to 0 indicate a highly financial leveraged bank. |
| TFR | Traditional funding ratio: defined as, TFRi=(DEi+Ei/TAi)*100 | |
| Being DE* the amount of current accounts, savings accounts and term accounts in the liabilities of the entity. | ||
| Values close to 0 indicate a highly dependent bank on wholesale funding. | ||
| Human resources | EMW | Human resources strategy: defined as,EMWi=(NEi/TAi)*100Being NE* the number of employees at the end of the period.It represents a relative measurement of the intensity of human resources over the total assets managed by the entity. Values close to 0 indicate a bank with a business model less labour intensive. |
| Profitability | ROAA* | Return on average assets: after-tax profitability on average assets. |
According to the previous variables, in the second step of the statistical evaluation, this paper will run a multivariate analysis with the following model:
Results
Two complementary stages have been run to obtain the results of this study. In a first step, a mean difference test is performed as an exploratory analysis aimed to determine whether different levels of certain variables influence bank efficiency (CTI). For that purpose the above variables are categorized into two groups below or above the mean. This technique allows us to conclude whether different levels of the categorized variables imply significant differences in the efficiency ratio, and justifies the choice of the independent variables used in the regression model in the second stage.
Descriptive and univariate resultsFirstly, a preliminary t-test of equality in means is run between two groups of entities with an efficiency ratio (CTI) below -“low cost-income banks (LCB)”- and above the mean of -“high cost-income banks (HCB)”-, respectively, showing a significant difference in the central tendency of some of the independent variables selected. This suggests a relationship between the independent variables and CTI ratio, except for the case of the ratio of other income (OIW) and total capital ratio (CR) (Table 3).
“Cost to income” t-test between “low cost-income BANKS (LCB)” and “high cost-income BANKS (HCB)”.
| Category | Variable | Levene's test for equality of variances | t-Test for equality of means | ||
| F | p-Value | t | p-Value | ||
| Dimension | LnTA | 39.255 | .000 | −12.357 | .000(***) |
| Competition | COMP | 80.231 | .000 | −2.390 | .017(**) |
| Diversification | OIW | .402 | .526 | −.098 | .922 |
| LOANW | 3.790 | .052 | 2.963 | .003(***) | |
| Financial structure | CR | 4.331 | .037 | 1.409 | .159 |
| TFR | 81.361 | .000 | 6.051 | .000(***) | |
| Human resources | EMW | 29.779 | .000 | 5.814 | .000(***) |
| Profitability | ROAA | 15.050 | .000 | −3.530 | .000(***) |
Significance levels: *p<0.1, **p<0.05 and ***p<0.01.
To complete previous results, a new t-test is performed from the opposite perspective. The sample is divided into two groups for each independent variable, depending also on their mean values. By testing the equality of means for the variable CTI in each group of entities, previous findings are confirmed, suggesting also a possible relationship between capital ratio (CR) and efficiency (CTI) (Table 4).
t-Test for CTI variable between independent variable groups.
| Category | Comparison groups | CTI means | Levene's test for equality of variances | t-Test for equality of means | ||||
| Group 1 | Group 2 | Group 1 | Group 2 | F | p-Value | t | p-Value | |
| Dimension | LB | SB | 62.1561 | 68.7678 | 8.144 | .004 | −3.365 | .001(***) |
| Competition | MC | LC | 66.3797 | 68.9873 | 162.746 | .000 | −2.023 | .043(**) |
| Diversification | MID | LID | 67.8333 | 68.3222 | 16.819 | .000 | −.440 | .660 |
| MLD | LLD | 70.3415 | 66.7657 | 13.620 | .000 | 3.353 | .001(***) | |
| Financial structure | MIB | LIB | 67.3379 | 71.2386 | 228.044 | .000 | 2.239 | .025(**) |
| HWF | LWF | 66.6750 | 70.1028 | 40.864 | .000 | 3.409 | .001(***) | |
| Human resources | HHR | LHR | 75.7457 | 65.7406 | 4.281 | .039 | 8.612 | .000(***) |
| Profitability | MPB | LPB | 54.1706 | 71.6146 | 4.432 | .035 | −17.164 | .000(***) |
Significance levels: *p<0.1, **p<0.05 and ***p<0.01
LB vs. SB: distinguishing “large banks (LB)” from “small banks (SB)”, as the total assets are above or below the average total assets of the sample, respectively.
MC vs. LC: “more concentrated markets (MC)” vs. “less concentrated markets (LC)”, in terms of COMP ratio.
MID vs. LID: “more income-diversified banks (MID)” vs. “less income-diversified banks (LID)”, in terms of OIW ratio.
MLD vs. LLD: “more loan-diversified banks (MLD)” vs. “less loan-diversified banks (LLD)”, in terms of LOANW ratio.
MIB vs. LIB: “more indebted banks (MI)” vs. “less indebted banks (LI)”, in terms of CR ratio.
HWF vs. LWF: “banks with higher wholesale funding ratio (HWF)” vs. “banks with lower wholesale funding ratio (LWF)”, in terms of TFR ratio.
HHR vs. LHR: “higher human resources strategy (HHR)” vs. “lower human resources strategy (LHR)”, in terms of EIW ratio.
MPB vs. LPB: “more profitable banks (MPB)” vs. “less profitable banks (LPB)”, in terms of ROAA ratio.
Summarizing the results for each hypothesis, the t-test above confirms a direct relationship between bank size and efficiency levels as we expected in hypothesis H.1. There appear to be differences in favour of larger institutions. By splitting the sample into ten intervals by total assets, Fig. 2 confirms a positive relationship between the cost to income ratio and bank size. However, this relationship does not appear to be maintained continuously for all bank sizes, as illustrated at the right end of the curve where the largest entities are located.

The turning point on the right side of the curve suggests that the “efficiency-size” relationship does not follow a straight line as expected in hypothesis H.2. These results suggest that mergers of entities should not be justified in terms of increasing efficiency, at certain sizes.
Secondly, the results seem to confirm hypothesis H.3 as, in terms of competition, more concentrated markets show slightly worse efficiency ratios than less concentrated markets.
With respect to the business strategy, hypothesis H.4 seems to be partially confirmed, but only in terms of investment diversification. Indeed, as suggested in the previous analysis, income diversification still appears to be related to bank efficiency without statistical significance. However, there seems to be a strong and direct relationship between banking loan diversification and the efficiency ratio, since banks with an investment portfolio with higher diversification appear to be less efficient than less diversified banks.
In terms of the financial banking structure, this second test suggests the relationship between the efficiency ratio and the financial structure of an entity, as supposed in hypothesis H.5. The financial leverage of banks seems to influence their management policies, affecting efficiency levels. In the same vein, the source from which the entity borrows funds, whether traditional or non-traditional, seems to significantly influence the efficiency ratio, as expected in hypothesis H.6.
Furthermore, by reproducing the same analysis on other variables than the CTI, a banks's indebtedness level appears to significantly influence other profitability measures, such as the ROAA. Consistently, the most leveraged entities seem to have higher returns on assets than the least leveraged banks. Moreover, this difference remains significantly among those entities with the highest proportion of wholesale funding (with lower funds from equity or traditional savings products by customers).
Finally, the banks with a strategy predominantly based on human resources have a worse efficiency ratio; also, on average, the more profitable banks are clearly more efficient than banks with lower ROAA ratios.
Multivariate resultsDelving deeper into the analysis of the explanatory variables in the efficiency ratio, Table 5 shows the results of the regression analysis running the model presented in Section 3.2, suggesting that there is a significant relationship between all selected variables excepting the ones related to the financial structure of banks.
Total sample linear regressiona results.
| Model | Expected sign | Unstandardized coefficients | Standardized coefficients | t | p-Value | |
| B | Typ. | Beta | ||||
| 1 (Constant) | 71.990 | 3.450 | 20.864 | 000 | ||
| LnTA | − | −2.074 | .292 | −145 | −7.107 | .000(***) |
| COMP | + | .000 | .000 | .042 | 2.340 | .019(**) |
| OIW | + | −.098 | .015 | −114 | −6.733 | .000(***) |
| LOANW | + | .168 | .023 | .125 | 7.268 | .000(***) |
| CR | − | .031 | .033 | .017 | .952 | .341 |
| TFR | + | .038 | .024 | .030 | 1.569 | .117 |
| EMW | + | .066 | .011 | .102 | 5.763 | .000(***) |
| ROAA | − | −1.800 | .111 | −278 | −16.247 | .000(***) |
Significance levels: *p<0.1, **p<0.05 and ***p<0.01.
Firstly, the level of competition of the entities appears to significantly affect bank efficiency levels in a negative way, supporting our hypothesis H.3. That is, the banks in countries with higher numbers of entities show poorer efficiency ratios as a result of the decreased margins originated by the increase in competition.
Regarding the influence of different business models on bank efficiency, the results are inconclusive. The study suggests that institutions with higher levels of income diversification, measured as the proportion of income from traditional intermediation activities, have better efficiency ratios. However, in terms of loan diversification, the results suggest that more diversified entities with lower levels of traditional loans over total assets have worse efficiency ratios, as expected in hypothesis H.4.
Finally, it seems to be confirmed, as expected, that the weight of human resources influences the cost to income ratio, since entities whose activities are based to a great degree on human resources show worse efficiency ratios.
In terms of the financial structure of banks, the regression analysis leads to the conclusion that the total capital ratio of bank entities (CR) does not significantly influence its efficiency level. Similarly, the increases in efficiency requirements that could arise from wholesale funding markets do not appear to be a significant influence, contrary to hypotheses H.5 and H.6, respectively.
Regression analysis does confirm the significant positive relationship between bank size and the efficiency ratio, as suggested in hypothesis H.1. Thus, for entities with lower assets, an increase in their size allows them to take advantage of economies of scale.
However, the previous analysis suggested that this relationship does not remain linear and positive for all the increases in size of institutions, as represented in Fig. 2. As a consequence, it is necessary to continue testing hypothesis H.2, which stipulates that the decreasing curve of the relationship between bank size and the efficiency ratio is not maintained for the largest banks. Focusing on the right side of Fig. 2, the sample is now divided into two other subgroups: the first one classifies entities within deciles 1 to 9, for which the relationship “efficiency-size” is directly maintained, and the second group exclusively represents entities within the 10th decile. Thereafter, the previously presented linear regression model is run for both subgroups.
The results shown in Table 6 indicate that there is a positive relationship in smaller banks between size and the efficiency ratio, confirming hypothesis H.1. However, extremely large banks (the turning point of the curve is located at the 9th decile, where the maximum value in terms of total assets is close to $24.9 billion), does not seem to maintain a significant relationship between size and the efficiency ratio, as stated in Table 7 and expected in hypothesis H.2. Nevertheless, although the results are not conclusive due to the statistical significance of this relationship, they suggest that the “efficiency-size” relationship changes sign for the largest entities, which would confirm the changes in the slope of Fig. 2 from the 9th decile.
Linear regressiona results for total assets lower than $24.9 billion – Deciles 1 to 9.
| Model | Expected sign | Unstandardized coefficients | Standardized coefficients | t | p-Value | |
| B | Typ. | Beta | ||||
| 1 (Constant) | 83.932 | 3.883 | 21.616 | .000(***) | ||
| LnTA | − | −3.439 | .376 | −.181 | −9.137 | .000(***) |
| COMP | + | .000 | .000 | .040 | 2.208 | .027(**) |
| OIW | + | −.053 | .017 | −.054 | −3.068 | .002(***) |
| LOANW | + | .157 | .024 | .118 | 6.528 | .000(***) |
| CR | − | −.005 | .032 | −.003 | −.157 | .875 |
| TFR | + | .003 | .026 | .002 | .124 | .901 |
| EMW | + | .063 | .011 | .103 | 5.582 | .000(***) |
| ROAA | − | −1.739 | .109 | −.287 | −16.009 | .000(***) |
Significance levels: *p<0.1, **p<0.05 and ***p<0.01.
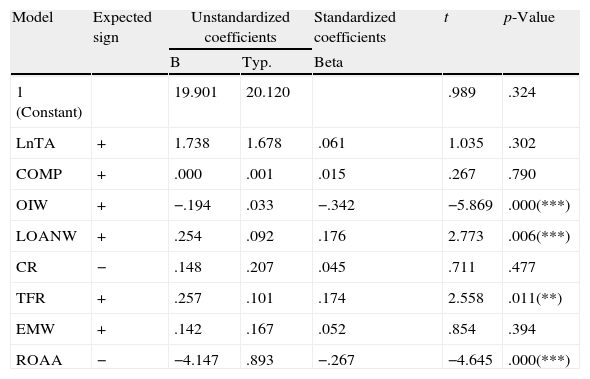
Linear regressiona results for total assets higher than $24.9 billion – 10th Decile.
| Model | Expected sign | Unstandardized coefficients | Standardized coefficients | t | p-Value | |
| B | Typ. | Beta | ||||
| 1 (Constant) | 19.901 | 20.120 | .989 | .324 | ||
| LnTA | + | 1.738 | 1.678 | .061 | 1.035 | .302 |
| COMP | + | .000 | .001 | .015 | .267 | .790 |
| OIW | + | −.194 | .033 | −.342 | −5.869 | .000(***) |
| LOANW | + | .254 | .092 | .176 | 2.773 | .006(***) |
| CR | − | .148 | .207 | .045 | .711 | .477 |
| TFR | + | .257 | .101 | .174 | 2.558 | .011(**) |
| EMW | + | .142 | .167 | .052 | .854 | .394 |
| ROAA | − | −4.147 | .893 | −.267 | −4.645 | .000(***) |
Significance levels: *p<0.1, **p<0.05 and ***p<0.01.
Overall, the results indicate that the model proposed is more explanatory for small and medium sized entities, revealing several significant differences with larger entities. Firstly, by decomposing the analysis according to the size of the entities, the funding structure becomes a highly explanatory factor for the efficiency of banks. Although this analysis still does not show any influence of the total capital ratio (CR) (measured as equity over total assets) on bank efficiency, not following our hypothesis H.5, the weight of wholesale funding over the efficiency ratio (TFR) explains efficiency significantly for the group comprised of the largest banks.
Increases in TFR ratio represent deterioration in the efficiency ratio of the entities, confirming hypothesis H.6 for banks with total assets over $25 billion, since banks with higher levels of nontraditional funding show the best efficiency ratios. The TRF ratio does not show enough significance for smaller institutions (which are those with limited access to wholesale markets). This suggests that further efforts could still be required of banks in order to improve their efficiency ratios.
In terms of the influence of the business model on efficiency levels, some relevant conclusions can be drawn. Firstly, the influence of a diversification strategy seems to be significant as expected in hypothesis H.4, although only when measuring diversification through the level of non-traditional bank investments. Certainly, other high income seems to always lead to better efficiency ratios, contrary to what might be expected, since the linear regression confirms a strong positive relationship between the other income ratio (OIW) and the level of efficiency, showing that banks with a higher proportion of other income show a better efficiency ratio.
Nevertheless, the regression results affirm that the level of investment diversification, measured as a non-traditional lending ratio over total assets, are significantly related to bank efficiency in a negative way, since banks with higher levels of diversification show lower efficiency ratios. In this respect, the study suggests that banks, especially those with total assets below $25 billion, are more efficient when focusing on traditional lending business based on giving loans to customers, as expected in hypothesis H.3.
As a test of the robustness of the study, the whole linear regression analysis states a strong direct relationship between the profitability of a bank, measured through the ROAA ratio, and its efficiency ratio. So it could be said that the efficiency ratio is also a good indicator of the profitability of banks. In the same vein, human resources does not appear to have any influence on the efficiency ratio of larger institutions. In other words, the efficiency of institutions depends on its strategy in terms of human resources, although it only shows statistical significance for smaller entities. In this case, strategies based on a large number of employees adversely affect bank efficiency ratios, but only for smaller entities. Larger institutions seem to be able to pursue a successful, less labour-intensive strategy.
Conclusions and future researchThe objective of our study was to find out whether bank efficiency is related to some internal bank variables. Agreeing with Berger and Humprey (1997), regression studies can only explain a small portion of the total variation of bank efficiency. Assuming the difficulties of a whole explanatory model, the study sheds light on the previous controversy about how some relevant variables influence the efficiency ratio of banks.
Existing research usually makes a two-step analysis whose first stage consists of evaluating the efficiency of best practices through parametric or non-parametric techniques. Other than previous studies, we base our study directly on the efficiency ratio from income statements.
The study mainly contributes by identifying three relevant aspects related to the determinants of bank efficiency in terms of bank size, diversification and funding structure. These findings lead to certain conclusions on both regulatory and managerial policies of banks.
Firstly, we found that the efficiency ratio generally has a positive relationship with the size of the entity. However, this relation does not seem to hold true for excessively large entities, suggesting an optimally efficient size at $25 billion of total assets. Under this size, the behaviour of banks in terms of efficiency greatly depends on different factors.
Among these factors we find that, although the levels of banking competition have a negative relationship with the bank efficiency level, this can only be demonstrated for medium-sized and small banks due to the geographical diversification of the largest entities. In consequence, less concentrated banking systems like those in Austria or Germany with a higher number of entities, are less favourable for bank efficiency.
Secondly, our results further indicate that income diversification is one of the strongest explanatory variables in the efficiency ratio; the higher the amount of other income, the better the efficiency. However, our study strongly asserts that diversification negatively affects bank efficiency, taking into consideration the loan diversification ratio. Banks show a worse efficiency ratio as the proportion of non-traditional loans increases. This is in line with previous literature, stating that the investing diversification of banks does not balance the required increase in costs.
Thirdly, regarding the financial structure, no link between higher capital requirements for banks and their efficiency levels can be found. However, we observe a positive effect of the source of funds on the efficiency ratio, as the largest banks with a higher wholesale funding ratio show better efficiency ratios. Apparently there is a clear influence of a more demanding strategy, in terms of efficiency, due to the higher requirements of professional suppliers of funds.
To overcome some of the difficulties identified, as an extension to this work we propose exploring further variables such as the country's influence on its efficiency ratios. Several studies on banking failure prediction have attempted to highlight the effects of the country's economic environment, both the overall economy and financial markets, on the bank failure phenomenon (Wai, 2010). Therefore, we assume that the operating policies of a bank and its efficiency levels vary depending on the conditions of the country or market in which it operates. According to Berger and Humprey (1997, p. 50) “an area of research also deserving additional attention concerns efficiency comparisons among countries”.
In this vein, the obligations of reporting and supervising the banking sector are supposed to be greater than in other economical sectors, and represent entry-barriers for small-sized financial entities. Still, such obligations differ from one country to another, even within the European Union. Previous studies show that the country's regulatory level has a direct influence on the level of efficiency of the banking sector (Barth et al., 2004). A cross-national comparison would be needed in order to find different levels of efficiency within different countries. Efficiency could be determined more precisely by carrying out separate analyses for each country measuring the impact of bank size and leading to detailed implications for each specific economy.
According to the European Commission, “the financial crisis has highlighted the danger of divergent national laws”. The EU advocates a single regulatory body regarding capital requirements directly applicable without the need for implementation in each country, thereby eliminating a source of divergence. The findings of this study support that such a single regulatory body should take into account the differences between banks, taking into consideration especially the size of an entity to ensure efficiency.
On the one hand, apart from any other consideration, local banking systems with a lower number of entities show better efficiency ratios. Nevertheless, bank efficiency worsens among the largest entities due to the current bank concentration process, which has been intensified in the EU due to the international financial crisis. Policies which focus on establishing limits to bank size should be taken into account.
On the other hand, more research into bank diversification is needed to support mandatory limitations of banking activities in the EU. This has been studied in terms of risk but not of efficiency. This study asserts that banks with total assets below $25 billion should use caution when diversifying their investment as they appear not to be able to balance the costs of diversification.