

The selection and definition of quality indicators is essential for proper control of processes. This is not always easy, particularly with extra-analytical indicators, due to the complexity and degree of comparison of processes between laboratories, and the fact that data collection is not always automated. For this reason, the indicators and specifications need to be dynamic and re-designed in accordance with changes in the system. The aim of this paper is to describe the methodology used in the selection and definition of quality indicators, and their specifications for extra-analytical processes in public laboratories in Catalonia.
Material and methodsDuring the study period (2004–2013), the members of the working group reported the mean annual value for each indicator, and the overall yearly mean of all participants was calculated. These results were compared and analyzed during periodic meetings, with regards to the pre-established specifications of the different laboratories.
ResultsQuality indicators and their specifications are presented. The evaluation of the validity of each quality indicator was made taking into account aspects including usefulness of the indicator in process monitoring, a clear definition, and a precise and reliable quantification. This methodology has made it possible to contrast the validity of the indicators or to reconsider the specification.
ConclusionsThe last 10 years’ experience of the Catalonian Health Institute Working Group on Quality Indicators in designing indicators and establishing quality specifications has proved very useful for improving the monitoring of processes in clinical laboratories included in the group.
La selección y definición de los indicadores de la calidad es imprescindible para controlar adecuadamente un proceso. Ello no siempre es fácil, sobre todo en el caso de los indicadores extraanalíticos, dada la complejidad y grado de comparabilidad de los procesos entre laboratorios y la necesaria recogida de datos que en muchas ocasiones no está automatizada. Asimismo, los indicadores y especificaciones deben ser dinámicos y rediseñarse en función de los cambios del sistema. El objetivo de este trabajo es describir la metodología utilizada en la selección y definición de indicadores de calidad y especificaciones para los procesos extraanalíticos en los laboratorios públicos de Cataluña.
Material y métodosDurante el período de estudio (2004-2013), los miembros del grupo han informado del valor medio anual para cada indicador, y se ha calculado la media anual de todos los participantes para cada uno de ellos. Estos resultados se han comparado y analizado a través de reuniones periódicas, con respecto a las especificaciones preestablecidas de los diferentes laboratorios.
ResultadosSe presentan los indicadores de calidad y sus especificaciones. La evaluación de la validez de cada indicador de calidad se llevó a cabo teniendo en cuenta los aspectos incluyendo la utilidad del indicador en la supervisión de procesos, una definición clara y una cuantificación precisa y fiable. Esta metodología ha permitido contrastar la validez de los indicadores o reconsiderar la especificación.
ConclusionesLos últimos 10 años de experiencia del Grupo de Trabajo del Instituto Catalán de la Salud de Indicadores de Calidad en el diseño de indicadores y en establecer especificaciones de calidad ha demostrado ser muy útil para mejorar el seguimiento de los procesos en los laboratorios clínicos integrados en el grupo.
Quality indicators are a key element to evaluate and monitor any Quality management system and should be designed in order to detect at an early stage, variances in systems and implement correction measures and/or prevent errors which could have an impact on patient safety.1 To carry through the support activities for the diagnostic and follow up the different health conditions, laboratories should establish quality specifications in all processes that take place both inside and outside the lab, from the moment a doctor asks for a blood test until the results of such are received.
The Catalonian Health Institute Working Group on Quality was created in 2004, composed of the responsible for quality in public laboratories in Catalonia, of the Institut Català de la Salut (ICS) which caters for a population of seven million people. The main purpose of the Group was to select and define the most appropriate Quality Indicators to monitor laboratory processes and to fix their quality specifications or acceptability limit, in the interests of patient safety.
The aim of this paper is to describe the methodology used in the selection and definition of quality indicators and their specifications for extra-analytical processes in public laboratories in Catalonia. We also present their modification taken from the evaluation of the corresponding data from 2004 to 2013.
Subject and methodThe composition of the working group has varied over time due to the reorganization of the laboratories within the Catalan public health system (ICS). Finally, the study group was made up of 12 laboratories, 4 of which worked in the area of primary health care, 2 in hospital care and the other 6 in both primary and hospital care areas. All of them have a management System of Quality control available according to the ISO 9001 norm, except one, which conforms to the 15189 norm.
Comparison of the different types of processes was a previous step to the study of indicators, agreeing on classify them in key, strategy and support processes.
In the first stage,2,3 indicators for the different processes were set out, the frequency of measurement, the calculation formula and their data source and preliminary specification.
To classify the indicators the guidelines of the Investigation and Health Quality Agency and the Clinical and Standards Institute (CLSI) were followed, which evaluated the incidence of the laboratory errors in different aspects of Quality management, including Patient safety.4,5
In general, frequency was defined as monthly for the indicators of key extra-analytical processes and annually for indicators of strategic and support processes. Following the guidelines of the consensus meeting in Stockholm,6 a desired specification was the average of results from all the laboratories (state of the art), with some exceptions as in the case of sentinel indicators, important for patient safety, for those which require zero error.
During the study period (2004–2013), and taking into account only programmed analysis (not urgent), the different laboratory members of the group have reported, in the shared “Excel” template, the laboratory average annual value for each indicator, and calculating the yearly average of all the participants.
These results have been compared and analyzed by means of periodic meetings, regarding the pre-established specifications of the different laboratories. This has made possible to contrast the validity of the indicators, to take corrective measures in light of unsuitable values or to reconsider the specification. Finally, the values attained to transform the indicators of key processes to the Six-sigma scale to establish the grade of control of the corresponding processes.7,8 In general, the processes with sigma values of ≥4 and with a minimum acceptable value of 39,10 were considered well controlled, except for the sentinel indicators (errors in the identification of a patient), in which a sigma value >6 is considered acceptable.
This study reflects the evolution of quality indicators and their quality specifications over a period of 10 years’ experience (2004–2013), in a context of significant organizational changes.
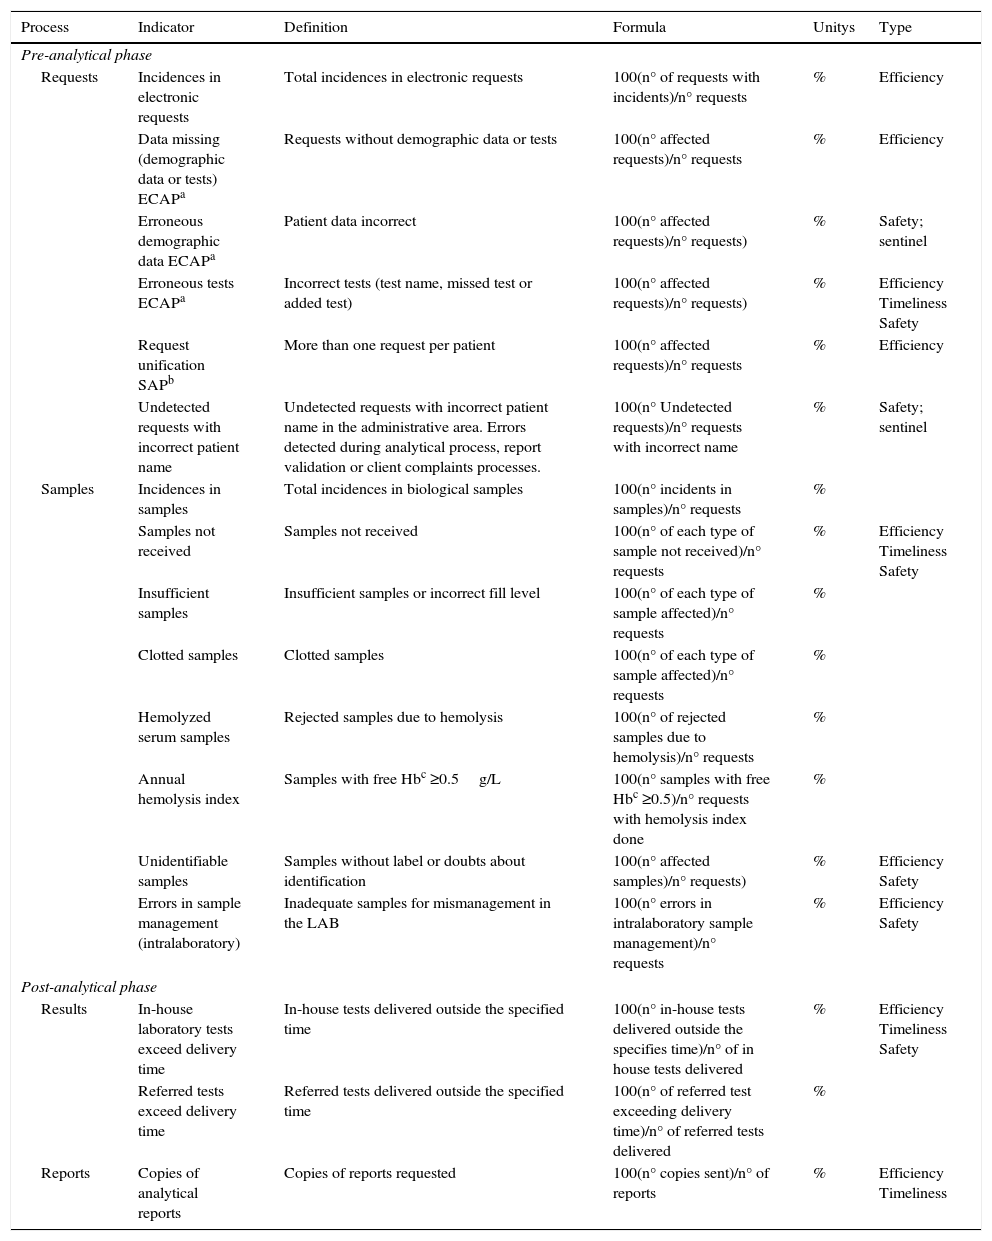
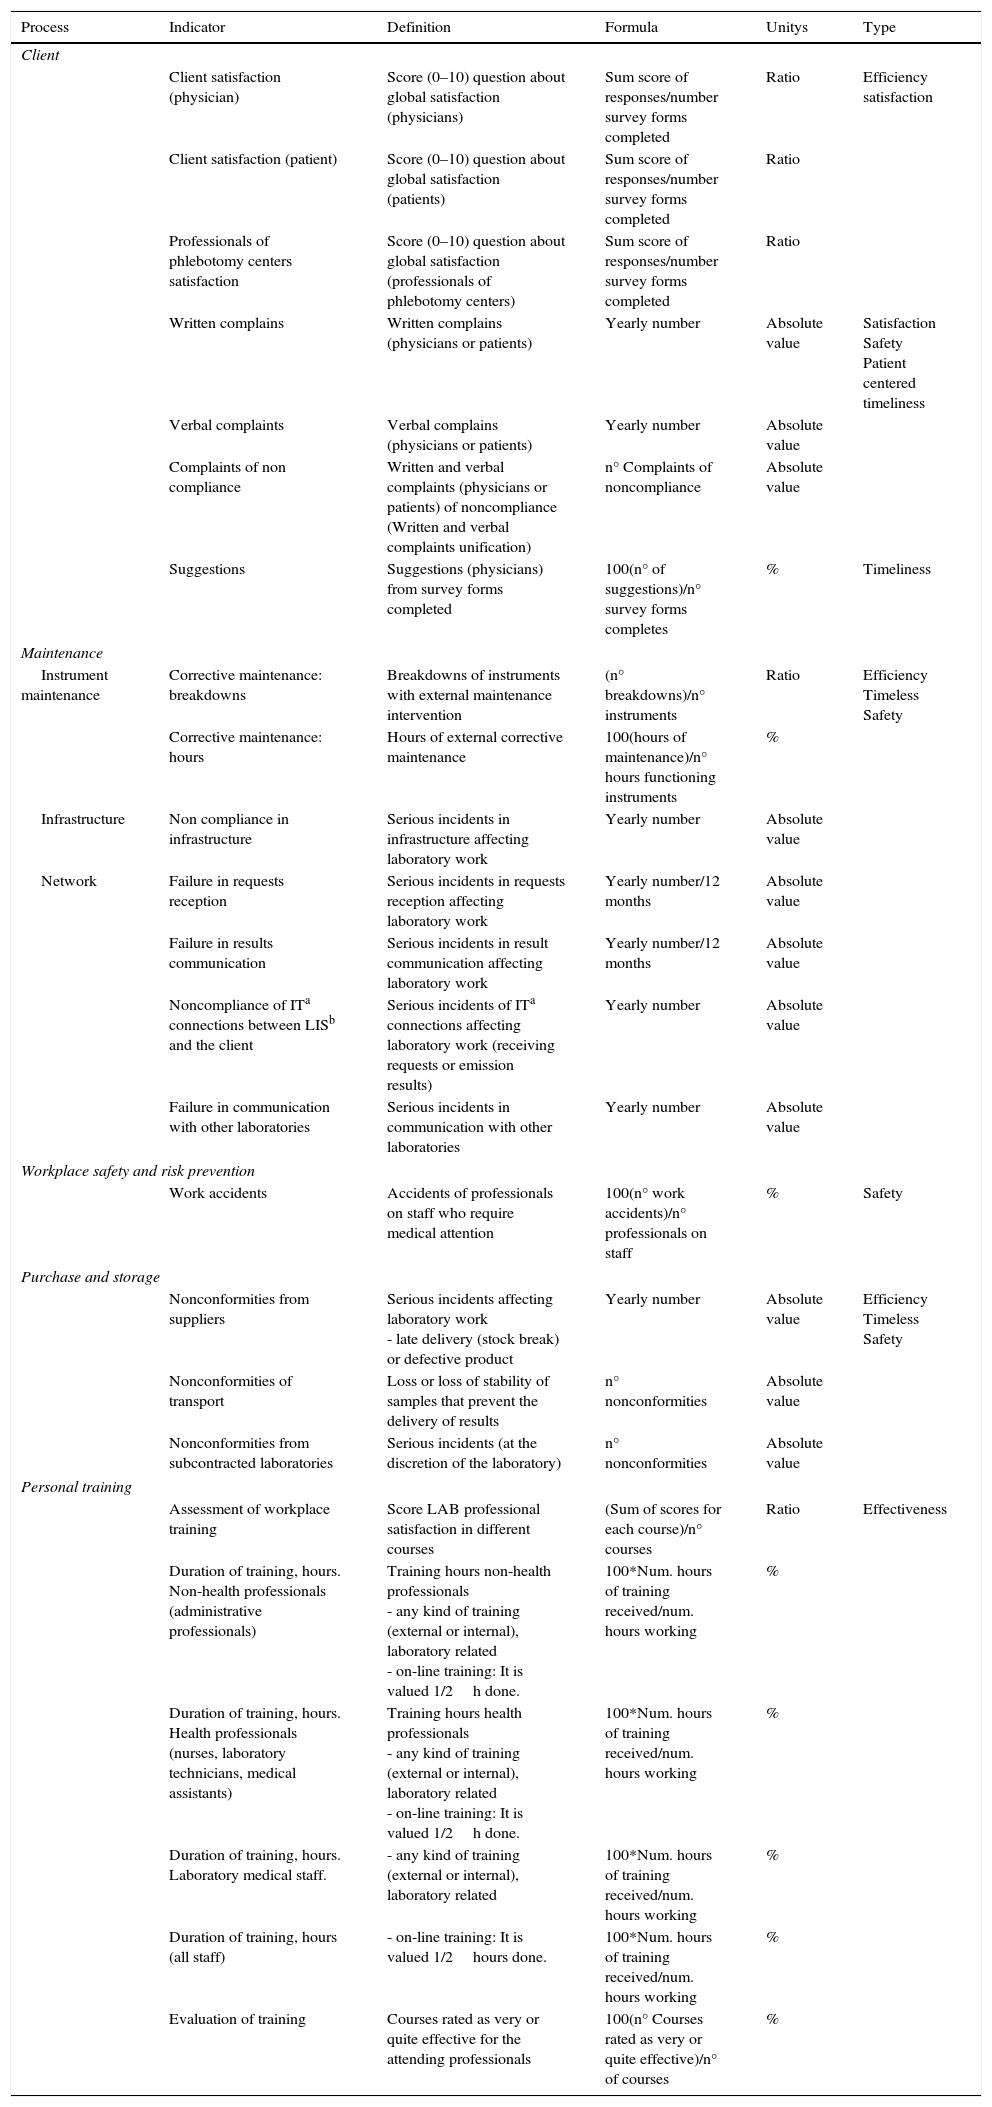
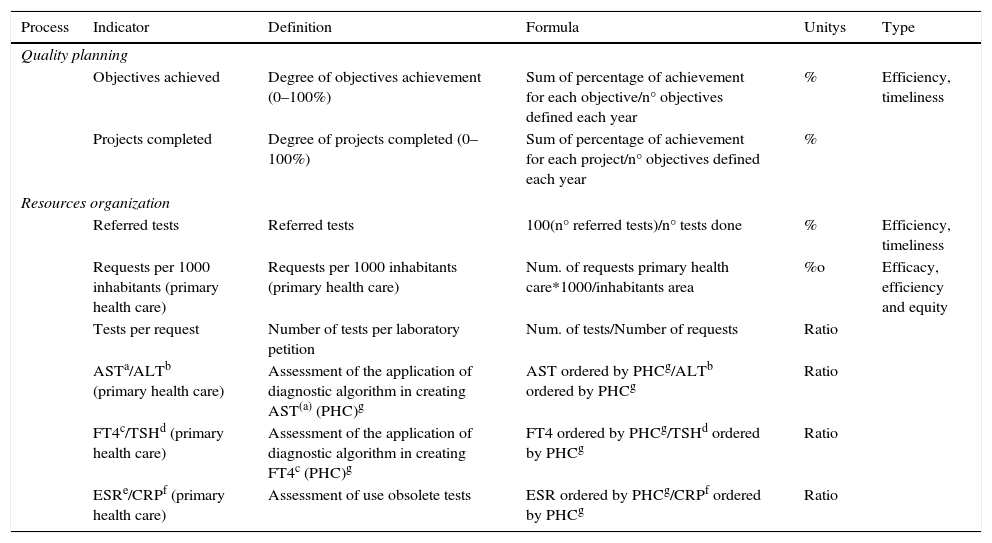
ResultsThe definition of the indicators used, including name, description, calculation formula, units and typing are shown in Table 1 (indicators of extra-analytical key processes), Table 2 (indicators of support processes) and Table 3 (indicators of strategic processes). Table 4 shows the modification of the indicator during this period and the specification assigned, and its evolution over time (indicators of extra-analytical key processes), as well as Table 5 (indicators of support processes) and Table 6 (indicators of strategic processes). These tables also show the inclusion or elimination of some indicators.
Quality indicators of extra-analytical key processes.
| Process | Indicator | Definition | Formula | Unitys | Type |
|---|---|---|---|---|---|
| Pre-analytical phase | |||||
| Requests | Incidences in electronic requests | Total incidences in electronic requests | 100(n° of requests with incidents)/n° requests | % | Efficiency |
| Data missing (demographic data or tests) ECAPa | Requests without demographic data or tests | 100(n° affected requests)/n° requests | % | Efficiency | |
| Erroneous demographic data ECAPa | Patient data incorrect | 100(n° affected requests)/n° requests) | % | Safety; sentinel | |
| Erroneous tests ECAPa | Incorrect tests (test name, missed test or added test) | 100(n° affected requests)/n° requests) | % | Efficiency Timeliness Safety | |
| Request unification SAPb | More than one request per patient | 100(n° affected requests)/n° requests | % | Efficiency | |
| Undetected requests with incorrect patient name | Undetected requests with incorrect patient name in the administrative area. Errors detected during analytical process, report validation or client complaints processes. | 100(n° Undetected requests)/n° requests with incorrect name | % | Safety; sentinel | |
| Samples | Incidences in samples | Total incidences in biological samples | 100(n° incidents in samples)/n° requests | % | |
| Samples not received | Samples not received | 100(n° of each type of sample not received)/n° requests | % | Efficiency Timeliness Safety | |
| Insufficient samples | Insufficient samples or incorrect fill level | 100(n° of each type of sample affected)/n° requests | % | ||
| Clotted samples | Clotted samples | 100(n° of each type of sample affected)/n° requests | % | ||
| Hemolyzed serum samples | Rejected samples due to hemolysis | 100(n° of rejected samples due to hemolysis)/n° requests | % | ||
| Annual hemolysis index | Samples with free Hbc ≥0.5g/L | 100(n° samples with free Hbc ≥0.5)/n° requests with hemolysis index done | % | ||
| Unidentifiable samples | Samples without label or doubts about identification | 100(n° affected samples)/n° requests) | % | Efficiency Safety | |
| Errors in sample management (intralaboratory) | Inadequate samples for mismanagement in the LAB | 100(n° errors in intralaboratory sample management)/n° requests | % | Efficiency Safety | |
| Post-analytical phase | |||||
| Results | In-house laboratory tests exceed delivery time | In-house tests delivered outside the specified time | 100(n° in-house tests delivered outside the specifies time)/n° of in house tests delivered | % | Efficiency Timeliness Safety |
| Referred tests exceed delivery time | Referred tests delivered outside the specified time | 100(n° of referred test exceeding delivery time)/n° of referred tests delivered | % | ||
| Reports | Copies of analytical reports | Copies of reports requested | 100(n° copies sent)/n° of reports | % | Efficiency Timeliness |
Quality indicators of support processes.
| Process | Indicator | Definition | Formula | Unitys | Type |
|---|---|---|---|---|---|
| Client | |||||
| Client satisfaction (physician) | Score (0–10) question about global satisfaction (physicians) | Sum score of responses/number survey forms completed | Ratio | Efficiency satisfaction | |
| Client satisfaction (patient) | Score (0–10) question about global satisfaction (patients) | Sum score of responses/number survey forms completed | Ratio | ||
| Professionals of phlebotomy centers satisfaction | Score (0–10) question about global satisfaction (professionals of phlebotomy centers) | Sum score of responses/number survey forms completed | Ratio | ||
| Written complains | Written complains (physicians or patients) | Yearly number | Absolute value | Satisfaction Safety Patient centered timeliness | |
| Verbal complaints | Verbal complains (physicians or patients) | Yearly number | Absolute value | ||
| Complaints of non compliance | Written and verbal complaints (physicians or patients) of noncompliance (Written and verbal complaints unification) | n° Complaints of noncompliance | Absolute value | ||
| Suggestions | Suggestions (physicians) from survey forms completed | 100(n° of suggestions)/n° survey forms completes | % | Timeliness | |
| Maintenance | |||||
| Instrument maintenance | Corrective maintenance: breakdowns | Breakdowns of instruments with external maintenance intervention | (n° breakdowns)/n° instruments | Ratio | Efficiency Timeless Safety |
| Corrective maintenance: hours | Hours of external corrective maintenance | 100(hours of maintenance)/n° hours functioning instruments | % | ||
| Infrastructure | Non compliance in infrastructure | Serious incidents in infrastructure affecting laboratory work | Yearly number | Absolute value | |
| Network | Failure in requests reception | Serious incidents in requests reception affecting laboratory work | Yearly number/12 months | Absolute value | |
| Failure in results communication | Serious incidents in result communication affecting laboratory work | Yearly number/12 months | Absolute value | ||
| Noncompliance of ITa connections between LISb and the client | Serious incidents of ITa connections affecting laboratory work (receiving requests or emission results) | Yearly number | Absolute value | ||
| Failure in communication with other laboratories | Serious incidents in communication with other laboratories | Yearly number | Absolute value | ||
| Workplace safety and risk prevention | |||||
| Work accidents | Accidents of professionals on staff who require medical attention | 100(n° work accidents)/n° professionals on staff | % | Safety | |
| Purchase and storage | |||||
| Nonconformities from suppliers | Serious incidents affecting laboratory work - late delivery (stock break) or defective product | Yearly number | Absolute value | Efficiency Timeless Safety | |
| Nonconformities of transport | Loss or loss of stability of samples that prevent the delivery of results | n° nonconformities | Absolute value | ||
| Nonconformities from subcontracted laboratories | Serious incidents (at the discretion of the laboratory) | n° nonconformities | Absolute value | ||
| Personal training | |||||
| Assessment of workplace training | Score LAB professional satisfaction in different courses | (Sum of scores for each course)/n° courses | Ratio | Effectiveness | |
| Duration of training, hours. Non-health professionals (administrative professionals) | Training hours non-health professionals - any kind of training (external or internal), laboratory related - on-line training: It is valued 1/2h done. | 100*Num. hours of training received/num. hours working | % | ||
| Duration of training, hours. Health professionals (nurses, laboratory technicians, medical assistants) | Training hours health professionals - any kind of training (external or internal), laboratory related - on-line training: It is valued 1/2h done. | 100*Num. hours of training received/num. hours working | % | ||
| Duration of training, hours. Laboratory medical staff. | - any kind of training (external or internal), laboratory related | 100*Num. hours of training received/num. hours working | % | ||
| Duration of training, hours (all staff) | - on-line training: It is valued 1/2hours done. | 100*Num. hours of training received/num. hours working | % | ||
| Evaluation of training | Courses rated as very or quite effective for the attending professionals | 100(n° Courses rated as very or quite effective)/n° of courses | % | ||
Quality indicators of strategic processes.
| Process | Indicator | Definition | Formula | Unitys | Type |
|---|---|---|---|---|---|
| Quality planning | |||||
| Objectives achieved | Degree of objectives achievement (0–100%) | Sum of percentage of achievement for each objective/n° objectives defined each year | % | Efficiency, timeliness | |
| Projects completed | Degree of projects completed (0–100%) | Sum of percentage of achievement for each project/n° objectives defined each year | % | ||
| Resources organization | |||||
| Referred tests | Referred tests | 100(n° referred tests)/n° tests done | % | Efficiency, timeliness | |
| Requests per 1000 inhabitants (primary health care) | Requests per 1000 inhabitants (primary health care) | Num. of requests primary health care*1000/inhabitants area | %o | Efficacy, efficiency and equity | |
| Tests per request | Number of tests per laboratory petition | Num. of tests/Number of requests | Ratio | ||
| ASTa/ALTb (primary health care) | Assessment of the application of diagnostic algorithm in creating AST(a) (PHC)g | AST ordered by PHCg/ALTb ordered by PHCg | Ratio | ||
| FT4c/TSHd (primary health care) | Assessment of the application of diagnostic algorithm in creating FT4c (PHC)g | FT4 ordered by PHCg/TSHd ordered by PHCg | Ratio | ||
| ESRe/CRPf (primary health care) | Assessment of use obsolete tests | ESR ordered by PHCg/CRPf ordered by PHCg | Ratio | ||
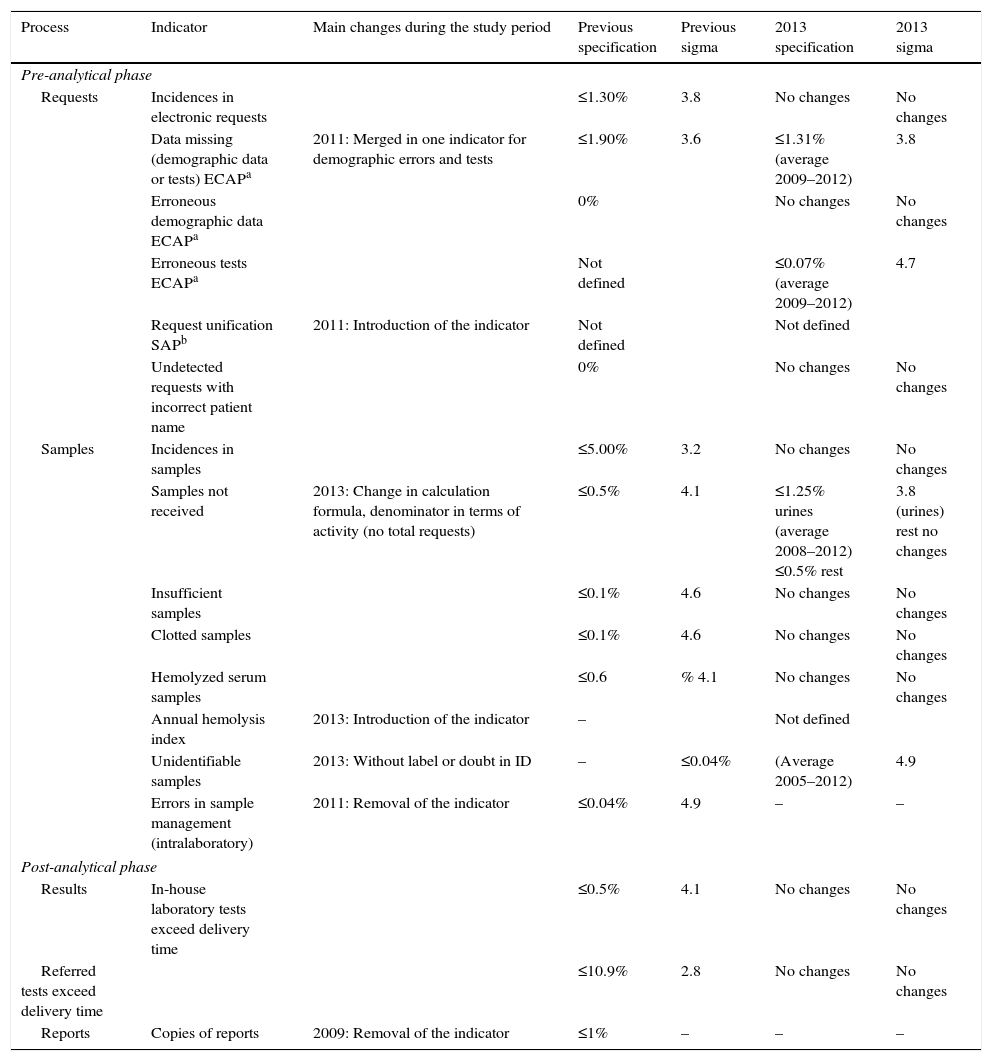
Quality indicators of extra-analytical key processes: specification assigned and its evolution over time.
| Process | Indicator | Main changes during the study period | Previous specification | Previous sigma | 2013 specification | 2013 sigma |
|---|---|---|---|---|---|---|
| Pre-analytical phase | ||||||
| Requests | Incidences in electronic requests | ≤1.30% | 3.8 | No changes | No changes | |
| Data missing (demographic data or tests) ECAPa | 2011: Merged in one indicator for demographic errors and tests | ≤1.90% | 3.6 | ≤1.31% (average 2009–2012) | 3.8 | |
| Erroneous demographic data ECAPa | 0% | No changes | No changes | |||
| Erroneous tests ECAPa | Not defined | ≤0.07% (average 2009–2012) | 4.7 | |||
| Request unification SAPb | 2011: Introduction of the indicator | Not defined | Not defined | |||
| Undetected requests with incorrect patient name | 0% | No changes | No changes | |||
| Samples | Incidences in samples | ≤5.00% | 3.2 | No changes | No changes | |
| Samples not received | 2013: Change in calculation formula, denominator in terms of activity (no total requests) | ≤0.5% | 4.1 | ≤1.25% urines (average 2008–2012) ≤0.5% rest | 3.8 (urines) rest no changes | |
| Insufficient samples | ≤0.1% | 4.6 | No changes | No changes | ||
| Clotted samples | ≤0.1% | 4.6 | No changes | No changes | ||
| Hemolyzed serum samples | ≤0.6 | % 4.1 | No changes | No changes | ||
| Annual hemolysis index | 2013: Introduction of the indicator | – | Not defined | |||
| Unidentifiable samples | 2013: Without label or doubt in ID | – | ≤0.04% | (Average 2005–2012) | 4.9 | |
| Errors in sample management (intralaboratory) | 2011: Removal of the indicator | ≤0.04% | 4.9 | – | – | |
| Post-analytical phase | ||||||
| Results | In-house laboratory tests exceed delivery time | ≤0.5% | 4.1 | No changes | No changes | |
| Referred tests exceed delivery time | ≤10.9% | 2.8 | No changes | No changes | ||
| Reports | Copies of reports | 2009: Removal of the indicator | ≤1% | – | – | – |
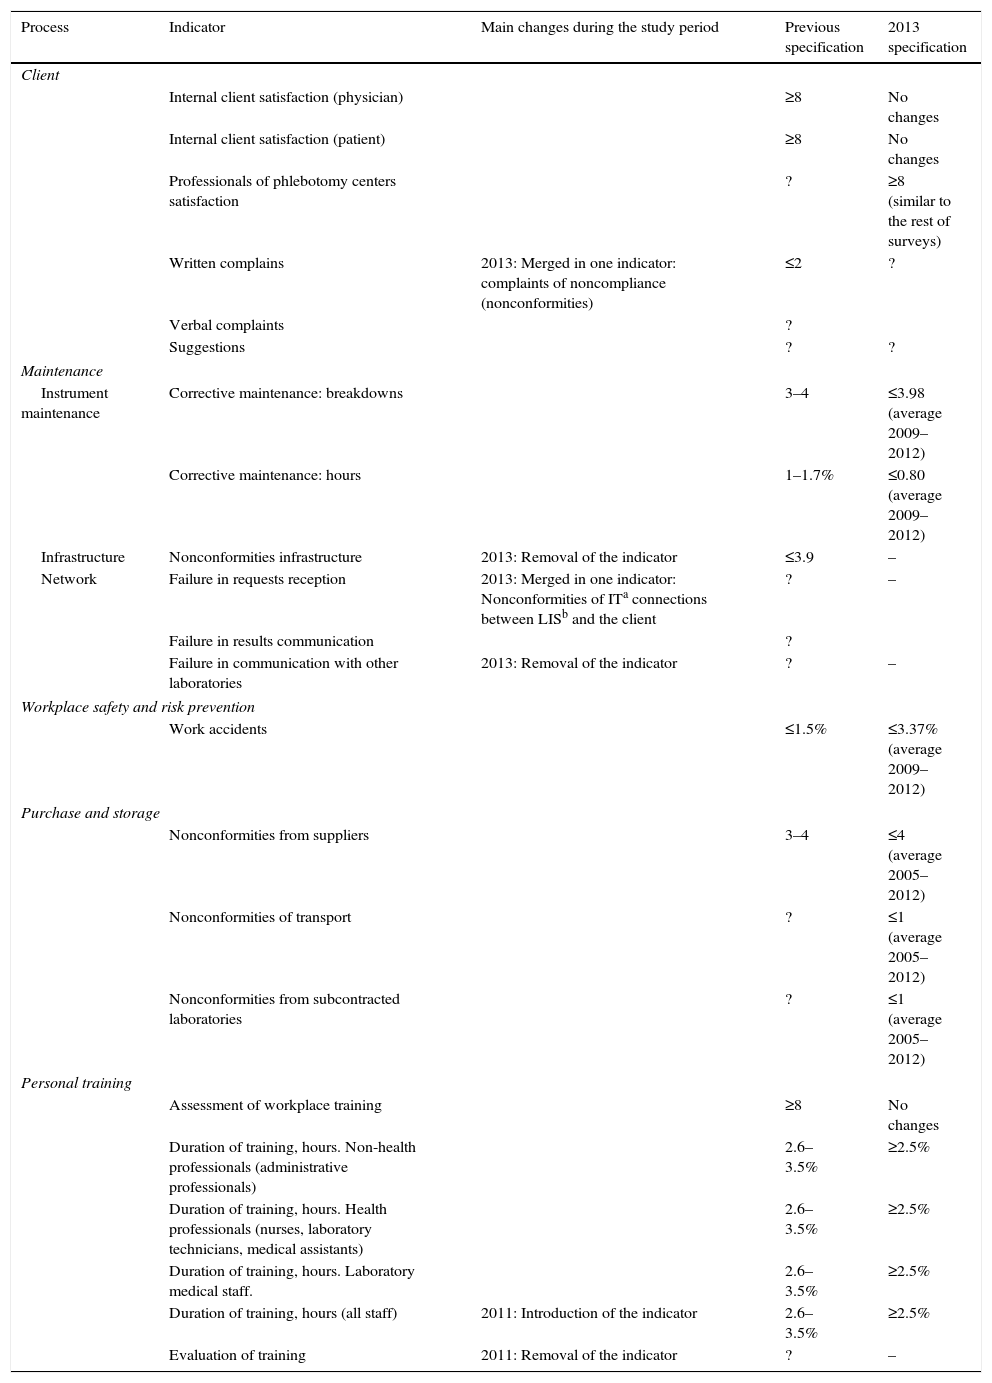
Quality indicators of support processes: specification assigned and its evolution over time.
| Process | Indicator | Main changes during the study period | Previous specification | 2013 specification |
|---|---|---|---|---|
| Client | ||||
| Internal client satisfaction (physician) | ≥8 | No changes | ||
| Internal client satisfaction (patient) | ≥8 | No changes | ||
| Professionals of phlebotomy centers satisfaction | ? | ≥8 (similar to the rest of surveys) | ||
| Written complains | 2013: Merged in one indicator: complaints of noncompliance (nonconformities) | ≤2 | ? | |
| Verbal complaints | ? | |||
| Suggestions | ? | ? | ||
| Maintenance | ||||
| Instrument maintenance | Corrective maintenance: breakdowns | 3–4 | ≤3.98 (average 2009–2012) | |
| Corrective maintenance: hours | 1–1.7% | ≤0.80 (average 2009–2012) | ||
| Infrastructure | Nonconformities infrastructure | 2013: Removal of the indicator | ≤3.9 | – |
| Network | Failure in requests reception | 2013: Merged in one indicator: Nonconformities of ITa connections between LISb and the client | ? | – |
| Failure in results communication | ? | |||
| Failure in communication with other laboratories | 2013: Removal of the indicator | ? | – | |
| Workplace safety and risk prevention | ||||
| Work accidents | ≤1.5% | ≤3.37% (average 2009–2012) | ||
| Purchase and storage | ||||
| Nonconformities from suppliers | 3–4 | ≤4 (average 2005–2012) | ||
| Nonconformities of transport | ? | ≤1 (average 2005–2012) | ||
| Nonconformities from subcontracted laboratories | ? | ≤1 (average 2005–2012) | ||
| Personal training | ||||
| Assessment of workplace training | ≥8 | No changes | ||
| Duration of training, hours. Non-health professionals (administrative professionals) | 2.6–3.5% | ≥2.5% | ||
| Duration of training, hours. Health professionals (nurses, laboratory technicians, medical assistants) | 2.6–3.5% | ≥2.5% | ||
| Duration of training, hours. Laboratory medical staff. | 2.6–3.5% | ≥2.5% | ||
| Duration of training, hours (all staff) | 2011: Introduction of the indicator | 2.6–3.5% | ≥2.5% | |
| Evaluation of training | 2011: Removal of the indicator | ? | – | |
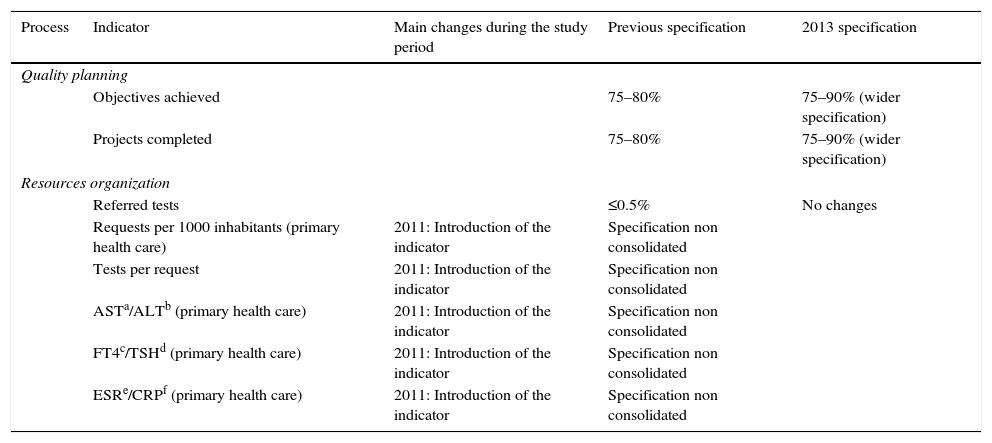
Quality indicators of strategic processes: specification assigned and its evolution over time.
| Process | Indicator | Main changes during the study period | Previous specification | 2013 specification |
|---|---|---|---|---|
| Quality planning | ||||
| Objectives achieved | 75–80% | 75–90% (wider specification) | ||
| Projects completed | 75–80% | 75–90% (wider specification) | ||
| Resources organization | ||||
| Referred tests | ≤0.5% | No changes | ||
| Requests per 1000 inhabitants (primary health care) | 2011: Introduction of the indicator | Specification non consolidated | ||
| Tests per request | 2011: Introduction of the indicator | Specification non consolidated | ||
| ASTa/ALTb (primary health care) | 2011: Introduction of the indicator | Specification non consolidated | ||
| FT4c/TSHd (primary health care) | 2011: Introduction of the indicator | Specification non consolidated | ||
| ESRe/CRPf (primary health care) | 2011: Introduction of the indicator | Specification non consolidated | ||
The suitability or validity of the indicator is fundamental to monitor the process adequately, as is the correct selection and definition of the indicator. It is a hard task, due to the magnitude of certain processes, some of which cannot be compared exactly because of the difficulty of data collection and the slightly differences in data production. For many indicators, counting is not automated and implies intervention and effort on the behalf of the professionals involved.11 The aspects taken into account when evaluating the suitability or validity of the indicators are in the same line as the conclusions drawn by the Conference of consensus organized in Padua in 2013 by the work group “Laboratory Errors and Patient Safety” of the Internal Federation of Clinical Chemistry and Laboratory Medicine (IFCC).11
The aim of our working group has been to determine the usefulness of the indicator in the monitoring of a process, its correct definition (accepting a shared understanding by the members), and a feasible and precise quantification (verifying the possibility of the addition of data by the majority of the participants with little discrepancy between laboratories). It was also important to agree on its specification, to work toward improvement but also to take into account its practicability.
The ongoing monitoring and evaluation by the group has consolidated the current indicators. The fact that the different laboratories belong to the same health system, within a common culture and regulatory field and also with quality management systems initially implanted to give response to a common ISO norm has helped to unify criteria, different to other work groups, in which the members come from different countries.12 Inevitably, differences exist but these are basically between hospital and primary care (different software, different operating systems, etc.).
The evaluation of the validity of each quality indicator was done taking into account the following aspects:
- (a)
Usefulness of the indicator in process monitoring: Most of the initial indicators are still considered useful. Only two indicators have been rejected for its uselessness: (1) copies of analytical reports, they lose importance with improvement of laboratory informatics systems, making easier the electronic requests and reporting of results. (2) Noncompliance in infrastructure, which could be useful individually but was not useful for the Group as the differences in this aspect are difficult to harmonize. Some have merged to form a new indicator, as in the case of the indicators of written and verbal complaints, which became the indicator of complaints of noncompliance. Whether they are written or verbal, the important fact is to know if this is a serious problem connected to a process. The indicators of noncompliance of computerized petitions and results were grouped together with the indicator of noncompliance of Information Technology (IT) connections between Laboratory Information System (LIS) and the client.
Some indicators related to supply adequacy have been added, as this aspect was considered important in terms of patient safety, as well as scope and efficiency (in the organization and resource management group). Other indicators to monitor processes which did not previously exist, became necessary with the evolution of laboratories (petition unification in the IT system of clinical management of hospitals of the region (Specialized care information system – SAP)) and also in order to make a quantification more objective and comparable with other work groups (indicator of hemolysis samples according to the hemolytic index ≥0.5g/L).11
- (b)
Indicator description: The lack of detail in the description of some indicators produces doubts in the provided results, mainly in those related to support and management processes where there is a certain degree of subjectivity (complaints and suggestions, nonconformities from suppliers of supplies and reagents or from subcontracted laboratories, quality objectives and projects). If there was not a clear definition and therefore no comparable results, the indicator has been withdrawn (evaluation of training, noncompliance of infrastructure). The definitions of all indicators have been revised; especially points which could lead to errors (see Tables 1–3). These definitions have then been included in the shared template used to collect indicator data among the Group.
- (c)
Data collection and sources: Another factor to be taken into account is the system applied by each laboratory. When data is difficult to obtain there is little participation from the members of the Group, giving less validity to the results and/or making them subject to uncertainty and a possible incorrect quantification. The automation or semi-automation has a positive contribution to the veracity of the data (indicators of request related to erroneous demographic data or tests): when the diagnosis is carried out by scanner it is more reliable than when done by a member of staff looking at each request individually. In the same way, if the staff have to register data manually, less data is registered (verbal complaints, IT connections, noncompliance of infrastructure, noncompliance from suppliers, unidentifiable samples and management incidences of samples between laboratories). As an accurate register of incidences was not made, this was dropped. The aim is to pinpoint how each laboratory collects data for each indicator, including the information in the template of the joint register, which will prove the reliability of the data. If the different members of the group had the same software tools available, this would obviously help to unify data collection, but currently this is not the case.
- (d)
Calculation formula: It is not always easy to get an indicator whose calculation formula directly reflects what it is supposed to be measuring. Sometimes approximations are given (indirect indicators) when it is difficult to access more direct data. This occurs in the different indicators depending on the sample type, where the denominator is the total of requests, representing the number of patients, in order to standardize the data collection and improve the comparability of results between the laboratories of the group.
This is because not all laboratories have quantification according to sample type, or they have a different way of recording them, resulting in an underestimation of sample numbers related to tests which are requested less frequently (stools, swabs, citrate or heparin tubes). In the future, the denominator to calculate them could be the analytical activity, defined as the number of determinations of the most frequently measured test in each sample type (i.e., creatinine for the tube to collect serum, complete blood count for the EDTA tube, etc.), as this data is easy to get hold of in all laboratories.
Whenever possible, indicators, which are still recorded in absolute values (complaints, noncompliance of suppliers, etc.), will be qualified with the denominator being the activity of the laboratory estimated by the total requests.
- (e)
Indicator specification:Table 4 shows (indicators of extra-analytical key processes), 5 (indicators of support processes) and 6 (indicators of strategic processes) and how they have evolved over time, being conditioned by the evaluation of accumulated data.For the majority of the indicators the specification is seen as a cut-off value (an annual average), as it is clearer. In the case of indicators related with achieving quality objectives or projects we have considerate it would be useful to use an interval, controlling the limit below the interval to reach the objective or project, and the upper limit precision in the definition of the objective or project to implement.
The Group assigned a value to establish preliminary specifications,2,3 which are later revised after five years of experience [2004–2008]7,8 to see if the original specifications were suited to reality. A further more thorough revision was carried out in 2013, in which specification was designed for all the indicators which still had none, and those for which there was a lack of data (incidences of allocation, tests not corresponding to the requests, unidentifiable samples, professional satisfaction, extraction centers, transport noncompliance and noncompliance from subcontracted laboratories) and the cut-off value was modified (fault repairs and maintenance hours of the analyzers, noncompliance of material suppliers and reagents and training, hours).
Revision and change of the requirements is representative of the actual functioning of the laboratories in the group along the years. Therefore, we can consider the new specification more robust and realistic than the initial, since incorporates the changes in the organization and the evolution of the laboratories during the period of evaluation. For example, the implementation of the electronic request in all the laboratories carried to restrict the specification for the indicator Data missing (demographic data or tests), whereas the difficulty in reducing the number of incidences related with the indicator Samples not received: urines (that is largely in the hands of the user and that affects especially to primary care) or with the “accidents at work” (in a lot of occasions linked to no predictable situations, like those which happen “in itinere”), carried to ease the specification for these indicators.
The indicators of erroneous data in patient identification and requests with incorrect data which are not detected in the laboratory are considered as sentinel indicators. A specification of 0 DPM (defects per million), >6 in the sigma scale is proposed for these indicators. For indicators of incidences in samples that do not arrive to the laboratory, or that are insufficient, coagulated or hemolyzed, specifications with sigma values above 4, are regarded as a good process control. However, it must be pointed out that here are processes whose specification approaches the minimum acceptable rating (global incidences in external samples and tests delivered with delay).
When taking into consideration the indicators used in international clinical laboratories and regarding the work of Plebani et al.,11 in which indicators of maximum priority correspond to key processes, our Group has an almost exact alignment in pre-analytic indicators, but more differences are found in post-analytical indicators. We are considering including some of them in the future, monitoring errors (report errors or results), postponing others due to the difficulty of data collection (delayed warning of critical values).
The number of quality indicators should be limited, an excess could mean that what is really important is not given sufficient priority. For this reason, in the future, in agreement with what has been established by the Quality indicators and patient security Group of the IFCC,11 a degree of priority will be given to each indicator and the participation index will be quantified for the different indicators.12 Those indicators for which data collection is difficult will be excluded, as well as those with little data, as they could reduce the validity of the results. A few global representative indicators should be selected, which would efficiently give information about the system: total number of requests, total number of samples, total number of results/report errors, total number of delayed results/reports, etc.13
Quality indicators used by the Group are dynamic. Their definition and/or specification has been redesigned to fit in with changes in the process itself (remove the indicator of report copies that they are currently computerized), the availability of more valid automatic data (new functions of LIS), using calculation formulas which are more efficient (more representative denominators) or more useful for organizational needs (introducing demand indicators). Quality specifications of the processes should be defined according to how they are controlled, and should be modified periodically by analyzing the data over time and/or depending on real possibilities of changing the process.
The harmonization in the definition of the indicators and their corresponding specifications, and the continuous monitoring of them, allows the laboratory to effectively and efficiently control his processes, especially those related to the risks management. The indicators assessment allows to know the prevalence of the failures/errors, analyze their causes and take actions to avoid their appearance, all is in order to increase patient safety. This profit is obtained, for example, with the improvement reflected by the results of the indicators, on the identification of the patient, the term of delivery, the number of no received samples, or the percentage of hemolyzed samples, allowing that the laboratory reports are complete, in time and with more reliable results. Probably, all this has also an economic impact on the health system, as it leads to a decrease in the number of medical visits, the number of new extractions or the number of complementary tests need for diagnostic. However, the quantification of the economic impact that results of this improvement is beyond of the aim of this study.
The last 10 years’ experience of the Catalonian Health Institute Working Group on Quality Indicators to design indicators and establish quality specifications has proved very useful to improve the control of processes in clinical laboratories integrating the group. We believe it would be useful to extend this working method to other laboratories.
Ethical disclosuresProtection of human and animal subjectsThe authors declare that the procedures followed were in accordance with the regulations of the responsible Clinical Research Ethics Committee and in accordance with those of the World Medical Association and the Helsinki Declaration
Confidentiality of dataThe authors declare that no patient data appears in this article.
Right to privacy and informed consentThe authors declare that no patient data appears in this article.
Conflict of interestThe authors declare no conflict of interest.
